➥🔝 7737669865 🔝▻ pathankot Call-girls in Women Seeking Men 🔝pathankot🔝 Esc...
A New Method for Determining the Size Distribution of Particles in CMP Slurries
1. Proc. 2010 International Conf. on Planarization/CMP Tech. Pg 348‐351 Page 1
A NEW METHOD FOR DETERMINING THE SIZE DISTRIBUTION OF
PARTICLES IN CMP SLURRIES
Gary Van Schooneveld, Mark R. Litchy and Donald C. Grant
CT Associates, Inc., 7121 Shady Oak Road, Eden Prairie, MN 55344, U.S.A.
gary@ctassociatesinc.com, mark@ctassociatesinc.com, don@ctassociatesinc.com
The particle size distribution (PSD) of the “working” particles in CMP slurries strongly
influences the efficacy of the planarization process. The techniques presently used to
determine the PSD typically only measure relative particle concentrations and often
presume the shape of the distribution. A new approach uniquely combining proven
techniques used for counting and sizing aerosol PSDs has been developed to measure
both particle size and number concentration in highly concentrated liquid suspensions.
This paper provides a brief description of the new measurement method along with
particle data from a number of production slurries using this method.
MEASUREMENT METHOD DESCRIPTION
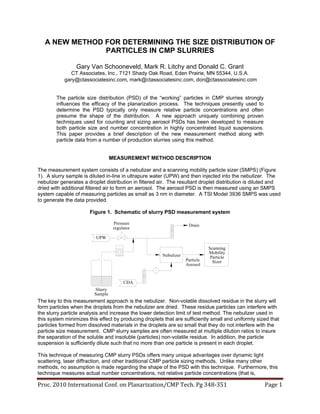
The measurement system consists of a nebulizer and a scanning mobility particle sizer (SMPS) (Figure
1). A slurry sample is diluted in-line in ultrapure water (UPW) and then injected into the nebulizer. The
nebulizer generates a droplet distribution in filtered air. The resultant droplet distribution is diluted and
dried with additional filtered air to form an aerosol. The aerosol PSD is then measured using an SMPS
system capable of measuring particles as small as 3 nm in diameter. A TSI Model 3936 SMPS was used
to generate the data provided.
Figure 1. Schematic of slurry PSD measurement system
The key to this measurement approach is the nebulizer. Non-volatile dissolved residue in the slurry will
form particles when the droplets from the nebulizer are dried. These residue particles can interfere with
the slurry particle analysis and increase the lower detection limit of test method. The nebulizer used in
this system minimizes this effect by producing droplets that are sufficiently small and uniformly sized that
particles formed from dissolved materials in the droplets are so small that they do not interfere with the
particle size measurement. CMP slurry samples are often measured at multiple dilution ratios to insure
the separation of the soluble and insoluble (particles) non-volatile residue. In addition, the particle
suspension is sufficiently dilute such that no more than one particle is present in each droplet.
This technique of measuring CMP slurry PSDs offers many unique advantages over dynamic light
scattering, laser diffraction, and other traditional CMP particle sizing methods. Unlike many other
methods, no assumption is made regarding the shape of the PSD with this technique. Furthermore, this
technique measures actual number concentrations, not relative particle concentrations (that is,
CDA
UPW
Nebulizer
Scanning
Mobility
Particle
SizerParticle
Aerosol
Slurry
Sample
Pressure
regulator
Drain
2. Proc. 2010 International Conf. on Planarization/CMP Tech. Pg 348‐351 Page 2
concentration of particles of one size relative to concentrations of another size) like other “working”
particle sizing techniques. Instruments that provide relative PSDs can lead to significant misinterpretation
when comparing different samples because they only provide measurements of relative concentrations
within each sample. This measurement method also directly measures number-weighted PSDs, which
may be easily converted to alternative weightings such diameter (D), surface area (D2
), or volume (D3
)
weighted distributions. Many other techniques measure intensity-weighted (D6
) PSDs which must be
converted to another weighting that is physically applicable to the process. This conversion can lead to
substantial uncertainties in the resultant number or volume-weighted PSDs. Since this technique
measures individual slurry particles, it is highly sensitive to measuring rather small changes in these
suspensions. Since the particle size measurement is based on particle electrical mobility, these
measurements are independent of the optical properties and density of the particles. The SMPS
measurement technique is a proven technique for measuring aerosol PSDs in the aerosol measurement
community for more than two decades (1) and is used to measure particle size standards by NIST (2).
TEST RESULTS
The sizing accuracy of the nebulizer-SMPS (N-SMPS) measurement system is shown in Figure 2. In the
left graph, the result of a three-size polystyrene latex particle mixture is shown. In right graph, a
combined solution of gold particles was measured. The sizing results correlate well with the
manufacturer’s sizing and standard deviation data.
Figure 2. Measurement of standard particles using the N-SMPS system
The results from the N-SMPS used to measure a multi-modal colloidal silica slurry are presented in Figure
3. As discussed previously, the N-SMPS directly measures particle concentration of the slurry. Assuming
that the particles measured are spherical, diameter, area and volume-weighted distribution can easily be
calculated from the number concentrations. Using the number-weighted distribution allows for good
resolution of the small particle portion of the distribution while the volume-weighted distribution provides
better detail for the larger particle sizes.
The potential advantages of directly measuring the number and size of the slurry particles and not having
to assume a particle size distribution are seen in Figure 4. In this evaluation, factory-fresh colloidal slurry
is compared to reclaimed and reprocessed slurry using three techniques; dynamic light scatter (DLS),
laser diffraction (LD) and nebulizer-SMPS. The data from the dynamic light scattering and laser
diffraction instrument do not show a significant difference between the two slurries. In addition, there is
limited, if any, data provided concerning the modality of the slurry. Meanwhile, the nebulizer-SMPS
system clearly shows that the slurry is tri-modal. In addition, the method detected a non-uniform increase
in the particle concentration between the reclaimed slurry compared to the factory fresh slurry with the
concentration of small particles (10-50 nm) increasing more than the concentration of the large particles
(80-400 nm). An overall increase in concentration for the reclaimed slurry was later revealed to be
consistent with the reprocessing method used, but the non-uniformity was not expected.
20 and 30 nm gold particles mixture
Particle diameter (nm)
20 30 40 50 60 70 80 9010 100
Differentialnumberconcentration
d(#/mL)/dlog(DP)
0.0
5.0e+11
1.0e+12
1.5e+12
2.0e+12
2.5e+12
20, 50, 83 nm PSL Mixture
Particle diameter (nm)
0 10 20 30 40 50 60 70 80 90 100
Differentialvolumeweightedconcentration
3. Proc. 2010 International Conf. on Planarization/CMP Tech. Pg 348‐351 Page 3
Figure 3. Example of a tri-modal colloidal silica slurry using the N-SMPS system
Figure 4. Three technique comparison of new and reclaimed colloidal silica slurry
The ability to directly measuring particle concentration of slurry allows for detecting potential cross-
contamination of slurries. Figure 5 shows the effect of adding a small amount of silica slurry to alumina
slurry. Establishing “cross-contamination finger-prints” such as these could be useful in detecting cross-
contamination events that might occur in the fab or at the slurry manufacturer.
Area-weighted distribution
Particle diameter (nm)
10 100
Differentialnumberconcentration
dnm
2
/ml/dlog(DP)
0.0
2.0e+17
4.0e+17
6.0e+17
8.0e+17
1.0e+18
1.2e+18
1.4e+18
Volume-weighted distribution
Particle diameter (nm)
10 100
Differentialvolumeweightedconcentration
dnm
3
/ml/dlog(DP)
0
1e+18
2e+18
3e+18
4e+18
5e+18
Diameter-weighted distribution
Particle diameter (nm)
10 100
Differentialdiameterweightedconcentration
dnm/ml/dlog(DP)
0
5e+14
1e+15
2e+15
2e+15
3e+15
3e+15
Number-weighted distribution
Particle diameter (nm)
10 100
Differentialnumberconcentration
d#/ml/dlog(DP)
0.0
2.0e+13
4.0e+13
6.0e+13
8.0e+13
1.0e+14
1.2e+14
Volume-Weighted Distribution - LD
Particle diameter (nm)
10 20 30 40 50 100 200 500
FractionofDistribution(%)
0
5
10
15
20
Fresh slurry
Reclaimed slurry
Volume-Weighted Distribution - DLS
Particle Diameter (nm)
10 100 1000
FractionofDistribution(%)
0
1
2
3
Fresh slurry
Reclaimed slurry
Small Particle - N-SMPS
Particle diameter (nm)
8 9 15 20 25 30 40 50 60 70 8010
Differentialnumberconcentration
d(#/mL)/dlog(DP)
0
1e+14
2e+14
3e+14
4e+14
5e+14
Fresh slurry
Reclaimed slurry
Large Particle - N-SMPS
Particle Diameter (nm)
40 50 60 70 80 90 200 300 400 500100
DifferentialNumberConcentration
d(#/cm
3
)/dlog(Dp)
0.0
5.0e+13
1.0e+14
1.5e+14
2.0e+14
Fresh Slurry
Reclaim Slurry
4. Proc. 2010 International Conf. on Planarization/CMP Tech. Pg 348‐351 Page 4
It is well established that handling of slurry can result in changes in the particle size distribution and
agglomeration of slurry particles (3). Figure 6 shows the cumulative effect of circulating a batch of
colloidal silica slurry. As the number of turn-overs (passes through the pumping system) increase, the
concentration of small particles decreases (left graph) and the number of large particles increases (right
graph). These data would suggest that this slurry is susceptible to handling damage with small particle
agglomerating to form large particles.
Figure 5. Cross-contamination detection of an alumina/colloidal silica mixture
Figure 6. Example of changes in the PSD measured during circulation of a colloidal silica slurry
SUMMARY
A new test method has been developed that provides the ability to directly measure number-weighted
size distributions of particles in CMP slurries. Since the method directly measures particle concentrations
and can detect particle sizes down to 3 nm, detailed information concerning the small slurry particles (<
50 nm) can be accurately determined and small differences in concentrations for all particle sizes
between slurry samples can be identified.
REFERENCES
1. Wang SC and RC Flagan (1989). “Scanning Electrical Mobility Spectrometer,” Division of Engineering
and Applied Science, California Institute of Technology, Pasadena, CA 91125, pp. 138-178.
2. Donnelly, MK and Mulholland (2003). “Particle size Measurement for Spheres with Diameters of 50 to
400 nm”, National Institute of Standards and Technology, Report # NISTIR 6935.
3. Litchy MR and DC Grant (2007). “Effect of Pump Type on the health of various CMP slurries”,
Semiconductor Fabtech, 33rd
Edition, pp 53-59.
Particle Diameter (nm)
20 30 40 50 60 70 80 200 300 400 50060010 100
DifferentialNumberConcentration
d(#/cm
3
)/dlog(Dp)
0.0
1.0e+13
2.0e+13
3.0e+13
4.0e+13
5.0e+13
6.0e+13
100% alumina slurry
90% alumina/
10% silica slurry
Particle Diameter (nm)
20 30 40 50 60 70 80 200 300 400 50060010 100
DifferentialVolumeConcentration
d(nm
3
/cm
3
)/dlog(Dp)
0.0
5.0e+18
1.0e+19
1.5e+19
2.0e+19
Number-weighted concentrations
Particle diameter (nm)
20 30 40 50 60 70 80 90 150 200 300 400100
Differentialnumberconcentration
d(#/ml)/dln(DP
)
0
2e+10
4e+10
6e+10
8e+10
Initial
10T
20T
50T
100T
197T
508T
1013T
3217T
Volume-weighted concentrations
Particle diameter (nm)
20 30 40 50 60 70 80 90 150 200 300 400100
Differentialvolumeconcentration
d(nm
3
/ml)/dln(DP)
0.0
2.0e+16
4.0e+16
6.0e+16
8.0e+16
1.0e+17
1.2e+17
Initial
10T
20T
50T
100T
197T
508T
1013T
3217T