Call Girls Kengeri Satellite Town Just Call 👗 7737669865 👗 Top Class Call Gir...
Fs12 3108
1. Reserve-Growth Assessment Project
Assessment of Potential Additions to Conventional Oil and
Gas Resources in Discovered Fields of the United States from
Reserve Growth, 2012
The U.S. Geological Survey estimated volumes of technically recoverable, conventional petroleum
resources that have the potential to be added to reserves from reserve growth in 70 discovered oil and gas
accumulations of the United States, excluding Federal offshore areas. The mean estimated volumes are
32 billion barrels of crude oil, 291 trillion cubic feet of natural gas, and 10 billion barrels of natural gas
liquids.
Introduction efficiency, and recalculation of reserves due to
The U.S. Geological Survey (USGS) estimated changing economic and operating conditions.
volumes of technically recoverable, conventional oil Unlike past estimates of reserve growth that relied
and gas resources that have the potential to be added entirely on statistical extrapolations of growth trends,
to reserves (called “reserve growth” hereafter) in this assessment is based in part on detailed analysis of
70 discovered accumulations of the United States, geology and engineering practices used in the assessed
excluding Federal offshore areas. Most reserve producing accumulations. The assessment used pub-
growth results from delineation of new reservoirs, lished and commercial, proprietary sources of geologic
field extensions, improved technology that enhances information and field production data.
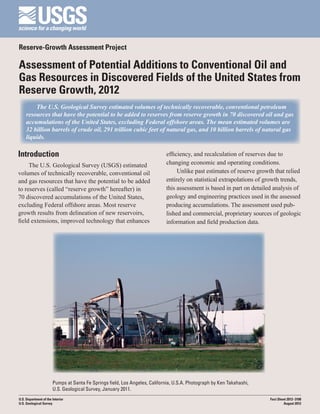
Pumps at Santa Fe Springs field, Los Angeles, California, U.S.A. Photograph by Ken Takahashi,
U.S. Geological Survey, January 2011.
U.S. Department of the Interior Fact Sheet 2012–3108
U.S. Geological Survey August 2012
2. Methodology Reserve growth of oil was assessed for oil accu-
mulations (accumulations having a gas-to-oil ratio
In the past, the USGS estimated reserve growth of less than 20,000 cubic feet of recoverable natural
by statistical curve-fitting, regression methods using gas per barrel of recoverable crude oil), and nonas-
historical data on known recoverable oil and gas
sociated gas was assessed for only gas accumulations
(cumulative production plus remaining reserves).
(20,000 cubic feet of recoverable natural gas per bar-
Those regression methods were based on growth rates
rel of recoverable crude oil or more). Reserve growth
averaged by the number of years since accumulation
of coproducts was calculated by statistical combina-
discovery. Accumulations within mature petroleum
tion (multiplication) using Monte Carlo simulation
provinces that exhibit volumetrically significant
of the reserve growth of the primary commodity (oil
reserve growth, however, cause bias regression models
of the data. Therefore, accumulations that have grown or gas) with the volumetric coproduct ratios. The
by greater proportions than other accumulations of growth of associated and dissolved gas, along with
similar age are best analyzed separately from those natural gas liquids in the associated and dissolved
with only minor reserve growth. Reserve growth gas, was calculated for oil fields. The growth of oil
in fields of the United States was analyzed to deter- plus natural gas liquids (total liquids) was calcu-
mine which fields contributed most to reserve growth lated for nonassociated gas fields. Coproduct reserve
between 1982 and 2006, using field- and reservoir- growth was not estimated for fields having unre-
production data from a commercial, proprietary ported coproduct volumes.
database. Growth of oil reserves in the 68 assessed indi-
The assessment methodology used to assess vidual oil accumulations accounts for about 70 per-
reserve growth in conventional accumulations of U.S. cent of the potential reserve growth of the United
fields is described in Klett and others (2011). The States; the other 30 percent attributed to smaller
primary data used to estimate reserve growth are origi- accumulations was estimated by regression methods.
nal in-place volumes and recovery factors. Identified Almost all of the reserve growth of nonassociated gas
unconventional (continuous) oil and gas accumula- and liquids in gas accumulations was estimated by
tions were excluded from the assessment. regression methods. Although identified unconven-
Fifty-five large oil fields and 35 large gas fields tional accumulations were not included in the assess-
significantly contributed to reserve growth during ment, unrecognized unconventional accumulations,
the time of the dataset. Within the 55 oil fields, 68 particularly gas in tight reservoirs, might have been
individual conventional accumulations (reservoirs or included. Inclusion of unconventional accumulations
groups of reservoirs) were identified and assessed. Of greatly affects the assessment results by providing
the 35 gas fields, only 2 accumulations were individu- unrealistically large estimates.
ally assessed. Unconventional accumulations contrib-
uted to reserve growth in the remaining 33 gas fields, Assessment Results
which were excluded from the assessment. Once the
identified unconventional reservoirs were removed, Estimated mean volumes of technically recover-
many of the 33 gas fields showed little significant able, conventional oil and gas resources of the United
reserve growth and were assessed by regression States that have the potential to be added to reserves
methods. from reserve growth are listed in table 1. The esti-
Probability distributions were assigned to reported mates are about 32 billion barrels (BB) of crude oil,
original in-place volumes and to reported recovery 291 trillion cubic feet (TCF) of natural gas (50 TCF
factors. The original in-place and recovery factor of associated and dissolved natural gas and 241 TCF
distributions assigned to a given accumulation were of nonassociated natural gas), and 10 BB of natural
statistically combined (multiplied) by Monte Carlo gas liquids (3 BB of natural gas liquids in oil accu-
simulation, and known recoverable volumes were mulations and 7 BB of total liquids in nonassociated
subtracted to provide a probability distribution of gas accumulations). No attempt was made to estimate
estimated reserve growth. Estimates of reserve growth economically recoverable resources. Continuous, or
for each accumulation were aggregated together and unconventional, oil and gas accumulations, such as
aggregated with estimates of reserve growth calcu- shale gas, tight gas, tight oil, and tar sands, were not
lated by regression methods. included in this study.
3. Table 1. Estimated reserve growth of discovered accumulations of the United States (technically recoverable, conventional
petroleum resources).
[BB, billion barrels; TCF, trillion cubic feet. For gas fields, all liquids are included under the natural gas liquids (NGL) category. Accums.,
accumulations. F95 denotes a 95-percent chance of at least the amount tabulated. Other fractiles are defined similarly. Negative values
indicate the possibility that reported reserves could decrease. Fractiles are not additive except under the assumption of perfect positive
correlation. Gray shading indicates not applicable]
Reserve growth by assessment Number Estimated reserve growth
method for discovered fields of the Field Oil (BB) Gas (TCF) NGL (BB)
of
United States type F50 F5 Mean F50 F5 Mean
accums. F95 F50 F5 Mean F95 F95
Oil 68 22 32 2
Individual accumulation analysis
Gas 2 0.3 -0.2
Oil 9,168 10 18 1
Regression method
Gas 5,169 241 7
Aggregated reserve growth Oil 9,236 23 31 41 32 39 50 62 50 2 3 4 3
by commodity Gas 5,171 187 240 298 241 6 7 9 7
Total reserve growth 14,407 32 291 10
Estimated mean volumes of technically recov- 4. For the Gulf Coast region, about 3,448 MMB
erable, conventional oil and gas resources of U.S. of crude oil, 143,557 BCF of natural gas (8,576 BCF
regions that have the potential to be added to reserves of associated and dissolved natural gas and 134,981
from reserve growth are listed in table 2. They are as BCF of nonassociated natural gas), and 4,814 MMB
follows: of natural gas liquids (412 MMB of natural gas
1. For the combined Alaska and the Pacific
liquids in oil accumulations and 4,402 MMB of total
regions, about 20,210 million barrels (MMB) of
crude oil, 31,921 billion cubic feet (BCF) of natural liquids in nonassociated gas accumulations).
gas (23,717 BCF of associated and dissolved natural 5. For the combined Midcontinent and Eastern
gas and 8,204 BCF of nonassociated natural gas), and regions, about 1,522 MMB of crude oil, 45,318 BCF
1,466 MMB of natural gas liquids (1,443 MMB of of natural gas (1,561 BCF of associated and dis-
natural gas liquids in oil accumulations and 23 MMB solved natural gas and 43,757 BCF of nonassociated
of total liquids in nonassociated gas accumulations). natural gas), and 788 MMB of natural gas liquids
2. For the Colorado Plateau and Basin and Range (89 MMB of natural gas liquids in oil accumulations
region, which was combined with the Rocky Moun- and 699 MMB of total liquids in nonassociated gas
tains and Northern Great Plains region, about 1,730 accumulations).
MMB of crude oil, 18,434 BCF of natural gas (2,359
The combined Alaska and the Pacific Coast
BCF of associated and dissolved natural gas and
16,075 BCF of nonassociated natural gas), and 561 regions should have the greatest amount of oil reserve
MMB of natural gas liquids (149 MMB of natural growth, whereas the Gulf Coast region should have
gas liquids in oil accumulations and 412 MMB of the greatest amount of gas reserve growth.
total liquids in nonassociated gas accumulations).
3. For the West Texas and Eastern New Mexico For Further Information
region, about 4,855 MMB of crude oil, 51,721 BCF
Supporting geologic studies of total petroleum
of natural gas (13,601 BCF of associated and dis-
solved natural gas and 38,120 BCF of nonassociated systems and assessment units, and reports on the
natural gas), and 2,699 MMB of natural gas liquids methodology used in this assessment of the world
(881 MMB of natural gas liquids in oil accumula- outside the United States, as well as the assessment
tions and 1,818 MMB of total liquids in nonassoci- results, are available at the USGS Energy website:
ated gas accumulations). http://energy.usgs.gov/.
4. Table 2. Estimated reserve growth of discovered accumulations in regions of the United States (technically recoverable,
conventional petroleum resources).
[MMB, million barrels; BCF, billion cubic feet. For gas fields, all liquids are included under the natural gas liquids (NGL) category. F95
denotes a 95-percent chance of at least the amount tabulated. Other fractiles are defined similarly. Negative values indicate the possibility
that reported reserves could decrease. Fractiles are not additive except under the assumption of perfect positive correlation. Gray shading
indicates not applicable]
Number Estimated reserve growth
Regions of the United States Field Oil (MMB) Gas (BCF) NGL (MMB)
of
type F50 F5 Mean F50 F5 Mean
fields F95 F50 F5 Mean F95 F95
Oil 296 12,849 19,894 28,603 20,210 15,347 23,439 33,016 23,717 900 1,426 2,043 1,443
Alaska and Pacific Coast
Gas 154 4,021 7,867 13,479 8,204 11 22 38 23
Total 450 20,210 31,921 1,466
Colorado Plateau and Basin and Oil 1,402 1,287 1,712 2,223 1,730 1,823 2,335 2,961 2,359 116 148 186 149
Range, and Rocky Mountains
and Northern Great Plains Gas 243 6,541 14,810 29,529 16,075 168 379 756 412
Total 1,645 1,730 18,434 561
West Texas and Eastern Oil 2,511 2,952 4,786 6,983 4,855 10,181 13,521 17,319 13,601 607 873 1,184 881
New Mexico Gas 774 25,407 37,256 53,613 38,120 1,212 1,777 2,557 1,818
Total 3,285 4,855 51,721 2,699
Oil 2,239 2,671 3,422 4,310 3,448 6,766 8,515 10,555 8,576 320 409 514 412
Gulf Coast
Gas 2,712 98,050 134,783 172,103 134,981 3,195 4,395 5,612 4,402
Total 4,951 3,448 143,557 4,814
Oil 2,788 1,146 1,503 1,962 1,522 1,228 1,546 1,944 1,561 -22 79 230 89
Midcontinent and Eastern
Gas 1,288 28,738 43,055 61,280 43,757 409 687 1,032 699
Total 4,076 1,522 45,318 788
Reference Cited
Klett, T.R., Attanasi, E.D., Charpentier, R.R., Cook,
T.A., Freeman, P.A., Gautier, D.L., Le, P.A., Ryder,
R.T., Schenk, C.J., Tennyson, M.E., and Verma,
M.K., 2011, New U.S. Geological Survey method
for the assessment of reserve growth: U.S. Geolog-
ical Survey Scientific Investigations Report 2011-
5163, 8 p., accessed August 1, 2012, at http://pubs.
usgs.gov/sir/2011/5163/.
Reserve Growth Assessment Team
Timothy R. Klett (tklett@usgs.gov), Troy A.
Cook, Ronald R. Charpentier, Marilyn E. Tennyson,
Emil D. Attanasi, Phil A. Freeman, Robert T. Ryder,
Donald L. Gautier, Mahendra K. Verma, Phuong A.
Le, and Christopher J. Schenk.