
Recommended
Recommended
More Related Content
Similar to 1.A local restaurant is committed to providing its patr.docx
Similar to 1.A local restaurant is committed to providing its patr.docx (20)
More from joyjonna282
More from joyjonna282 (20)
Recently uploaded
Recently uploaded (20)
1.A local restaurant is committed to providing its patr.docx
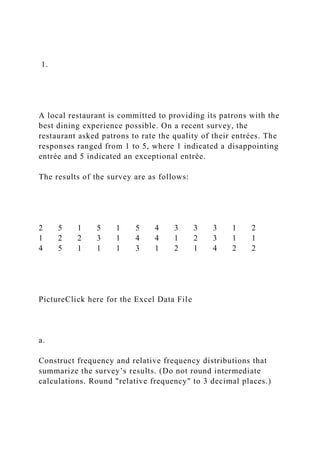
- 1. 1. A local restaurant is committed to providing its patrons with the best dining experience possible. On a recent survey, the restaurant asked patrons to rate the quality of their entrées. The responses ranged from 1 to 5, where 1 indicated a disappointing entrée and 5 indicated an exceptional entrée. The results of the survey are as follows: 2 5 1 5 1 5 4 3 3 3 1 2 1 2 2 3 1 4 4 1 2 3 1 1 4 5 1 1 1 3 1 2 1 4 2 2 PictureClick here for the Excel Data File a. Construct frequency and relative frequency distributions that summarize the survey’s results. (Do not round intermediate calculations. Round "relative frequency" to 3 decimal places.)
- 2. Rating Frequency Relative Frequency 5 4 3 2 1 Total b. Are patrons generally satisfied with the quality of their entrées? No Yes rev: 07_05_2013_QC_32367, 03_04_2014_QC_44527 2. Consider the following data set: 1 10 5 6 8 8 10 12 15 12 8 11 8 4 3 9 12 3 10 8 8 12 4 4 4 12 10 6 11 6 7 -6 31 16 -3 9 13 6 5 -4 29 -3 5 3 24 24 10 23 32 2 -5 -4 -2 14 -2 35 26 10 18 28
- 3. 5 3 -6 7 28 36 16 3 -4 5 a-1. Construct a frequency distribution using classes of −10 up to 0, 0 up to 10, etc. Classes Frequency –10 up to 0 0 up to 10 10 up to 20 20 up to 30 30 up to 40 Total a-2. How many of the observations are at least 10 but less than 20? Number of observations b-1. Construct a relative frequency distribution and a cumulative relative frequency distribution. (Round "relative frequency" and "cumulative relative frequency" to 3 decimal places.) Class Relative Frequency Cumulative Relative Frequency –10 up to 0 0 up to 10 10 up to 20 20 up to 30 30 up to 40 Total
- 4. b-2. What percent of the observations are at least 10 but less than 20? (Round your answer to 1 decimal place.) Percent of observations % b-3. What percent of the observations are less than 20? (Round your answer to 1 decimal place.) Percent of observations % c. Is the distribution symmetric? If not, then how is it skewed? Not symmetric, skewed to right Symmetric or Skewed to left rev: 07_05_2013_QC_32367 3. Assume that X is a binomial random variable with n = 16 and p = 0.66. Calculate the following probabilities. (Round your intermediate and final answers to 4 decimal places.) a. P(X = 15) b. P(X = 14) c. P(X ≥ 14) rev: 04_26_2013_QC_29765; rev: 08_07_20
- 5. 4. A professor of management has heard that twelve students in his class of 52 have landed an internship for the summer. Suppose he runs into two of his students in the corridor. a. Find the probability that neither of these students has landed an internship. (Round your intermediate calculations and final answer to 4 decimal places.) formula176.mml b. Find the probability that both of these students have landed an internship. (Round your intermediate calculations and final answer to 4 decimal places.) P(T1 ∩ T2) rev: 08_06_2013_QC_32707 5. Market observers are quite uncertain whether the stock market has bottomed out from the economic meltdown that began in 2008. In an interview on March 8, 2009, CNBC interviewed two prominent economists who offered differing views on whether
- 6. the U.S. economy was getting stronger or weaker. An investor not wanting to miss out on possible investment opportunities considers investing $15,000 in the stock market. He believes that the probability is 0.25 that the market will improve, 0.42 that it will stay the same, and 0.33 that it will deteriorate. Further, if the economy improves, he expects his investment to grow to $23,000, but it can also go down to $10,000 if the economy deteriorates. If the economy stays the same, his investment will stay at $15,000. a. What is the expected value of his investment? Expected value $ b. What should the investor do if he is risk neutral? Investor invest the $15,000. c. Is the decision clear-cut if he is risk averse? Yes No rev: 08_07_2013_QC_33420, 11_01_2013_QC_37895 6. An investment strategy has an expected return of 12 percent and
- 7. a standard deviation of 8 percent. Assume investment returns are bell shaped. a. How likely is it to earn a return between 4 percent and 20 percent? (Enter your response as decimal values (not percentages) rounded to 2 decimal places.) Probability b. How likely is it to earn a return greater than 20 percent?(Enter your response as decimal values (not percentages) rounded to 2 decimal places.) Probability c. How likely is it to earn a return below −4 percent?(Enter your response as decimal values (not percentages) rounded to 2 decimal places.)
- 8. Probability rev: 02_26_2014_QC_44958, 07_12_2014_QC_51377 7. Consider the following frequency distribution: Class Frequency 10 up to 20 21 20 up to 30 22 30 up to 40 33 40 up to 50 12 a. Construct a relative frequency distribution. (Round your answers to 3 decimal places.) Class Relative Frequency 10 up to 20 20 up to 30 30 up to 40 40 up to 50 Total
- 9. b. Construct a cumulative frequency distribution and a cumulative relative frequency distribution. (Round "cumulative relative frequency" to 3 decimal places.) Class Cumulative Frequency Cumulative Relative Frequency 10 up to 20 20 up to 30 30 up to 40 40 up to 50 c-1. What percent of the observations are at least 20 but less than 30? (Round your answer to 1 decimal place.) Percent of observations c-2. What percent of the observations are less than 20? (Round your
- 10. answer to 1 decimal place.) Percent of observations rev: 07_05_2013_QC_32367, 08_12_2013_QC_33620 8. Scores on the final in a statistics class are as follows. 68 24 70 56 72 76 74 116 87 55 82 88 54 66 64 58 84 60 79 62 PictureClick here for the Excel Data File a. Calculate the 25th, 50th, and 75th percentiles. (Do not round intermediate calculations. Round your answers to 2 decimal places.) 25th percentile
- 11. 50th percentile 75th percentile b-1. Calculate the IQR, lower limit and upper limit to detect outliers. (Negative value should be indicated by a minus sign. Round your intermediate calculations to 4 decimal places and final answers to 2 decimal places.) IQR Lower limit Upper limit b-2. Are there any outliers? Yes No rev: 07_31_2013_QC_32713, 09_13_2013_QC_34880, 10_31_2013_QC_38175, 03_03_2014_QC_44705, 09_24_2014_QC_54188 9. The estimation of which of the following requires sampling?
- 12. Total rainfall in Phoenix, Arizona, in 2010 The average SAT score of incoming freshmen at a university U.S. unemployment rate The Cleveland Indians' hitting percentage in 2010 10. A researcher conducts a mileage economy test involving 79 cars. The frequency distribution describing average miles per gallon (mpg) appears in the following table. Average mpg Frequency 15 up to 20 7 20 up to 25 15 25 up to 30 14 30 up to 35 27 35 up to 40 12 40 up to 45 4 a. Construct the corresponding relative frequency, cumulative frequency, and cumulative relative frequency distributions. (Round "relative frequency" and "cumulative relative frequency" to 4 decimal places.) Average mpg Relative Frequency Cumulative
- 13. Frequency Cumulative Relative Frequency 15 up to 20 20 up to 25 25 up to 30
- 14. 30 up to 35 35 up to 40 40 up to 45
- 15. Total b-1. How many of the cars got less than 20 mpg? Number of cars b-2. What percent of the cars got at least 25 but less than 30 mpg? (Round your answer to 2 decimal places.) Percentage of cars b-3. What percent of the cars got less than 30 mpg? (Round your answer to 2 decimal places.) Percentage of cars b-4. What percent got 30 mpg or more? (Round your answer to 2 decimal places.) Percentage of cars rev: 07_05_2013_QC_32367 11.
- 16. Consider the following joint probability table. B1 B2 B3 B4 A 0.14 0.10 0.15 0.09 Ac 0.15 0.17 0.10 0.10 PictureClick here for the Excel Data File a. What is the probability that A occurs? (Round your answer to 2 decimal places.) Probability b. What is the probability that B2 occurs? (Round your answer to 2 decimal places.) Probability c. What is the probability that Ac and B4 occur? (Round your answer to 2 decimal places.) Probability d. What is the probability that A or B3 occurs? (Round your answer to 2 decimal places.) Probability e. Given that B2 has occurred, what is the probability that A occurs? (Round your intermediate calculations and final answers to 4 decimal places.)
- 17. Probability f. Given that A has occurred, what is the probability that B4 occurs? (Round your intermediate calculations and final answers to 4 decimal places.) Probability rev: 08_06_2013_QC_32707 12. Consider the following cumulative relative frequency distribution. Class Cumulative Relative Frequency 150 up to 200 0.19 200 up to 250 0.26 250 up to 300 0.55 300 up to 350 1.00 a-1. Construct a relative frequency distribution. (Round your answers to 2 decimal places.) Class Relative Frequency 150 up to 200 200 up to 250 250 up to 300 300 up to 350 Total
- 18. a-2. What percent of the observations are at least 250 but less than 300? Percent of observations 13. Christine has always been weak in mathematics. Based on her performance prior to the final exam in Calculus, there is a 53% chance that she will fail the course if she does not have a tutor. With a tutor, her probability of failing decreases to 23%. There is only a 63% chance that she will find a tutor at such short notice. a. What is the probability that Christine fails the course? (Round your answer to 4 decimal places.) Probability b. Christine ends up failing the course. What is the probability that she had found a tutor? (Round your answer to 4 decimal places.) Probability rev: 08_06_2013_QC_32707 14.
- 19. A 2010 poll conducted by NBC asked respondents who would win Super Bowl XLV in 2011. The responses by 20,925 people are summarized in the following table. Team Number of Votes Atlanta Falcons 4,100 New Orleans Saints 1,860 Houston Texans 1,900 Dallas Cowboys 1,641 Minnesota Vikings 1,500 Indianapolis Colts 1,159 Pittsburgh Steelers 1,155 New England Patriots 1,106 Green Bay Packers 1,087 Others a. How many responses were for “Others”? Number of responses b. The Green Bay Packers won Super Bowl XLV, defeating the Pittsburgh Steelers by the score of 31–25. What proportion of respondents felt that the Green Bay Packers would win? (Round your answer to 3 decimal places.) Proportion of respondents rev: 07_05_2013_QC_32367 15.
- 20. Consider the following population data: 37 41 14 11 23 a. Calculate the range. Range b. Calculate MAD. (Round your intermediate calculations to 4 decimal places and final answer to 2 decimal places.) MAD c. Calculate the population variance. (Round your intermediate calculations to 4 decimal places and final answer to 2 decimal places.) Population variance d. Calculate the population standard deviation. (Round your intermediate calculations to 4 decimal places and final answer to 2 decimal places.) Population standard deviation rev: 07_31_2013_QC_32713 16.
- 21. Professor Sanchez has been teaching Principles of Economics for over 25 years. He uses the following scale for grading. Grade Numerical Score Probability A 4 0.100 B 3 0.240 C 2 0.430 D 1 0.125 F 0 0.105 Part (a) omitted b. Convert the above probability distribution to a cumulative probability distribution. (Round your answers to 3 decimal places.) Grade P(X ≤ x) F D C B A c. What is the probability of earning at least a B in Professor Sanchez’s course? (Round your answer to 3 decimal places.) Probability d.
- 22. What is the probability of passing Professor Sanchez’s course? (Round your answer to 3 decimal places.) Probability rev: 02_28_2014_QC_45290 17. A basketball player is fouled while attempting to make a basket and receives two free throws. The opposing coach believes there is a 55% chance that the player will miss both shots, a 25% chance that he will make one of the shots, and a 20% chance that he will make both shots. a. Construct the appropriate probability distribution. (Round your answers to 2 decimal places.) x P(X = x) 0 1 2 b. What is the probability that he makes no more than one of the shots? (Round your answer to 2 decimal places.) Probability c.
- 23. What is the probability that he makes at least one of the shots? (Round your answer to 2 decimal places.) Probability rev: 09_13_2013_QC_35141 18. Records show that 13% of all college students are foreign students who also smoke. It is also known that 50% of all foreign college students smoke. What percent of the students at this university are foreign? Percent of the students % 19. Determine whether the following probabilities are best categorized as subjective, empirical, or classical probabilities. a. Before flipping a fair coin, Sunil assesses that he has a 50% chance of obtaining tails. Subjective probability Empirical probability Classical probability
- 24. b. At the beginning of the semester, John believes he has a 90% chance of receiving straight A’s. Subjective probability Empirical probability Classical probability c. A political reporter announces that there is a 48% chance that the next person to come out of the conference room will be a Republican, since there are 85 Republicans and 91 Democrats in the room. Subjective probability Empirical probability Classical probability 20. A data set has a mean of 1,080 and a standard deviation of 80. a. Using Chebyshev's theorem, what percentage of the observations fall between 760 and 1,400? (Do not round intermediate calculations. Round your answer to the nearest whole percent.)
- 25. Percentage of observations b. Using Chebyshev’s theorem, what percentage of the observations fall between 920 and 1,240? (Do not round intermediate calculations. Round your answer to the nearest whole percent.) Percentage of observations rev: 07_31_2013_QC_32713 21. Let P(A) = 0.62, P(B) = 0.27, and P(A ∩ B) = 0.17. a. Calculate P(A | B). (Round your answer to 2 decimal places.) P(A | B) b. Calculate P(A U B). (Round your answer to 2 decimal places.) P(A U B) c. Calculate P((A U B)c). (Round your answer to 2 decimal places.) P((A U B)c) rev: 08_06_2013_QC_32707 22.
- 26. Let P(A) = 0.51, P(B | A) = 0.36, and P(B | Ac) = 0.14. Use a probability tree to calculate the following probabilities: (Round your answers to 3 decimal places.) a. P(Ac) b. P(A ∩ B) P(Ac ∩ B) c. P(B) d. P(A | B) rev: 08_06_2013_QC_32707, 10_09_2014_QC_55407 23. Consider the following observations from a population: 133 240 38 93 93 26 184 108 38 PictureClick here for the Excel Data File a. Calculate the mean and median. (Round "mean" to 2 decimal places.) Mean Median
- 27. b. Select the mode. (You may select more than one answer. Single click the box with the question mark to produce a check mark for a correct answer and double click the box with the question mark to empty the box for a wrong answer.) 240 26 108 133 38 93 184 rev: 07_31_2013_QC_32713 24. An analyst thinks that next year there is a 40% chance that the world economy will be good, a 10% chance that it will be neutral, and a 50% chance that it will be poor. She also predicts probabilities that the performance of a start-up firm, Creative Ideas, will be good, neutral, or poor for each of the economic states of the world economy. The following table presents probabilities for three states of the world economy and the corresponding conditional probabilities for Creative Ideas. State of the World Economy Probability of Economic State Performance
- 28. of Creative Ideas Conditional Probability of Creative Ideas Good 0.40 Good 0.20 Neutral 0.30 Poor 0.50 Neutral 0.10 Good 0.40 Neutral 0.10 Poor 0.50 Poor 0.50 Good 0.40 Neutral 0.40 Poor 0.20 PictureClick here for the Excel Data File a. What is the probability that the performance of the world economy will be neutral and that of creative ideas will be poor? (Round your answer to 2 decimal places.) Probability b. What is the probability that the performance of Creative Ideas will be poor? (Round your answer to 2 decimal places.) Probability c. The performance of Creative Ideas was poor. What is the probability that the performance of the world economy had also been poor? (Round your answer to 2 decimal places.)
- 29. Probability rev: 08_06_2013_QC_32707 25. Complete the following probability table. (Round Prior Probability answers to 2 decimal places and intermediate calculations and other answers to 4 decimal places.) Prior Probability Conditional Probability Joint Probability Posterior Probability P(B) 0.53 P(A | B) 0.15 P(A ∩ B ) P(B | A) P(Bc) P(A | Bc) 0.38 P(A ∩ Bc) P(Bc | A) Total P(A) Total rev: 08_06_2013_QC_32707 26. Consider the following sample data: x 8 10 7 5 2 y 11 2 7 4 8 a. Calculate the covariance between the variables. (Round your
- 30. intermediate calculations to 4 decimal places and final answer to 2 decimal places.) Covariance b-1. Calculate the correlation coefficient. (Round your intermediate calculations to 4 decimal places and final answer to 2 decimal places.) Correlation coefficient b-2. Interpret the correlation coefficient. There is relationship between x and y. rev: 07_31_2013_QC_32713 27. India is the second most populous country in the world, with a population of over 1 billion people. Although the government has offered various incentives for population control, some argue that the birth rate, especially in rural India, is still too high to be sustainable. A demographer assumes the following probability distribution of the household size in India. Household Size Probability 1 0.04 2 0.12 3 0.18 4 0.24
- 31. 5 0.13 6 0.15 7 0.10 8 0.04 a. What is the probability that there are less than 5 members in a typical household in India? (Round your answer to 2 decimal places.) Probability b. What is the probability that there are 5 or more members in a typical household in India? (Round your answer to 2 decimal places.) Probability c. What is the probability that the number of members in a typical household in India is greater than 4 and less than 7 members? (Round your answer to 2 decimal places.) Probability rev: 02_26_2014_QC_45094 28. The State Police are trying to crack down on speeding on a
- 32. particular portion of the Massachusetts Turnpike. To aid in this pursuit, they have purchased a new radar gun that promises greater consistency and reliability. Specifically, the gun advertises ± one-mile-per-hour accuracy 70% of the time; that is, there is a 0.70 probability that the gun will detect a speeder, if the driver is actually speeding. Assume there is a 2% chance that the gun erroneously detects a speeder even when the driver is below the speed limit. Suppose that 67% of the drivers drive below the speed limit on this stretch of the Massachusetts Turnpike. a. What is the probability that the gun detects speeding and the driver was speeding? (Round your answer to 4 decimal places.) Probability b. What is the probability that the gun detects speeding and the driver was not speeding? (Round your answer to 4 decimal places.) Probability c. Suppose the police stop a driver because the gun detects speeding. What is the probability that the driver was actually driving below the speed limit? (Round your answer to 4 decimal places.) Probability rev: 08_06_2013_QC_32707
- 33. 29. At a local bar in a small Midwestern town, beer and wine are the only two alcoholic options. The manager noted that of all male customers who visited over the weekend, 153 ordered beer, 46 ordered wine, and 17 asked for soft drinks. Of female customers, 37 ordered beer, 23 ordered wine, and 10 asked for soft drinks. a. Construct a contingency table that shows frequencies for the qualitative variables Gender (male or female) and Drink Choice (beer, wine, or soft drink). Drink Choice Gender Beer (B) Wine (W) Soft Drinks (D) Totals Male (M) Female (F) Total b. Find the probability that a customer orders wine. (Round your intermediate calculations and final answer to 4 decimal places.) P(W) c. What is the probability that a male customer orders wine?
- 34. (Round your intermediate calculations and final answer to 4 decimal places.) P (W | M ) d. Are the events “Wine” and “Male” independent? Yes because P(“Wine” | “Male”) = P(“Wine”). Yes because P(“Wine” ∩ “Male”) = P(“Wine”). No because P(“Wine” | “Male”) ≠ P(“Wine”). No because P(“Wine” ∩ “Male”) ≠ P(“Wine”). rev: 08_06_2013_QC_32707 30. Consider the following frequency distribution. Class Frequency 2 up to 4 21 4 up to 6 59 6 up to 8 81 8 up to 10 21 a. Calculate the population mean. (Round your answer to 2 decimal places.) Population mean b. Calculate the population variance and the population standard
- 35. deviation. (Round your intermediate calculations to 4 decimal places and final answers to 2 decimal places.) Population variance Population standard deviation rev: 07_31_2013_QC_32713 31. Which of the following variables is not continuous? Time of a flight between Atlanta and Chicago Height of NBA players The number of obtained heads when a fair coin is tossed 20 times Average temperature in the month of July in Orlando 32. The one-year return (in %) for 24 mutual funds is as follows: –10.7 –1.4 0.9 6.1 –15.9 –7.5 21.5 –9.6 4.5 11.1 14.5 4.7 –8.4 –8.4 19.5 14.9 29.3 7.7 22.0 24.8 –0.4 11.1 5.0 –11.0 PictureClick here for the Excel Data File a. Construct a frequency distribution using classes of –20 up to – 10, –10 up to 0, etc.
- 36. Class (in %) Frequency –20 up to –10 –10 up to 0 0 up to 10 10 up to 20 20 up to 30 Total b. Construct the relative frequency, the cumulative frequency, and the cumulative relative frequency distributions. (Round "relative frequency" and "cumulative relative frequency" answers to 3 decimal places.) Class (in %) Relative Frequency Cumulative Frequency Cumulative Relative Frequency –20 up to –10 –10 up to 0 0 up to 10 10 up to 20 20 up to 30 Total c-1. How many of the funds had returns of at least 20% but less than 30%? Number of funds c-2. How many of the funds had returns of 0% or more?
- 37. Number of funds d-1. What percent of the funds had returns of at least –10% but less than 0%? (Round your answer to 1 decimal place.) Percent of funds d-2. What percent of the funds had returns less than 20%? (Round your answer to 1 decimal place.) Percent of funds rev: 06_24_2013_QC_31991, 07_05_2013_QC_32367 ©2015 McGraw-Hill Education. All rights reserved. 33. Investment advisors recommend risk reduction through international diversification. International investing allows you to take advantage of the potential for growth in foreign economies, particularly in emerging markets. Janice Wong is considering investment in either Europe or Asia. She has studied these markets and believes that both markets will be influenced by the U.S. economy, which has a 16% chance for being good, a 57% chance for being fair, and a 27% chance for being poor. Probability distributions of the returns for these markets are given in the accompanying table.
- 38. State of the U.S. Economy Returns in Europe Returns in Asia Good 14% 28% Fair 5% 7% Poor −12% −10% a. Find the expected value and the standard deviation of returns in Europe and Asia. (Round your intermediate calculations to 4 decimal places and final answers to 2 decimal places.) Europe Asia Expected value % % Standard deviation b. What will Janice pick as an investment if she is risk neutral? Investment in Europe Investment in Asia rev: 08_07_2013_QC_33420 34. Consider the following probabilities: P(Ac) = 0.32, P(B) = 0.58, and P(A ∩ Bc) = 0.25. a. Find P(A | Bc). (Do not round intermediate calculations. Round your answer to 2 decimal places.) P(A | Bc)
- 39. b. Find P(Bc | A). (Do not round intermediate calculations. Round your answer to 3 decimal places.) P(Bc | A) c. Are A and B independent events? Yes because P(A | Bc) = P(A). Yes because P(A ∩ Bc) ≠ 0. No because P(A | Bc) ≠ P(A). No because P(A ∩ Bc) ≠ 0. rev: 08_06_2013_QC_32707 35. The probabilities that stock A will rise in price is 0.64 and that stock B will rise in price is 0.36. Further, if stock B rises in price, the probability that stock A will also rise in price is 0.56. a. What is the probability that at least one of the stocks will rise in price? (Round your answer to 2 decimal places.) Probability b. Are events A and B mutually exclusive? Yes because P(A | B) = P(A). Yes because P(A ∩ B) = 0. No because P(A | B) ≠ P(A).
- 40. No because P(A ∩ B) ≠ 0. c. Are events A and B independent? Yes because P(A | B) = P(A). Yes because P(A ∩ B) = 0. No because P(A | B) ≠ P(A). No because P(A ∩ B) ≠ 0. rev: 08_06_2013_QC_32707 36. A sample of patients arriving at Overbrook Hospital’s emergency room recorded the following body temperature readings over the weekend: 102.6 99.8 100.7 100.9 100.5 102.4 101.3 99.2 100.5 100.9 99.8 100.3 99.8 100.5 100.9 100.7 100.3 100.2 99.6 99.7 PictureClick here for the Excel Data File a. Construct a stem-and-leaf diagram. Stem Leaf b. Interpret the stem-and-leaf diagram.
- 41. The distribution is Positively Skewed. The distribution is Negatively Skewed. The distribution is symmetric. 37. A professor has learned that nine students in her class of 24 will cheat on the exam. She decides to focus her attention on eleven randomly chosen students during the exam. a. What is the probability that she finds at least one of the students cheating? (Round your intermediate calculations and final answers to 4 decimal places.) Probability b. What is the probability that she finds at least one of the students cheating if she focuses on twelve randomly chosen students? (Round your intermediate calculations and final answers to 4 decimal places.) Probability rev: 08_07_2013_QC_33420 38. At the end of a semester, college students evaluate their
- 42. instructors by assigning them to one of the following categories: Excellent, Good, Average, Below Average, and Poor. The measurement scale is a(n) ____________. nominal scale ratio scale ordinal scale interval scale 39. Consider the following contingency table. B Bc A 23 21 Ac 30 26 a. Convert the contingency table into a joint probability table. (Round your intermediate calculations and final answers to 4 decimal places.) B
- 44. b. What is the probability that A occurs? (Round your intermediate calculations and final answer to 4 decimal places.) Probability c. What is the probability that A and B occur? (Round your intermediate calculations and final answer to 4 decimal places.) Probability d. Given that B has occurred, what is the probability that A occurs? (Round your intermediate calculations and final answer to 4 decimal places.) Probability e.
- 45. Given that Ac has occurred, what is the probability that B occurs? (Round your intermediate calculations and final answer to 4 decimal places.) Probability f. Are A and B mutually exclusive events? Yes because P(A | B) ≠ P(A). Yes because P(A ∩ B) ≠ 0. No because P(A | B) ≠ P(A). No because P(A ∩ B) ≠ 0. g. Are A and B independent events? Yes because P(A | B) ≠ P(A). Yes because P(A ∩ B) ≠ 0. No because P(A | B) ≠ P(A). No because P(A ∩ B) ≠ 0. rev: 08_06_2013_QC_32707, 11_10_2013_QC_38348 40. Consider the following returns for two investments, A and B, over the past four years:
- 46. Investment 1: 9% 10% –7% 15% Investment 2: 7% 9% –16% 14% a-1. Calculate the mean for each investment. (Round your answers to 2 decimal places.) Mean Investment 1 percent Investment 2 percent a-2. Which investment provides the higher return? Investment 2 Investment 1 b-1. Calculate the standard deviation for each investment. (Round your answers to 2 decimal places.)
- 47. Standard Deviation Investment 1 Investment 2 b-2. Which investment provides less risk? Investment 1 Investment 2 c-1. Given a risk-free rate of 1.2%, calculate the Sharpe ratio for each investment. (Do not round intermediate calculations. Round your answers to 2 decimal places.) Sharpe Ratio Investment 1 Investment 2 c-2. Which investment has performed better?
- 48. Investment 2 Investment 1 rev: 07_31_2013_QC_32713, 11_10_2013_QC_38348 41. Which of the following represents a population and a sample from that population? Freshmen at St. Joseph's University and basketball players at St. Joseph's University Teachers in a high school and members of the parent teacher group Residents of Albany, New York, and registered voters in Albany, New York Fans at a concert who purchase t-shirts and fans at a concert who purchase soda 42. (Use computer) Assume that X is a hypergeometric random variable with N = 54, S = 21, and n = 8. Calculate the following probabilities. (Round your answers to 4 decimal places.) a. P(X = 6) b. P(X ≥ 2) c. P(X ≤ 7) 43.
- 49. Which scales of data measurement are associated with quantitative data? Interval and ratio Nominal and ordinal Ratio and nominal Ordinal and interval 44. Which of the following is a quantitative variable? All of the Answers House size House price House age 45. (Use computer) A committee of 39 members consists of 21 men and 18 women. A subcommittee consisting of 13 randomly selected members will be formed. a. What are the expected number of men and women in the subcommittee? Expected Number Men Women
- 50. b. What is the probability that at least four of the members in the subcommittee will be women? (Round your answer to 4 decimal places.) Probability 46. The following relative frequency distribution was constructed from a population of 450. Calculate the population mean, the population variance, and the population standard deviation. (Round your intermediate calculations to 4 decimal places and final answers to 2 decimal places.) Class Relative Frequency −20 up to −10 0.10 −10 up to 0 0.22 0 up to 10 0.36 10 up to 20 0.32 Population mean Population variance Population standard deviation rev: 07_31_2013_QC_32713 47. A recent survey of 200 small firms (annual revenue less than
- 51. $10 million) asked whether an increase in the minimum wage would cause the firm to decrease capital spending. Possible responses to the survey question were: "Yes," "No," or "Don't Know." These data are best classified as ____________. ratio scale nominal scale interval scale ordinal scale 48. A manager of a local retail store analyzes the relationship between advertising and sales by reviewing the store’s data for the previous six months. Advertising (in $100s) Sales (in $1,000s) 274 198 67 55 66 54 65 53 276 200 236 200 PictureClick here for the Excel Data File a. Calculate the mean of advertising and the mean of sales. (Round your answers to 2 decimal places.) Mean Advertising Sales
- 52. b. Calculate the standard deviation of advertising and the standard deviation of sales. (Round your answers to 2 decimal places.) Standard Deviation Advertising Sales c-1. Calculate the covariance between advertising and sales. (Round your answer to 2 decimal places.) Covariance c-2. Interpret the covariance between advertising and sales. No correlation Positive correlation Negative correlation d-1. Calculate the correlation coefficient between advertising and sales. (Round your answer to 2 decimal places.) Correlation coefficient d-2. Interpret the correlation coefficient between advertising and sales.
- 53. Weak positive correlation Strong negative correlation Strong positive correlation No correlation Weak negative correlation rev: 07_31_2013_QC_32713 ©2015 McGraw-Hill Education. All rights reserved. 49. (Use computer) Assume that X is a Poisson random variable with μ = 24. Calculate the following probabilities. (Round your intermediate calculations and final answers to 4 decimal places.) a. P(X ≤ 19) b. P(X = 21) c. P(X > 26) d. P(21 ≤ X ≤ 31) rev: 08_07_2013_QC_33420 50. Let P(A) = 0.54, P(B) = 0.25, and P(A ∩ B) = 0.22. a. Are A and B independent events? Yes because P(A | B) = P(A). Yes because P(A ∩ B) ≠ 0.
- 54. No because P(A | B) ≠ P(A). No because P(A ∩ B) ≠ 0. b. Are A and B mutually exclusive events? Yes because P(A | B) = P(A). Yes because P(A ∩ B) ≠ 0. No because P(A | B) ≠ P(A). No because P(A ∩ B) ≠ 0. c. What is the probability that neither A nor B takes place? (Round your answer to 2 decimal places.) Probability rev: 08_06_2013_QC_32707 · You will choose to create a PowerPoint, Word Document (poster) about a geohazard or an erosional process. · A geohazard is geological state that has the potential to damage a landscape. Some examples are: tsunamis, landslides and earthquakes. · An erosional process is the movement of sediments on the landscape that can be caused by wind or water. Examples include: flooding, loss of topsoil for farming, and desertification. · You may also choose to create your presentation in PowerPoint or use Word to insert pictures and information. Include pictures and cite all sources (at end of presentation). What do you need to do? First, decide if you want to study an erosional landform or a geohazard. Then, identify which specific topic within that category you want to learn more about. After you have made these decisions, answer the questions below about your choice. How will it be graded? Creative work must also include
- 55. accurate content. Make sure all the questions below are addressed in your advertisement, as the majority of your grade is based on content. However, a portion of the grade will be your creativity. So let loose and enjoy this assessment! Erosional Process/Landform INFO: 1. Name of landform 2. Identify the erosional process that makes this landform 3. Identify 4. Describe the steps of the process that forms this landform 5. Identify 2 examples of these types of landforms – provide pictures and location! 6. Identify any potential problems that might arise for human settlements in the vicinity Include pictures and of course cite your sources! GeohazardsINFO: 1. Name of geohazard 2. Describe this geohazard- explain what happens! 3. Describe how this is a hazard to humans and why it should be a concern to us 4. What regions are most vulnerable to these events? 5. How is the destructive nature of your geohazard measured? 6. Identify 2 examples of when this geohazard occurred- give dates, location and briefly describe. 7. Identify 3 ways that humans can protect/prepare themselves for this sort of event. Include pictures and of course cite your sources!