SlideShare a Scribd company logo
1 of 1
Download to read offline
Alaska Airlines Flight Delay Dashboard
67.4
72.4
59.5
79.4
66.9
69.4
193.6
121.5 131.9
104.1 104.4 101.4
0
50
100
150
200
250
0
10
20
30
40
50
60
70
80
90
Anchorage, AK Las Vegas, NV Los Angeles, CA San Francisco, CA San Jose, CA Oakland, CA
Average Total Delay Time Versus Average Flight Time by Minutes
Top 6 Destination Cities by Number of Flights
Jan '05 - Aug '05 Avg Total Delay Time
Avg Total Flight Time
58.8 58.1
68.6 67.0
77.3
90.2
57.7 59.1
149.0
138.2
133.5
127.8
133.1
137.2
141.9 142.0
115
120
125
130
135
140
145
150
155
0
10
20
30
40
50
60
70
80
90
100
Jan Feb Mar Apr May Jun Jul Aug
Average Total Delay Time Versus Average Flight Time by Minutes
Top 6 Destination Cities by Number of Flights
Jan '05 - Aug '05 Avg Total Delay Time
Avg Total Flight Time
59.4 59.4 68.8
67.0 75.9
86.3
59.3 57.2
53.1 54.1
158.8
139.1
133.9 136.3
144.9
152.3
145.6 148.6
125.5
146.6
0
20
40
60
80
100
120
140
160
180
0
10
20
30
40
50
60
70
80
90
100
Jan Feb Mar Apr May Jun Jul Aug Sep Oct
Average Total Delay Time Versus Average Flight Time by Minutes
All 18 Destination Cities
Jan '05 - Oct '05
Avg Total Delay Time
Avg Total Flight Time
10.0% 10.1% 11.1% 7.3% 14.8% 16.0% 12.8% 13.4% 1.4% 3.3%
% of Total Flights by Month: Jan 05 - Oct 05
136.7 Overall Average Flight Time
68.5 Overall Average Delay Time
77.8
64.5
60.2 61.6
74.9 77.0
62.5
136.7
139.8 140.1
139.4
134.8
135.7
140.0
132
133
134
135
136
137
138
139
140
141
0
10
20
30
40
50
60
70
80
90
Sun Mon Tue Wed Thu Fri Sat
Average Total Delay Time Versus Average Flight Time by Minutes
Top 6 Destination Cities by Number of Flights
Jan '05 - Aug '05 Avg Total Delay Time
Avg Total Flight Time
136.7 Overall Average Flight Time
68.5 Overall Average Delay Time
13.4%15.0% 15.2% 14.3% 13.5% 14.2% 14.5%
% of Total Flights by Day of the Week: Jan 05 - Aug 05
Anchorage, AK
Las Vegas, NV
Los Angeles, CA
San Francisco, CA
San Jose, CA
Oakland, CA
32.4
34.6
28.0
39.8
32.6
33.7
34.9
37.8
31.5
39.6
34.3
35.6
Avg Departure Delay Time Avg Arrival Delay Time
Average Departure Delay Time Versus Average Arrival Delay Time by Minutes
Top 6 Destination Cities by Number of Flights
Jan '05 - Aug '05
0
500
1,000
1,500
2,000
2,500
2,362
1,3171,2551,188
1,064 983
633 584 571 565
441 427 352 268 262
156 149 149
Total Number of Flights by Destination City
Jan '05 - Oct '05
Top 6 (1/3rd) Destination Cities
Represent 64.2% of All Flights
Average # of Flights 707
% of Total Flights by Month: Jan 05 - Aug 05
14.1%10.5% 10.6% 11.6% 7.6% 15.5% 16.7% 13.4%
Graph #1 Graph #2
Graph #3 Graph #4
Graph #6Graph #5
Prepared by: Andrew Dinger, Trae Gordon, Josh King

More Related Content

Featured

Social Media Marketing Trends 2024 // The Global Indie Insights
Social Media Marketing Trends 2024 // The Global Indie InsightsSocial Media Marketing Trends 2024 // The Global Indie Insights
Social Media Marketing Trends 2024 // The Global Indie Insights
Kurio // The Social Media Age(ncy)
 

Featured (20)

Skeleton Culture Code
Skeleton Culture CodeSkeleton Culture Code
Skeleton Culture Code
 
PEPSICO Presentation to CAGNY Conference Feb 2024
PEPSICO Presentation to CAGNY Conference Feb 2024PEPSICO Presentation to CAGNY Conference Feb 2024
PEPSICO Presentation to CAGNY Conference Feb 2024
 
Content Methodology: A Best Practices Report (Webinar)
Content Methodology: A Best Practices Report (Webinar)Content Methodology: A Best Practices Report (Webinar)
Content Methodology: A Best Practices Report (Webinar)
 
How to Prepare For a Successful Job Search for 2024
How to Prepare For a Successful Job Search for 2024How to Prepare For a Successful Job Search for 2024
How to Prepare For a Successful Job Search for 2024
 
Social Media Marketing Trends 2024 // The Global Indie Insights
Social Media Marketing Trends 2024 // The Global Indie InsightsSocial Media Marketing Trends 2024 // The Global Indie Insights
Social Media Marketing Trends 2024 // The Global Indie Insights
 
Trends In Paid Search: Navigating The Digital Landscape In 2024
Trends In Paid Search: Navigating The Digital Landscape In 2024Trends In Paid Search: Navigating The Digital Landscape In 2024
Trends In Paid Search: Navigating The Digital Landscape In 2024
 
5 Public speaking tips from TED - Visualized summary
5 Public speaking tips from TED - Visualized summary5 Public speaking tips from TED - Visualized summary
5 Public speaking tips from TED - Visualized summary
 
ChatGPT and the Future of Work - Clark Boyd
ChatGPT and the Future of Work - Clark Boyd ChatGPT and the Future of Work - Clark Boyd
ChatGPT and the Future of Work - Clark Boyd
 
Getting into the tech field. what next
Getting into the tech field. what next Getting into the tech field. what next
Getting into the tech field. what next
 
Google's Just Not That Into You: Understanding Core Updates & Search Intent
Google's Just Not That Into You: Understanding Core Updates & Search IntentGoogle's Just Not That Into You: Understanding Core Updates & Search Intent
Google's Just Not That Into You: Understanding Core Updates & Search Intent
 
How to have difficult conversations
How to have difficult conversations How to have difficult conversations
How to have difficult conversations
 
Introduction to Data Science
Introduction to Data ScienceIntroduction to Data Science
Introduction to Data Science
 
Time Management & Productivity - Best Practices
Time Management & Productivity -  Best PracticesTime Management & Productivity -  Best Practices
Time Management & Productivity - Best Practices
 
The six step guide to practical project management
The six step guide to practical project managementThe six step guide to practical project management
The six step guide to practical project management
 
Beginners Guide to TikTok for Search - Rachel Pearson - We are Tilt __ Bright...
Beginners Guide to TikTok for Search - Rachel Pearson - We are Tilt __ Bright...Beginners Guide to TikTok for Search - Rachel Pearson - We are Tilt __ Bright...
Beginners Guide to TikTok for Search - Rachel Pearson - We are Tilt __ Bright...
 
Unlocking the Power of ChatGPT and AI in Testing - A Real-World Look, present...
Unlocking the Power of ChatGPT and AI in Testing - A Real-World Look, present...Unlocking the Power of ChatGPT and AI in Testing - A Real-World Look, present...
Unlocking the Power of ChatGPT and AI in Testing - A Real-World Look, present...
 
12 Ways to Increase Your Influence at Work
12 Ways to Increase Your Influence at Work12 Ways to Increase Your Influence at Work
12 Ways to Increase Your Influence at Work
 
ChatGPT webinar slides
ChatGPT webinar slidesChatGPT webinar slides
ChatGPT webinar slides
 
More than Just Lines on a Map: Best Practices for U.S Bike Routes
More than Just Lines on a Map: Best Practices for U.S Bike RoutesMore than Just Lines on a Map: Best Practices for U.S Bike Routes
More than Just Lines on a Map: Best Practices for U.S Bike Routes
 
Ride the Storm: Navigating Through Unstable Periods / Katerina Rudko (Belka G...
Ride the Storm: Navigating Through Unstable Periods / Katerina Rudko (Belka G...Ride the Storm: Navigating Through Unstable Periods / Katerina Rudko (Belka G...
Ride the Storm: Navigating Through Unstable Periods / Katerina Rudko (Belka G...
 

AlaskaAirlinesFlightDelayTimeDashboardFinal (1)

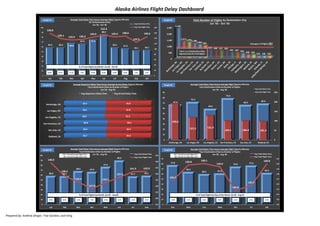
  • 1. Alaska Airlines Flight Delay Dashboard 67.4 72.4 59.5 79.4 66.9 69.4 193.6 121.5 131.9 104.1 104.4 101.4 0 50 100 150 200 250 0 10 20 30 40 50 60 70 80 90 Anchorage, AK Las Vegas, NV Los Angeles, CA San Francisco, CA San Jose, CA Oakland, CA Average Total Delay Time Versus Average Flight Time by Minutes Top 6 Destination Cities by Number of Flights Jan '05 - Aug '05 Avg Total Delay Time Avg Total Flight Time 58.8 58.1 68.6 67.0 77.3 90.2 57.7 59.1 149.0 138.2 133.5 127.8 133.1 137.2 141.9 142.0 115 120 125 130 135 140 145 150 155 0 10 20 30 40 50 60 70 80 90 100 Jan Feb Mar Apr May Jun Jul Aug Average Total Delay Time Versus Average Flight Time by Minutes Top 6 Destination Cities by Number of Flights Jan '05 - Aug '05 Avg Total Delay Time Avg Total Flight Time 59.4 59.4 68.8 67.0 75.9 86.3 59.3 57.2 53.1 54.1 158.8 139.1 133.9 136.3 144.9 152.3 145.6 148.6 125.5 146.6 0 20 40 60 80 100 120 140 160 180 0 10 20 30 40 50 60 70 80 90 100 Jan Feb Mar Apr May Jun Jul Aug Sep Oct Average Total Delay Time Versus Average Flight Time by Minutes All 18 Destination Cities Jan '05 - Oct '05 Avg Total Delay Time Avg Total Flight Time 10.0% 10.1% 11.1% 7.3% 14.8% 16.0% 12.8% 13.4% 1.4% 3.3% % of Total Flights by Month: Jan 05 - Oct 05 136.7 Overall Average Flight Time 68.5 Overall Average Delay Time 77.8 64.5 60.2 61.6 74.9 77.0 62.5 136.7 139.8 140.1 139.4 134.8 135.7 140.0 132 133 134 135 136 137 138 139 140 141 0 10 20 30 40 50 60 70 80 90 Sun Mon Tue Wed Thu Fri Sat Average Total Delay Time Versus Average Flight Time by Minutes Top 6 Destination Cities by Number of Flights Jan '05 - Aug '05 Avg Total Delay Time Avg Total Flight Time 136.7 Overall Average Flight Time 68.5 Overall Average Delay Time 13.4%15.0% 15.2% 14.3% 13.5% 14.2% 14.5% % of Total Flights by Day of the Week: Jan 05 - Aug 05 Anchorage, AK Las Vegas, NV Los Angeles, CA San Francisco, CA San Jose, CA Oakland, CA 32.4 34.6 28.0 39.8 32.6 33.7 34.9 37.8 31.5 39.6 34.3 35.6 Avg Departure Delay Time Avg Arrival Delay Time Average Departure Delay Time Versus Average Arrival Delay Time by Minutes Top 6 Destination Cities by Number of Flights Jan '05 - Aug '05 0 500 1,000 1,500 2,000 2,500 2,362 1,3171,2551,188 1,064 983 633 584 571 565 441 427 352 268 262 156 149 149 Total Number of Flights by Destination City Jan '05 - Oct '05 Top 6 (1/3rd) Destination Cities Represent 64.2% of All Flights Average # of Flights 707 % of Total Flights by Month: Jan 05 - Aug 05 14.1%10.5% 10.6% 11.6% 7.6% 15.5% 16.7% 13.4% Graph #1 Graph #2 Graph #3 Graph #4 Graph #6Graph #5 Prepared by: Andrew Dinger, Trae Gordon, Josh King