1. August 18, 2010
Small Cap | America | USA
Initiating Coverage
Clenergen Corporation
High Risk
Interesting Business Model at Early Stage
Industry: Renewables
Country: US
WKN: A1CTSK ∎ Clenergen has developed technology and feedstock for biomass cultivation for several
Reuters: CRGE.OB years. Now the company intends to convert these assets into money. Being at an early
Website: www.clenergen.com stage of its business life cycle, Clenergen could be an interesting investment for
investors with a certain risk appetite.
Curr. Price: 0.43
High Low ∎ Clenergen owns IP rights for fast growing trees and bamboo which grow on almost
Price 52 W.: 1.40 0.40 every soil. The feedstock can therefore be cultivated in proximity to biomass power
Market Cap. ($m) 41.33 plants. In addition, the trees and bamboo have a high density which makes them a well
No. of Shares (m) 96.12 suited feedstock for biomass. The company intends to either sell the biomass to clients
for use in their power plants or operate own biomass power plants as well as power
Shareholders plants operated under joint ventures (with e.g. mining companies).
Subscribers in Germany 1.23%
∎ The management of Clenergen is well experienced and is supported by local
Freefloat 16.13%
specialists in the different regions. Clenergen focuses on regions lacking energy
Directors and
82.65% supply and regions using expensive and polluting technologies. Current projects are
Consultants
located in India, the Philippines, Ghana, and Guyana.
Performance
∎ We assess Clenergen as an investment with a high risk due to the early stage of the
4 Weeks -28.33%
projects and the different regions the company is active in. Using newly developed
13 Weeks -50.00%
plants, no long-term observations are available regarding growth rate and possible
26 Weeks -36.76%
problems of the plants.
52 Weeks -52.22%
Curr. Year -51.14% ∎ In our valuation we derive a target price of $1.33 per share provided that the company
Dividend is able to receive its ambitious aims. In order to take into account the given
in $ in % uncertainties we used discounts to the company’s forecast in our DCF-Model.
2010E 0.00 -
2011E 0.00 -
2012E 0.00 -
2013E 0.00 -
$m 2010E 2011E 2012E 2013E 2014E
Revenues 1.89 8.42 17.60 33.67 77.81
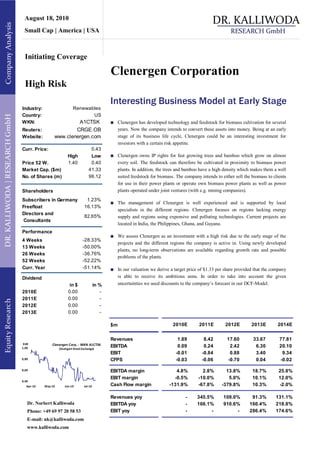
EUR Clenergen Corp. - WKN A1CTSK
1,00 (Stuttgart Stock Exchange)
EBITDA 0.09 0.24 2.42 6.30 20.10
EBIT -0.01 -0.84 0.88 3.40 9.34
0,80 CFPS -0.03 -0.06 -0.70 0.04 -0.02
0,60 EBITDA margin 4.8% 2.8% 13.8% 18.7% 25.8%
EBIT margin -0.5% -10.0% 5.0% 10.1% 12.0%
0,40
Apr-10 May-10 Jun-10 Jul-10 Cash Flow margin -131.9% -67.8% -379.8% 10.3% -2.0%
Revenues yoy - 345.5% 109.0% 91.3% 131.1%
Dr. Norbert Kalliwoda EBITDA yoy - 166.1% 910.6% 160.4% 218.8%
Phone: +49 69 97 20 58 53 EBIT yoy - - - 286.4% 174.6%
E-mail: nk@kalliwoda.com
www.kalliwoda.com