August 2017 Greater Boston Real Estate Market Trends
•
0 likes•214 views

Greater Boston Association of Realtors® Monthly Indicators Report.

Recommended
Recommended
More Related Content
What's hot
What's hot (18)
Similar to August 2017 Greater Boston Real Estate Market Trends
Similar to August 2017 Greater Boston Real Estate Market Trends (18)
Recently uploaded
Recently uploaded (20)
August 2017 Greater Boston Real Estate Market Trends
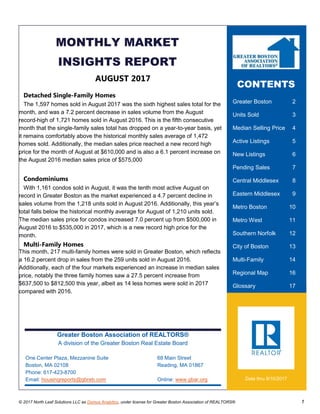
- 1. © 2017 North Leaf Solutions LLC as Domus Analytics, under license for Greater Boston Association of REALTORS® 1 MONTHLY MARKET INSIGHTS REPORT AUGUST 2017 Detached Single-Family Homes The 1,597 homes sold in August 2017 was the sixth highest sales total for the month, and was a 7.2 percent decrease in sales volume from the August record-high of 1,721 homes sold in August 2016. This is the fifth consecutive month that the single-family sales total has dropped on a year-to-year basis, yet it remains comfortably above the historical monthly sales average of 1,472 homes sold. Additionally, the median sales price reached a new record high price for the month of August at $610,000 and is also a 6.1 percent increase on the August 2016 median sales price of $575,000 Condominiums With 1,161 condos sold in August, it was the tenth most active August on record in Greater Boston as the market experienced a 4.7 percent decline in sales volume from the 1,218 units sold in August 2016. Additionally, this year’s total falls below the historical monthly average for August of 1,210 units sold. The median sales price for condos increased 7.0 percent up from $500,000 in August 2016 to $535,000 in 2017, which is a new record high price for the month. Multi-Family Homes This month, 217 multi-family homes were sold in Greater Boston, which reflects a 16.2 percent drop in sales from the 259 units sold in August 2016. Additionally, each of the four markets experienced an increase in median sales price, notably the three family homes saw a 27.5 percent increase from $637,500 to $812,500 this year, albeit as 14 less homes were sold in 2017 compared with 2016. CONTENTS Greater Boston 2 Units Sold 3 Median Selling Price 4 Active Listings 5 New Listings 6 Pending Sales 7 Central Middlesex 8 Eastern Middlesex 9 Metro Boston 10 Metro West 11 Southern Norfolk 12 City of Boston 13 Multi-Family 14 Regional Map 16 Glossary 17 Data thru 9/10/2017 Greater Boston Association of REALTORS® A division of the Greater Boston Real Estate Board One Center Plaza, Mezzanine Suite 68 Main Street Boston, MA 02108 Reading, MA 01867 Phone: 617-423-8700 Email: housingreports@gbreb.com Online: www.gbar.org
- 2. © 2017 North Leaf Solutions LLC as Domus Analytics, under license for Greater Boston Association of REALTORS® 2 GREATER BOSTON MARKET SUMMARY Includes all 64 towns within the GBAR jurisdictional area Single Family Homes Aug 2017 Aug 2016 Change Jul 2017 Change 2017 2016 Change Median Selling Price $610,000 $575,000 6.1% $605,000 0.8% $589,900 $547,500 7.7% Units Sold 1,597 1,721 -7.2% 1,540 3.7% 9,319 9,658 -3.5% Active Listings 2,970 3,281 -9.5% 3,113 -4.6% --- --- --- Months Supply of Inventory 1.9 1.9 -2.6% 2.0 -7.9% --- --- --- New Listings 1,251 1,225 2.1% 1,335 -6.3% 12,538 13,234 -5.3% Pending Sales 1,217 1,530 -20.5% 1,266 -3.9% 9,972 10,304 -3.2% Days to Off Market 45 59 -23.7% 43 4.7% 43 56 -22.2% Sold to Original Price Ratio 99.0% 98.6% 0.4% 100.1% -1.1% 99.2% 98.5% 0.7% Price per Square Foot $315 $301 4.8% $324 -2.6% $314 $295 6.4% Year over Year Month over Month Year to Date Condominiums Aug 2017 Aug 2016 Change Jul 2017 Change 2017 2016 Change Median Selling Price $535,000 $500,000 7.0% $530,000 0.9% $525,000 $485,000 8.2% Units Sold 1,161 1,218 -4.7% 1,159 0.2% 7,406 7,574 -2.2% Active Listings 1,803 1,819 -0.9% 1,943 -7.2% --- --- --- Months Supply of Inventory 1.6 1.5 4.0% 1.7 -7.7% --- --- --- New Listings 905 963 -6.0% 1,113 -18.7% 9,696 9,791 -1.0% Pending Sales 890 1,122 -20.7% 988 -9.9% 8,010 8,144 -1.6% Days to Off Market 36 48 -25.0% 36 0.0% 35 42 -16.5% Sold to Original Price Ratio 100.7% 100.7% 0.0% 101.7% -1.0% 101.0% 100.6% 0.4% Price per Square Foot $523 $502 4.1% $525 -0.3% $521 $484 7.7% Year over Year Month over Month Year to Date $300,000 $350,000 $400,000 $450,000 $500,000 $550,000 $600,000 $650,000 0 500 1000 1500 2000 2500 Aug-16 Sep-16 Oct-16 Nov-16 Dec-16 Jan-17 Feb-17 Mar-17 Apr-17 May-17 Jun-17 Jul-17 Aug-17 Condo Units Sold Single Family Units Sold Condo Sold Price Single Family Sold Price
- 3. © 2017 North Leaf Solutions LLC as Domus Analytics, under license for Greater Boston Association of REALTORS® 3 Aug 2017 Aug 2016 Change Jul 2017 Change 2017 2016 Change Year over Year Month over Month Year to Date SINGLE FAMILY HOMES 1,597 1,721 -7.2% 1,540 3.7% 9,319 9,658 -3.5% CONDOMINIUMS 1,161 1,218 -4.7% 1,159 0.2% 7,406 7,574 -2.2% 1218 1008 827 849 925 625 463 819 735 1074 1370 1159 1161 1721 1158 963 1188 1137 840 508 835 845 1221 1933 1540 1597 0 500 1000 1500 2000 2500 Aug-16 Sep-16 Oct-16 Nov-16 Dec-16 Jan-17 Feb-17 Mar-17 Apr-17 May-17 Jun-17 Jul-17 Aug-17 Condominium Single Family Home 0 500 1000 1500 2000 2500 Aug-13 Nov-13 Feb-14 May-14 Aug-14 Nov-14 Feb-15 May-15 Aug-15 Nov-15 Feb-16 May-16 Aug-16 Nov-16 Feb-17 May-17 Aug-17 Condominium Single Family Home UNITS SOLD
- 4. © 2017 North Leaf Solutions LLC as Domus Analytics, under license for Greater Boston Association of REALTORS® 4 Aug 2017 Aug 2016 Change Jul 2017 Change 2017 2016 Change Year over Year Month over Month Year to Date SINGLE FAMILY HOMES $610,000 $575,000 6.1% $605,000 0.8% $589,900 $547,500 7.7% CONDOMINIUMS $535,000 $500,000 7.0% $530,000 0.9% $525,000 $485,000 8.2% $500,000 $509,690 $480,000 $500,000 $468,000 $505,000 $520,000 $517,500 $524,000 $525,381 $525,000 $530,000 $535,000 $575,000 $505,000 $525,000 $525,000 $545,000 $520,000 $505,000 $558,000 $595,000 $600,000 $613,000 $605,000 $610,000 $0 $100,000 $200,000 $300,000 $400,000 $500,000 $600,000 $700,000 Aug-16 Sep-16 Oct-16 Nov-16 Dec-16 Jan-17 Feb-17 Mar-17 Apr-17 May-17 Jun-17 Jul-17 Aug-17 Condominium Single Family Home $250,000 $300,000 $350,000 $400,000 $450,000 $500,000 $550,000 $600,000 $650,000 Aug-13 Nov-13 Feb-14 May-14 Aug-14 Nov-14 Feb-15 May-15 Aug-15 Nov-15 Feb-16 May-16 Aug-16 Nov-16 Feb-17 May-17 Aug-17 Condominium Single Family Home MEDIAN SELLING PRICE
- 5. © 2017 North Leaf Solutions LLC as Domus Analytics, under license for Greater Boston Association of REALTORS® 5 Aug 2017 Aug 2016 Change Jul 2017 Change Year over Year Month over Month SINGLE FAMILY HOMES Active Listings 2,970 3,281 -9.5% 3,113 -4.6% Months Supply of Inventory 1.9 1.9 -2.6% 2.0 -7.9% CONDOMINIUMS Active Listings 1,803 1,819 -0.9% 1,943 -7.2% Months Supply of Inventory 1.6 1.5 4.0% 1.7 -7.7% - 500 1,000 1,500 2,000 2,500 3,000 3,500 4,000 4,500 5,000 Aug-13 Nov-13 Feb-14 May-14 Aug-14 Nov-14 Feb-15 May-15 Aug-15 Nov-15 Feb-16 May-16 Aug-16 Nov-16 Feb-17 May-17 Aug-17 Active Listings Condominium Single Family Home 0.0 1.0 2.0 3.0 4.0 5.0 6.0 7.0 Aug-13 Nov-13 Feb-14 May-14 Aug-14 Nov-14 Feb-15 May-15 Aug-15 Nov-15 Feb-16 May-16 Aug-16 Nov-16 Feb-17 May-17 Aug-17 Months Supply of Inventory Condominium Single Family Home ACTIVE LISTINGS
- 6. © 2017 North Leaf Solutions LLC as Domus Analytics, under license for Greater Boston Association of REALTORS® 6 Aug 2017 Aug 2016 Change Jul 2017 Change 2017 2016 Change Year over Year Month over Month Year to Date SINGLE FAMILY HOMES 1,251 1,225 2.1% 1,335 -6.3% 12,538 13,234 -5.3% CONDOMINIUMS 905 963 -6.0% 1,113 -18.7% 9,696 9,791 -1.0% 963 1,503 1,104 757 441 832 865 1,440 1,407 1,621 1,513 1,113 905 1,225 1,915 1,301 850 398 907 1,058 1,885 1,971 2,285 1,846 1,335 1,251 - 500 1,000 1,500 2,000 2,500 Aug-16 Sep-16 Oct-16 Nov-16 Dec-16 Jan-17 Feb-17 Mar-17 Apr-17 May-17 Jun-17 Jul-17 Aug-17 Condominium Single Family Home - 500 1,000 1,500 2,000 2,500 3,000 Aug-13 Nov-13 Feb-14 May-14 Aug-14 Nov-14 Feb-15 May-15 Aug-15 Nov-15 Feb-16 May-16 Aug-16 Nov-16 Feb-17 May-17 Aug-17 Condominium Single Family Home NEW LISTINGS
- 7. © 2017 North Leaf Solutions LLC as Domus Analytics, under license for Greater Boston Association of REALTORS® 7 Aug 2017 Aug 2016 Change Jul 2017 Change 2017 2016 Change Year over Year Month over Month Year to Date SINGLE FAMILY HOMES 1,217 1,530 -20.5% 1,266 -3.9% 9,972 10,304 -3.2% CONDOMINIUMS 890 1,122 -20.7% 988 -9.9% 8,010 8,144 -1.6% 1,122 869 959 808 582 568 731 1,072 1,121 1,333 1,307 988 890 1,530 1,063 1,167 1,045 717 645 792 1,277 1,358 1,819 1,598 1,266 1,217 - 200 400 600 800 1,000 1,200 1,400 1,600 1,800 2,000 Aug-16 Sep-16 Oct-16 Nov-16 Dec-16 Jan-17 Feb-17 Mar-17 Apr-17 May-17 Jun-17 Jul-17 Aug-17 Condominium Single Family Home - 200 400 600 800 1,000 1,200 1,400 1,600 1,800 2,000 Aug-13 Nov-13 Feb-14 May-14 Aug-14 Nov-14 Feb-15 May-15 Aug-15 Nov-15 Feb-16 May-16 Aug-16 Nov-16 Feb-17 May-17 Aug-17 Condominium Single Family Home PENDING SALES
- 8. © 2017 North Leaf Solutions LLC as Domus Analytics, under license for Greater Boston Association of REALTORS® 8 CENTRAL MIDDLESEX REGION Acton, Bedford, Boxboro, Concord, Hudson, Lexington, Lincoln, Maynard, Stow, Sudbury, Wayland, Weston Single Family Homes Aug 2017 Aug 2016 Change Jul 2017 Change 2017 2016 Change Median Selling Price $818,000 $752,000 8.8% $740,000 10.5% $765,000 $709,000 7.9% Units Sold 272 267 1.9% 243 11.9% 1,355 1,435 -5.6% Active Listings 663 635 4.4% 664 -0.2% --- --- --- Months Supply of Inventory 2.4 2.4 2.5% 2.7 -10.6% --- --- --- New Listings 158 153 3.3% 177 -10.7% 1,961 2,062 -4.9% Pending Sales 142 224 -36.6% 198 -28.3% 1,433 1,532 -6.5% Days to Off Market 61 70 -12.9% 50 22.0% 52 68 -23.5% Sold to Original Price Ratio 97.4% 97.0% 0.4% 98.4% -1.0% 97.7% 97.0% 0.7% Price per Square Foot $312 $296 5.1% $300 3.7% $309 $293 5.5% Year over Year Month over Month Year to Date Condominiums Aug 2017 Aug 2016 Change Jul 2017 Change 2017 2016 Change Median Selling Price $405,500 $317,850 27.6% $404,000 0.4% $365,000 $367,688 -0.7% Units Sold 80 56 42.9% 74 8.1% 428 432 -0.9% Active Listings 123 149 -17.4% 113 8.8% --- --- --- Months Supply of Inventory 1.5 2.7 -42.1% 1.5 0.7% --- --- --- New Listings 72 53 35.8% 65 10.8% 547 534 2.4% Pending Sales 58 58 0.0% 59 -1.7% 459 415 10.6% Days to Off Market 49 61 -19.7% 41 19.5% 53 57 -7.0% Sold to Original Price Ratio 98.5% 98.2% 0.3% 99.1% -0.6% 98.3% 99.4% -1.1% Price per Square Foot $280 $230 22.0% $283 -0.9% $260 $253 2.6% Year over Year Month over Month Year to Date $0 $100,000 $200,000 $300,000 $400,000 $500,000 $600,000 $700,000 $800,000 $900,000 0 50 100 150 200 250 300 Aug-16 Sep-16 Oct-16 Nov-16 Dec-16 Jan-17 Feb-17 Mar-17 Apr-17 May-17 Jun-17 Jul-17 Aug-17 Condo Units Sold Single Family Units Sold Condo Sold Price Single Family Sold Price
- 9. © 2017 North Leaf Solutions LLC as Domus Analytics, under license for Greater Boston Association of REALTORS® 9 EASTERN MIDDLESEX REGION Burlington, Malden, Medford, Melrose, North Reading, Reading, Stoneham, Wakefield, Wilmington, Winchester, Woburn Single Family Homes Aug 2017 Aug 2016 Change Jul 2017 Change 2017 2016 Change Median Selling Price $569,900 $529,000 7.7% $565,000 0.9% $557,500 $495,000 12.6% Units Sold 309 311 -0.6% 274 12.8% 1,624 1,714 -5.3% Active Listings 339 429 -21.0% 381 -11.0% --- --- --- Months Supply of Inventory 1.1 1.4 -20.3% 1.4 -20.9% --- --- --- New Listings 230 254 -9.4% 245 -6.1% 2,097 2,222 -5.6% Pending Sales 245 298 -17.8% 256 -4.3% 1,784 1,814 -1.7% Days to Off Market 33 47 -29.8% 35 -5.7% 34 46 -26.1% Sold to Original Price Ratio 100.2% 101.3% -1.1% 102.2% -2.0% 101.2% 100.3% 0.9% Price per Square Foot $309 $287 7.9% $325 -4.7% $308 $284 8.5% Year over Year Month over Month Year to Date Condominiums Aug 2017 Aug 2016 Change Jul 2017 Change 2017 2016 Change Median Selling Price $415,000 $389,900 6.4% $440,000 -5.7% $393,750 $383,000 2.8% Units Sold 135 137 -1.5% 125 8.0% 764 740 3.2% Active Listings 120 167 -28.1% 124 -3.2% --- --- --- Months Supply of Inventory 0.9 1.2 -27.0% 1.0 -10.1% --- --- --- New Listings 107 106 0.9% 92 16.3% 949 942 0.7% Pending Sales 104 124 -16.1% 110 -5.5% 843 805 4.7% Days to Off Market 32 47 -31.9% 35 -8.6% 29 42 -31.0% Sold to Original Price Ratio 101.8% 100.5% 1.2% 102.4% -0.6% 101.9% 100.9% 1.0% Price per Square Foot $343 $306 12.1% $333 3.1% $331 $303 9.2% Year over Year Month over Month Year to Date $0 $100,000 $200,000 $300,000 $400,000 $500,000 $600,000 $700,000 0 50 100 150 200 250 300 350 Aug-16 Sep-16 Oct-16 Nov-16 Dec-16 Jan-17 Feb-17 Mar-17 Apr-17 May-17 Jun-17 Jul-17 Aug-17 Condo Units Sold Single Family Units Sold Condo Sold Price Single Family Sold Price
- 10. © 2017 North Leaf Solutions LLC as Domus Analytics, under license for Greater Boston Association of REALTORS® 10 METRO BOSTON REGION Arlington, Belmont, Boston, Brookline, Cambridge, Chelsea, Dedham, Everett, Milton, Newton, Revere, Somerville, Waltham, Watertown, Winthrop Single Family Homes Aug 2017 Aug 2016 Change Jul 2017 Change 2017 2016 Change Median Selling Price $690,000 $665,000 3.8% $692,500 -0.4% $660,250 $621,750 6.2% Units Sold 409 478 -14.4% 428 -4.4% 2,550 2,608 -2.2% Active Listings 692 723 -4.3% 741 -6.6% --- --- --- Months Supply of Inventory 1.7 1.5 11.9% 1.7 -2.3% --- --- --- New Listings 348 301 15.6% 382 -8.9% 3,477 3,531 -1.5% Pending Sales 338 367 -7.9% 314 7.6% 2,722 2,758 -1.3% Days to Off Market 42 52 -19.2% 36 16.7% 37 46 -19.6% Sold to Original Price Ratio 100.3% 98.9% 1.5% 101.1% -0.8% 100.2% 99.4% 0.8% Price per Square Foot $387 $376 2.9% $403 -4.0% $387 $365 6.0% Year over Year Month over Month Year to Date Condominiums Aug 2017 Aug 2016 Change Jul 2017 Change 2017 2016 Change Median Selling Price $608,000 $570,000 6.7% $600,000 1.3% $603,000 $562,500 7.2% Units Sold 803 872 -7.9% 811 -1.0% 5,187 5,328 -2.6% Active Listings 1,250 1,162 7.6% 1,399 -10.7% --- --- --- Months Supply of Inventory 1.6 1.3 17.3% 1.7 -9.8% --- --- --- New Listings 576 634 -9.1% 784 -26.5% 6,902 6,941 -0.6% Pending Sales 597 759 -21.3% 680 -12.2% 5,597 5,741 -2.5% Days to Off Market 37 44 -15.9% 36 2.8% 33 38 -13.2% Sold to Original Price Ratio 101.1% 101.1% -0.1% 102.2% -1.1% 101.4% 101.1% 0.2% Price per Square Foot $628 $599 4.9% $629 -0.2% $628 $581 8.1% Year over Year Month over Month Year to Date $0 $100,000 $200,000 $300,000 $400,000 $500,000 $600,000 $700,000 $800,000 0 200 400 600 800 1000 1200 Aug-16 Sep-16 Oct-16 Nov-16 Dec-16 Jan-17 Feb-17 Mar-17 Apr-17 May-17 Jun-17 Jul-17 Aug-17 Condo Units Sold Single Family Units Sold Condo Sold Price Single Family Sold Price
- 11. © 2017 North Leaf Solutions LLC as Domus Analytics, under license for Greater Boston Association of REALTORS® 11 METRO WEST REGION Ashland, Dover, Framingham, Holliston, Hopkinton, Medfield, Medway, Millis, Natick, Needham, Sherborn, Wellesley Single Family Homes Aug 2017 Aug 2016 Change Jul 2017 Change 2017 2016 Change Median Selling Price $670,000 $579,000 15.7% $632,188 6.0% $620,750 $590,000 5.2% Units Sold 303 327 -7.3% 316 -4.1% 1,948 1,960 -0.6% Active Listings 639 775 -17.5% 675 -5.3% --- --- --- Months Supply of Inventory 2.1 2.4 -11.0% 2.1 -1.4% --- --- --- New Listings 226 224 0.9% 241 -6.2% 2,571 2,807 -8.4% Pending Sales 223 308 -27.6% 232 -3.9% 2,072 2,113 -1.9% Days to Off Market 46 67 -31.3% 53 -13.2% 50 61 -18.0% Sold to Original Price Ratio 98.3% 97.6% 0.7% 99.8% -1.5% 98.3% 97.6% 0.8% Price per Square Foot $304 $278 9.4% $297 2.3% $295 $280 5.2% Year over Year Month over Month Year to Date Condominiums Aug 2017 Aug 2016 Change Jul 2017 Change 2017 2016 Change Median Selling Price $310,000 $405,000 -23.5% $373,000 -16.9% $369,000 $357,375 3.3% Units Sold 75 76 -1.3% 81 -7.4% 516 552 -6.5% Active Listings 157 146 7.5% 146 7.5% --- --- --- Months Supply of Inventory 2.1 1.9 8.9% 1.8 16.1% --- --- --- New Listings 79 67 17.9% 82 -3.7% 648 661 -2.0% Pending Sales 58 85 -31.8% 76 -23.7% 539 604 -10.8% Days to Off Market 31 63 -50.8% 34 -8.8% 41 57 -28.1% Sold to Original Price Ratio 100.2% 100.7% -0.4% 100.2% 0.0% 100.1% 99.1% 1.1% Price per Square Foot $254 $248 2.7% $258 -1.4% $258 $247 4.6% Year over Year Month over Month Year to Date $0 $100,000 $200,000 $300,000 $400,000 $500,000 $600,000 $700,000 $800,000 0 100 200 300 400 500 Aug-16 Sep-16 Oct-16 Nov-16 Dec-16 Jan-17 Feb-17 Mar-17 Apr-17 May-17 Jun-17 Jul-17 Aug-17 Condo Units Sold Single Family Units Sold Condo Sold Price Single Family Sold Price
- 12. © 2017 North Leaf Solutions LLC as Domus Analytics, under license for Greater Boston Association of REALTORS® 12 SOUTHERN NORFOLK REGION Avon, Bellingham, Canton, Foxboro, Franklin, Mansfield, Norfolk, Norwood, Randolph, Sharon, Stoughton, Walpole, Westwood, Wrentham Single Family Homes Aug 2017 Aug 2016 Change Jul 2017 Change 2017 2016 Change Median Selling Price $445,000 $434,500 2.4% $460,000 -3.3% $444,000 $425,000 4.5% Units Sold 304 338 -10.1% 279 9.0% 1,842 1,941 -5.1% Active Listings 637 719 -11.4% 652 -2.3% --- --- --- Months Supply of Inventory 2.1 2.1 -1.4% 2.3 -10.3% --- --- --- New Listings 289 293 -1.4% 290 -0.3% 2,432 2,612 -6.9% Pending Sales 269 333 -19.2% 266 1.1% 1,961 2,087 -6.0% Days to Off Market 49 62 -21.0% 45 8.9% 48 63 -23.8% Sold to Original Price Ratio 98.2% 97.9% 0.3% 98.5% -0.4% 98.2% 97.8% 0.5% Price per Square Foot $240 $234 2.6% $252 -4.7% $241 $226 6.7% Year over Year Month over Month Year to Date Condominiums Aug 2017 Aug 2016 Change Jul 2017 Change 2017 2016 Change Median Selling Price $279,250 $264,000 5.8% $237,500 17.6% $265,000 $258,950 2.3% Units Sold 68 77 -11.7% 68 0.0% 511 522 -2.1% Active Listings 153 195 -21.5% 161 -5.0% --- --- --- Months Supply of Inventory 2.3 2.5 -11.1% 2.4 -5.1% --- --- --- New Listings 71 103 -31.1% 90 -21.1% 650 713 -8.8% Pending Sales 73 96 -24.0% 63 15.9% 572 579 -1.2% Days to Off Market 31 59 -47.5% 41 -24.4% 46 59 -22.0% Sold to Original Price Ratio 97.5% 97.8% -0.4% 98.9% -1.5% 98.7% 97.6% 1.2% Price per Square Foot $219 $200 9.6% $210 4.3% $211 $198 6.8% Year over Year Month over Month Year to Date $0 $100,000 $200,000 $300,000 $400,000 $500,000 0 50 100 150 200 250 300 350 400 450 Aug-16 Sep-16 Oct-16 Nov-16 Dec-16 Jan-17 Feb-17 Mar-17 Apr-17 May-17 Jun-17 Jul-17 Aug-17 Condo Units Sold Single Family Units Sold Condo Sold Price Single Family Sold Price
- 13. © 2017 North Leaf Solutions LLC as Domus Analytics, under license for Greater Boston Association of REALTORS® 13 CITY OF BOSTON Single Family Homes Aug 2017 Aug 2016 Change Jul 2017 Change 2017 2016 Change Median Selling Price $589,000 $590,500 -0.3% $587,500 0.3% $585,000 $540,000 8.3% Units Sold 99 116 -14.7% 122 -18.9% 693 698 -0.7% Active Listings 200 201 -0.5% 229 -12.7% --- --- --- Months Supply of Inventory 2.0 1.7 16.6% 1.9 7.6% --- --- --- New Listings 82 79 3.8% 108 -24.1% 953 969 -1.7% Pending Sales 87 103 -15.5% 78 11.5% 738 760 -2.9% Days to Off Market 50 56 -10.7% 38 31.6% 40 50 -19.5% Sold to Original Price Ratio 102.1% 97.8% 4.4% 100.5% 1.6% 99.7% 98.9% 0.8% Price per Square Foot $400 $366 9.1% $417 -4.0% $399 $366 8.8% Year over Year Month over Month Year to Date Condominiums Aug 2017 Aug 2016 Change Jul 2017 Change 2017 2016 Change Median Selling Price $585,000 $575,000 1.7% $585,000 0.0% $595,000 $570,000 4.4% Units Sold 478 455 5.1% 477 0.2% 3,012 2,918 3.2% Active Listings 857 728 17.7% 946 -9.4% --- --- --- Months Supply of Inventory 1.8 1.6 12.1% 2.0 -9.6% --- --- --- New Listings 328 361 -9.1% 461 -28.9% 4,181 3,857 8.4% Pending Sales 333 412 -19.2% 410 -18.8% 3,303 3,161 4.5% Days to Off Market 39 46 -15.2% 39 0.0% 37 41 -9.8% Sold to Original Price Ratio 99.7% 100.4% -0.7% 101.1% -1.4% 100.5% 100.2% 0.3% Price per Square Foot $683 $699 -2.3% $694 -1.6% $705 $665 6.0% Year over Year Month over Month Year to Date $0 $100,000 $200,000 $300,000 $400,000 $500,000 $600,000 $700,000 0 100 200 300 400 500 600 Aug-16 Sep-16 Oct-16 Nov-16 Dec-16 Jan-17 Feb-17 Mar-17 Apr-17 May-17 Jun-17 Jul-17 Aug-17 Condo Units Sold Single Family Units Sold Condo Sold Price Single Family Sold Price
- 14. © 2017 North Leaf Solutions LLC as Domus Analytics, under license for Greater Boston Association of REALTORS® 14 MULTI-FAMILY MARKET SUMMARY Includes all 64 towns within the GBAR jurisdictional area 2 Family Homes Aug 2017 Aug 2016 Change Jul 2017 Change 2017 2016 Change Median Selling Price $654,444 $580,056 12.8% $650,500 0.6% $618,000 $550,000 12.4% Units Sold 154 170 -9.4% 149 3.4% 963 1,034 -6.9% Active Listings 267 320 -16.6% 232 15.1% --- --- --- Months Supply of Inventory 1.7 1.9 -8.0% 1.6 10.9% --- --- --- New Listings 186 157 18.5% 145 28.3% 1,392 1,449 -3.9% Pending Sales 121 222 -45.5% 139 -12.9% 1,034 1,131 -8.6% Days to Off Market 34 54 -37.0% 40 -15.0% 31 51 -38.5% Sold to Original Price Ratio 101.4% 99.7% 1.7% 102.9% -1.5% 101.6% 99.7% 1.9% Price per Square Foot $293 $259 13.3% $291 0.6% $279 $243 14.7% Year over Year Month over Month Year to Date 3 Family Homes Aug 2017 Aug 2016 Change Jul 2017 Change 2017 2016 Change Median Selling Price $812,500 $637,500 27.5% $765,000 6.2% $723,750 $613,750 17.9% Units Sold 50 64 -21.9% 45 11.1% 353 368 -4.1% Active Listings 100 150 -33.3% 106 -5.7% --- --- --- Months Supply of Inventory 2.0 2.3 -14.5% 2.4 -15.3% --- --- --- New Listings 69 72 -4.2% 80 -13.8% 526 553 -4.9% Pending Sales 63 86 -26.7% 56 12.5% 398 393 1.3% Days to Off Market 38 67 -43.3% 30 26.7% 35 55 -36.5% Sold to Original Price Ratio 103.6% 98.8% 4.9% 104.0% -0.3% 100.6% 98.2% 2.4% Price per Square Foot $288 $258 11.6% $292 -1.3% $260 $230 13.1% Year over Year Month over Month Year to Date 4 Family Homes Aug 2017 Aug 2016 Change Jul 2017 Change 2017 2016 Change Median Selling Price $1,262,500 $641,000 97.0% $951,000 32.8% $810,000 $865,000 -6.4% Units Sold 2 13 -84.6% 3 -33.3% 37 55 -32.7% Active Listings 20 26 -23.1% 18 11.1% --- --- --- Months Supply of Inventory 10.0 2.0 400.0% 6.0 66.7% --- --- --- New Listings 11 12 -8.3% 5 120.0% 69 92 -25.0% Pending Sales 7 9 -22.2% 2 250.0% 38 54 -29.6% Days to Off Market 59 40 47.5% 28 110.7% 47 75 -37.3% Sold to Original Price Ratio 93.5% 100.8% -7.3% 111.7% -16.3% 99.5% 95.6% 4.0% Price per Square Foot $299 $216 38.7% $345 -13.4% $251 $295 -14.8% Year to DateYear over Year Month over Month
- 15. © 2017 North Leaf Solutions LLC as Domus Analytics, under license for Greater Boston Association of REALTORS® 15 MULTI-FAMILY MARKET SUMMARY Includes all 64 towns within the GBAR jurisdictional area 5+ Family Homes Aug 2017 Aug 2016 Change Jul 2017 Change 2017 2016 Change Median Selling Price $2,120,000 $932,500 127.3% $3,512,500 -39.6% $2,450,000 $1,165,000 110.3% Units Sold 11 12 -8.3% 6 83.3% 56 64 -12.5% Active Listings 33 40 -17.5% 34 -2.9% --- --- --- Months Supply of Inventory 3.0 3.3 -9.9% 5.7 -47.1% --- --- --- New Listings 6 9 -33.3% 11 -45.5% 90 124 -27.4% Pending Sales 4 12 -66.7% 9 -55.6% 61 74 -17.6% Days to Off Market 101 44 129.5% 48 110.4% 57 69 -17.7% Sold to Original Price Ratio 98.8% 94.7% 4.4% 102.0% -3.1% 96.2% 94.1% 2.2% Price per Square Foot $371 $189 95.8% $600 -38.2% $442 $299 47.6% Year over Year Month over Month Year to Date $250,000 $1,250,000 $2,250,000 $3,250,000 $4,250,000 $5,250,000 $6,250,000 Aug-16 Sep-16 Oct-16 Nov-16 Dec-16 Jan-17 Feb-17 Mar-17 Apr-17 May-17 Jun-17 Jul-17 Aug-17 Median Selling Price Multi: 2 Family Multi: 3 Family Multi: 4 Family Multi: 5+ Family 170 154 64 50 13 2 12 11 0 20 40 60 80 100 120 140 160 180 200 Aug-16 Sep-16 Oct-16 Nov-16 Dec-16 Jan-17 Feb-17 Mar-17 Apr-17 May-17 Jun-17 Jul-17 Aug-17 Units Sold Multi: 2 Family Multi: 3 Family Multi: 4 Family Multi: 5+ Family
- 16. © 2017 North Leaf Solutions LLC as Domus Analytics, under license for Greater Boston Association of REALTORS® 16 GBAR JURISDICTIONAL AREA
- 17. © 2017 North Leaf Solutions LLC as Domus Analytics, under license for Greater Boston Association of REALTORS® 17 Days to Off Market is the Average number of days between when a property is listed and the off market date when an offer is accepted. Active Listings is the number of Active properties available for sale at the end of the month. Median Selling Price is the mid-point where the price for half of the sales are higher and half are lower. Median is preferred to average as it better accounts for outliers at the high or low end of the price range. Months Supply of Inventory (MSI), also known as Absorption, is the number of months it would take to sell through the units available for sale at the current monthly sales rate. The National Association of REALTORS® describes a balanced market as between 5 and 7 months supply of inventory (MSI). New Listings is the number of properties listed in a given month or time period. Pending Sales is the number of properties newly under contract in a given month or time period. Price per Square Foot is the average of the sold price divided by the square feet of the property. Sale Price to Original Price Ratio is the average of the Sales Price divided by the Original List Price, and expressed as a percentage. Units Sold is the number of properties which actually Sold within a given month or time period. Members of the Greater Boston Association of REALTORS® are authorized to reproduce and redistribute this copyrighted report or sections within in any format, including electronic or hard copy distribution. No other reprint or distribution of this report is granted unless specifically approved in writing by the GBAR, and all logos, graphics, or copyright information must not be removed or edited in any way. Market trends and analysis based on data from the MLS Property Information Network, Inc. through the end of each month. Due to timing of data entry into the MLS, data shown may be different than previously reported. The Monthly Insights report provides monthly summaries of the overall market served by the Greater Boston Association of REALTORS®. As market conditions vary within smaller geographic areas, the Association also provides to its members an online, interactive dashboard which delivers timely, relevant data with many more metrics and filtering capabilities. Contact your Association representative for details. GLOSSARY USAGE & DISCLAIMERS