
Recommended
More Related Content
Similar to Discrimination of the DPRK underground explosions and their aftershocks using the Pg/Lg spectral amplitude ratio
Similar to Discrimination of the DPRK underground explosions and their aftershocks using the Pg/Lg spectral amplitude ratio (20)
More from ivanokitov
More from ivanokitov (8)
Recently uploaded
Recently uploaded (20)
Discrimination of the DPRK underground explosions and their aftershocks using the Pg/Lg spectral amplitude ratio
- 1. Discrimination of the DPRK underground explosions and their aftershocks using the Pg/Lg spectral amplitude ratio Ivan Kitov, Ronan Le Bras, Mikhail Rozhkov, PTS CTBTO Irina Sanina, IDG RAS The views expressed herein are those of the author(s) and do not necessarily reflect the views of the CTBT Preparatory Commission.
- 2. Page 2 OUTLINE • Six DPRK explosions • Routine detection of explosions and aftershocks using waveform cross correlation. Multi-master method • Clustering of aftershocks according to waveform similarity • Usage of Pg/Lg spectral amplitude ratio method for discrimination of DPRK explosions and their aftershocks • The Mahalanobis distance as a discrimination criterion
- 3. Page 3 SEISMIC EVENTS AT THE DPRK TEST SITE Event Lat, deg Lon, deg ndef mb (IDC) Ms (IDC) ML(IDC) DPRK1 41.312 129.02 22 4.08 3.89 DPRK2 41.311 129.05 72 4.51 3.56 4.27 DPRK3 41.301 129.07 110 4.92 3.95 4.52 DPRK4 41.304 129.05 102 4.82 3.92 4.61 DPRK5 41.299 129.05 120 5.09 4.17 4.29 DPRK6 41.32 129.03 189 6.07 4.91 5.17 DPRK TESTS: IDC ESTIMATES
- 4. Page 4 23 WELL MEASURED DPRK5 and DPRK6 AFTERSHOCKS: IDC ESTIMATES USING WAVEFORM CROSS CORRELATION Date Time mb( Lg-scaled ) IDC LEB origin ID September 11, 2016 (A_SHOCK1) 1:50:48 AM 2.83 13558133 September 3, 2017 (A_SHOCK2) 3:38:31 AM 4.11 14807656 September 3, 2017 (A_SHOCK6) 9:31:28 AM 2.59 September 23, 2017 (A_SHOCK3) 4:42:58 AM 3.08 14892975 September 23, 2017 (A_SHOCK4) 8:29:14 AM 3.74 14892904 October 12, 2017 (A_SHOCK5) 4:41:06 PM 3.33 14968848 October 31, 2017 10:20:13 AM 2.51 December 1, 2017 10:45:54 PM 2.91 December 5, 2017 2:40:52 PM 3.14 15176138 December 6, 2017 4:20:05 PM 2.59 December 9, 2017 6:08:40 AM 2.78 15189602 December 9, 2017 6:13:31 AM 3.44 15185217 December 9, 2017 6:40:00 AM 3.06 15185213 February 5, 2018 10:32:30 AM 2.74 February 5, 2018 8:07:29 PM 2.93 February 5, 2018 9:57:35 PM 2.90 February 6, 2018 4:49:36 AM 2.70 February 6, 2018 10:12:30 AM 2.68 February 6, 2018 10:53:52 AM 3.09 February 7, 2018 9:46:23 PM 3.36 15428296 February 8, 2018 5:39:17 PM 2.69 April 22, 2018 7:25:08 PM 2.76 15724447 April 22, 2018 7:31:18 PM 3.07 15724134 THESE AFTERSHOCKS AND 6 DPRK TESTS ARE USED AS MASTER EVENTS IN MULTI-MASTER CROSS CORRELATION (CC) DETECTION AND ASSOCIATION. THE P/S DISCRIMINATION CRITERIA ARE APPLIED TO THESE EVENTS ONLY SINCE Pg AMPLITUDE IS TOO LOW FOR SMALLER AFTERSHOCKS AFTERSHOCKS SELECTED BASED ON LARGEST NUMBER OF CC DETECTIONS
- 5. Page 5 EXPLOSION AND AFTERSHOCK WAVEFORMS Regional network: IMS: KSRS and USRK non-IMS: MDJ and SEHB Pg Pn Lg
- 6. Page 6 WAVEFORM TEMPLATES FOR CROSS CORRELATION SEHB, A_SHOCK2 MDJ, DPRK5
- 7. Page 7 CROSS CORRELATION KSRS Detection threshold
- 8. Page 8 SIMILARITY OF AFTERSHOCKS HIGHEST KSRS SNRCC HIGHEST USRK SNRCC CC WINDOW 10 s, 20s, 30s, …,150 s in length. 6 Frequency Bands. STA = 0.1 s; LTA = 60 s Max SNRcc over all lengths and frequencies is determined orid 3875968 5397597 9486691 12733679 13552792 14812788 11111111 14807656 11111116 11111113 11111114 11111115 20173041 20173351 20173391 20173401 20173431 20173432 20173433 20180361 20180362 20180363 20180371 20180372 20180373 20180381 20180391 20181121 20181122 3875968 357 187 203 116 192 123 8.5 30 6.4 16 37 23 5.2 9.3 23 11 7.1 32 15 5.1 5.5 4.2 4 7.7 11 12 8 6.4 11 5397597 177 ### 733 258 480 413 11 43 6.5 14 36 21 6.1 8 16 6.6 8.2 21 14 5.3 5.8 4.3 4 4.3 17 14 7.5 7.1 16 9486691 183 878 ### 620 576 614 11 45 7.5 15 31 22 6.4 8.8 16 5.6 5.9 21 15 5.5 6.1 4.3 4.3 4.6 16 15 6.7 6.8 19 12733679 98 329 409 914 519 757 9.5 51 7.5 14 32 20 7.6 7.2 15 7.6 5.4 19 13 5.8 5.7 4 4.1 5.1 15 19 7.8 6.2 16 13552792 172 910 570 549 ### 847 9.5 47 6.8 14 56 27 8.3 7.9 15 8.6 7 22 14 4.6 5.6 3.9 4.2 4.8 16 19 7 6.8 18 14812788 119 499 538 808 527 ### 8.9 58 6.8 15 48 23 8 9.1 14 9 5.9 24 16 4.9 6.3 4.7 4.5 5.1 15 19 7.3 6.8 16 11111111 7.8 9.1 13 8.5 9.2 8.4 123 13 29 11 18 13 4.7 7.2 9.2 5.6 5.3 13 8.9 10 12 6.8 4.4 5.8 30 25 12 17 27 14807656 66 69 60 65 79 89 12 189 8 12 21 13 6.1 7.2 11 6.4 4.6 15 11 4.7 5.2 4.9 4 4.6 11 14 7.5 7.7 9.7 11111116 6.4 6.3 7.9 6.8 6.7 7.2 30 9.3 114 10 13 12 6.8 7.7 9.1 5 4.5 11 6.8 11 14 4.8 5.2 5.6 29 22 11 13 26 11111113 16 13 15 12 15 16 13 13 9.8 108 106 99 4.7 49 68 26 15 55 33 10 7.1 8.7 5 4.4 21 29 15 10 25 11111114 47 38 40 31 66 58 17 19 13 97 231 97 5 57 83 26 15 55 32 17 8.4 11 8.2 5.9 33 59 26 17 38 11111115 31 20 19 23 30 25 14 17 14 89 160 140 4.2 52 98 33 19 71 47 12 4.7 5.8 5.5 4.7 24 31 14 11 29 20173041 3.6 6.1 6.2 6.7 7.1 7.4 4.3 4.5 5.9 4 4.6 4.2 109 4.5 4.6 4.9 7.8 4.7 5.1 4.5 4.6 4.5 4.3 5.7 6.5 8 6.2 8 6.6 20173351 8.9 7.4 7.1 6.4 7.2 8.8 7.3 8 8.3 47 63 53 4.8 122 44 24 9.3 37 22 5.8 4.4 5.3 5 3.9 12 15 8.7 7.5 16 20173391 19 14 14 18 18 19 9.8 12 10 60 105 92 5.2 46 116 41 21 86 39 8.6 6.5 5.6 5.1 4.9 16 22 11 8.9 25 20173401 11 6.2 5.7 6.9 8.3 8.4 5 6.2 4.4 24 23 29 4.3 23 36 102 9.2 35 17 4.4 4.8 4.3 4.1 3.8 6.2 8.1 5.1 4.4 9.1 20173431 4.8 6.3 5.7 5.1 5.9 6 5.3 4.9 4.7 13 13 18 7.4 8.7 16 8.8 103 24 19 4.9 5.9 4.3 6 5.4 4.3 4.6 4 5.2 4.9 20173432 27 17 12 15 29 12 12 17 7.5 51 47 70 4.7 39 87 35 28 148 77 8 7.1 5.1 4.1 6.4 17 25 6.5 9.3 17 20173433 11 8.2 5.3 5.9 8.1 7.4 6.6 13 4.9 32 31 44 3.7 26 46 18 21 78 123 5.1 4.9 4.4 3.8 4.5 9 6 4.9 5.8 9 20180361 3.7 4.9 5.6 6 5.7 4.8 12 4.6 9.9 8.2 14 11 6.5 4.7 5.5 4.6 4 8.1 5.3 110 12 9.5 7.3 9.2 32 35 16 15 36 20180362 4.7 5.7 5.2 5.1 6.1 5.2 12 6.4 12 6.6 7.8 6.8 5.6 4.1 5.7 4.4 4 4.7 4.9 13 88 5.5 4.8 4.3 23 23 7.8 16 24 20180363 4.6 4.8 4.3 3.9 4 4.6 7.6 5.5 5.8 7.4 11 5.4 4.8 5.7 4.6 5.6 5.3 5.7 4.9 9.1 4.2 90 5 4.7 19 19 10 6.3 22 20180371 4.5 4.5 4.2 3.9 4.2 4.4 4.8 4.3 4.7 4.8 7.6 5.6 4.5 4.9 3.9 3.8 5.6 4 3.7 7.8 3.9 3.7 118 5.2 7.4 12 5.2 3.7 11 20180372 4.6 4.8 4.9 5.5 5.3 4.4 5.3 6.1 5.6 4.9 6.2 4.5 4.7 3.6 4.5 4.2 5.8 5.6 4.4 7 4.2 5.2 4.4 90 11 19 8.3 5.1 16 20180373 8.6 14 14 13 14 12 28 14 29 20 39 29 6.9 10 17 7.3 4.3 19 11 33 28 21 9.4 15 118 83 41 46 77 20180381 16 22 19 29 23 29 26 19 26 34 46 41 7.3 14 23 9.4 4.7 25 12 36 24 21 13 26 80 183 43 31 94 20180391 6.5 6.3 6.7 7.8 6.9 8.5 12 9.5 11 11 23 12 6.5 7.9 6.9 4.6 5.2 6.2 4.9 13 7.6 11 5.7 6.8 32 34 108 16 51 20181121 7.5 6.9 6.4 6.2 6.6 6.8 18 9.2 14 9.9 16 11 7.9 7.1 7.9 4.2 4.4 9 5.4 14 16 6.2 4.2 4.7 45 34 15 94 42 20181122 9 17 21 17 19 19 28 12 30 24 43 32 6.4 14 22 9.6 5.4 23 12 37 28 23 11 19 98 100 47 39 128 orid 5397597 9486691 12733679 13552792 14812788 11111111 14807656 11111116 11111113 11111114 11111115 20173041 20173351 20173391 20173401 20173431 20173432 20173433 20180361 20180362 20180363 20180371 20180372 20180373 20180381 20180391 20181121 20181122 5397597 ### 592 344 296 360 22 25 10 17 45 35 5.6 14 23 9.1 10 41 23 21 10 11 8.9 11 30 65 11 14 46 9486691 822 ### 468 554 408 20 25 9.5 19 38 44 6.6 16 31 9.8 10 42 25 20 9.9 9.9 10 12 39 68 12 16 43 12733679 136 152 274 173 214 18 41 7.1 11 22 23 5.9 8.8 18 5.7 6.9 22 17 10 5.1 8.7 5.2 5.3 16 23 9.5 11 17 13552792 176 148 209 319 179 24 29 10 12 22 18 6.3 7.1 15 5.3 5.8 17 14 7.9 8.1 7.5 4.6 5 16 24 6.9 11 19 14812788 126 141 223 183 201 24 27 11 11 20 15 5.2 6.8 13 4.4 6.4 18 12 8.1 6.1 14 6.1 5.6 18 29 7.5 8 21 11111111 14 11 16 18 17 77 16 21 8.5 15 13 4.7 6 12 9.6 6.4 18 12 8.1 10 12 6.8 6 10 17 9.7 7.5 15 14807656 54 25 40 40 25 19 129 10 22 36 30 4.7 17 17 10 8.4 32 20 12 7.2 9.7 4.6 5.6 19 15 9.4 11 18 11111116 7.5 6.1 5 8 9 17 7.8 64 6.2 14 6.3 5.3 6.2 8.1 6.4 7.9 13 11 9.2 6.3 9.2 4.5 6 16 6.1 5.1 11 12 11111113 22 15 14 10 6.8 7.5 20 7.1 115 125 117 8.9 54 70 24 21 38 46 32 16 16 14 16 45 57 24 26 45 11111114 22 18 19 18 12 11 18 14 69 249 88 9.3 41 55 16 16 53 46 33 18 17 11 12 47 53 22 26 50 11111115 34 37 29 31 33 10 11 6.2 90 111 176 8.4 36 84 17 19 69 52 22 14 18 15 13 40 60 23 24 59 20173041 4.7 4.1 4.8 5.1 4.7 4.2 5.2 4.4 5.5 10 9.4 68 6.2 5.9 4.6 7.2 11 11 5.8 4.9 4.2 4.6 4.5 9.4 5.3 5.9 7.5 7 20173351 7.8 6.5 6.8 4.4 6 5.5 12 5.1 39 37 31 4 51 11 9.1 7.5 18 14 19 6.6 9.1 9.7 8.7 22 23 12 15 26 20173391 12 15 16 16 10 13 21 7.8 58 66 93 5.7 42 123 30 22 82 53 25 14 12 12 14 34 57 24 25 38 20173401 4.9 5.4 3.7 4.7 3.8 6.3 9.1 6.6 19 16 23 5.5 9.5 29 56 8.8 21 15 10 5.7 6.1 5.8 5.7 11 15 12 8.1 15 20173431 4.8 4.6 4.7 4 0 4.9 6.5 6.7 15 13 20 4.6 6.3 8.4 7.9 62 28 29 6.3 5.9 8.7 4.2 4.5 7.2 7.6 8.7 8.6 11 20173432 19 18 14 13 15 9 24 7.9 28 47 57 8.9 16 32 17 33 121 91 13 11 7.6 7.6 6.6 20 22 18 18 24 20173433 10 11 8.2 7.2 9.4 6.9 18 8.4 29 38 53 8 14 18 13 31 105 92 13 12 9.2 6.6 8.6 21 17 21 23 26 20180361 9.4 7.4 9.1 5.7 4.5 6.6 7.5 7.4 22 27 36 5.1 19 15 13 9.9 16 14 64 19 30 14 22 55 39 34 33 58 20180362 8.8 5 6 4.2 4.3 5.1 6.3 5 12 17 17 5.2 7.1 5.8 6 7.2 13 10 18 59 8.1 4.4 6.2 29 14 13 15 15 20180363 11 9.9 12 8.1 8.6 7 7.2 5.2 13 19 20 0 8.6 4.4 4.8 8.5 9.9 8.3 31 7.7 62 6.7 8.9 29 27 24 11 29 20180371 4 4.4 5.3 5.4 5.6 4.9 4.2 4.9 10 7.6 11 4 6.5 6.4 4.8 4.7 7 6.5 11 5.6 7.2 57 12 18 23 15 8.6 22 20180372 4.8 4.4 4.2 4 4.8 4.8 5.9 5.3 10 10 13 4.4 7.5 5.8 5.3 4.9 8 8.6 21 6.7 10 14 49 25 25 21 11 26 20180373 19 15 15 9.2 10 7 10 12 29 54 54 10 25 16 11 9 23 26 66 28 30 19 28 106 58 41 47 68 20180381 20 19 23 18 23 15 7.2 6.2 36 57 64 5.8 27 22 15 11 31 23 47 15 31 28 33 66 182 46 26 81 20180391 7.4 5.4 5.5 4.1 5.5 6 7.3 5.7 18 15 26 5.9 15 11 9.7 12 23 19 37 14 27 17 21 31 42 71 22 54 20181121 8.2 7.1 6.5 5.7 6 5.1 9.9 11 21 26 23 7.4 16 7.8 7.2 9 16 15 30 22 13 8.9 12 42 23 20 68 38 20181122 16 13 11 8.5 7.5 13 12 11 36 45 61 6.9 25 17 14 12 31 26 65 19 29 25 32 76 83 48 37 115 TIME ORDER FOR EXPLOSIONS AND AFTERSHOCKS COLOR SCALES ARE INDEPENDENT FOR 4 DIFFERENT CASES: E-E, E-A, A-E, A-A
- 9. Page 9 CLUSTERING OF AFTERSHOCKS HIGHEST KSRS SNRCC HIGHEST USRK SNRCC Two potential clusters by similarity: DPRK5 (includes 11.09.2016 aftershock) and DPRK6 (includes the biggest aftershock) orid 3875968 5397597 9486691 12733679 13552792 14812788 14807656 11111111 11111116 20180373 20180381 20180391 20181121 20181122 20180361 20180362 20180363 20180371 20180372 20173041 11111113 11111114 11111115 20173351 20173391 20173401 20173431 20173432 20173433 3875968 ## ## ## ## ## ## 30 8 6 11 12 8 6 11 5 6 4 4 8 5 16 37 23 9 23 11 7 32 15 5397597 ## ## ## ## ## ## 43 11 7 17 14 8 7 16 5 6 4 4 4 6 14 36 21 8 16 7 8 21 14 9486691 ## ## ## ## ## ## 45 11 8 16 15 7 7 19 6 6 4 4 5 6 15 31 22 9 16 6 6 21 15 12733679 98 ## ## ## ## ## 51 10 8 15 19 8 6 16 6 6 4 4 5 8 14 32 20 7 15 8 5 19 13 13552792 ## ## ## ## ## ## 47 10 7 16 19 7 7 18 5 6 4 4 5 8 14 56 27 8 15 9 7 22 14 14812788 ## ## ## ## ## ## 58 9 7 15 19 7 7 16 5 6 5 4 5 8 15 48 23 9 14 9 6 24 16 14807656 66 69 60 65 79 89 ## 12 8 11 14 7 8 10 5 5 5 4 5 6 12 21 13 7 11 6 5 15 11 11111111 8 9 13 8 9 8 13 ## 29 30 25 12 17 27 10 12 7 4 6 5 11 18 13 7 9 6 5 13 9 11111116 6 6 8 7 7 7 9 30 ## 29 22 11 13 26 11 14 5 5 6 7 10 13 12 8 9 5 5 11 7 20180373 9 14 14 13 14 12 14 28 29 ## 83 41 46 77 33 28 21 9 15 7 20 39 29 10 17 7 4 19 11 20180381 16 22 19 29 23 29 19 26 26 80 ## 43 31 94 36 24 21 13 26 7 34 46 41 14 23 9 5 25 12 20180391 6 6 7 8 7 8 10 12 11 32 34 ## 16 51 13 8 11 6 7 7 11 23 12 8 7 5 5 6 5 20181121 8 7 6 6 7 7 9 18 14 45 34 15 94 42 14 16 6 4 5 8 10 16 11 7 8 4 4 9 5 20181122 9 17 21 17 19 19 12 28 30 98 ## 47 39 ## 37 28 23 11 19 6 24 43 32 14 22 10 5 23 12 20180361 4 5 6 6 6 5 5 12 10 32 35 16 15 36 ## 12 10 7 9 6 8 14 11 5 5 5 4 8 5 20180362 5 6 5 5 6 5 6 12 12 23 23 8 16 24 13 88 5 5 4 6 7 8 7 4 6 4 4 5 5 20180363 5 5 4 4 4 5 6 8 6 19 19 10 6 22 9 4 90 5 5 5 7 11 5 6 5 6 5 6 5 20180371 4 5 4 4 4 4 4 5 5 7 12 5 4 11 8 4 4 ## 5 5 5 8 6 5 4 4 6 4 4 20180372 5 5 5 6 5 4 6 5 6 11 19 8 5 16 7 4 5 4 90 5 5 6 4 4 4 4 6 6 4 20173041 4 6 6 7 7 7 5 4 6 6 8 6 8 7 5 5 5 4 6 ## 4 5 4 5 5 5 8 5 5 11111113 16 13 15 12 15 16 13 13 10 21 29 15 10 25 10 7 9 5 4 5 ## ## 99 49 68 26 15 55 33 11111114 47 38 40 31 66 58 19 17 13 33 59 26 17 38 17 8 11 8 6 5 97 ## 97 57 83 26 15 55 32 11111115 31 20 19 23 30 25 17 14 14 24 31 14 11 29 12 5 6 6 5 4 89 ## ## 52 98 33 19 71 47 20173351 9 7 7 6 7 9 8 7 8 12 15 9 8 16 6 4 5 5 4 5 47 63 53 ## 44 24 9 37 22 20173391 19 14 14 18 18 19 12 10 10 16 22 11 9 25 9 7 6 5 5 5 60 ## 92 46 ## 41 21 86 39 20173401 11 6 6 7 8 8 6 5 4 6 8 5 4 9 4 5 4 4 4 4 24 23 29 23 36 ## 9 35 17 20173431 5 6 6 5 6 6 5 5 5 4 5 4 5 5 5 6 4 6 5 7 13 13 18 9 16 9 ## 24 19 20173432 27 17 12 15 29 12 17 12 8 17 25 7 9 17 8 7 5 4 6 5 51 47 70 39 87 35 28 ## 77 20173433 11 8 5 6 8 7 13 7 5 9 6 5 6 9 5 5 4 4 5 4 32 31 44 26 46 18 21 78 ## orid 5397597 9486691 12733679 13552792 14812788 14807656 11111111 11111116 20180373 20180381 20180391 20181121 20181122 20180361 20180362 20180363 20180371 20180372 20173041 11111113 11111114 11111115 20173351 20173391 20173401 20173431 20173432 20173433 5397597 ## ## ## ## ## 25 22 10 30 65 11 14 46 21 10 11 9 11 6 17 45 35 14 23 9 10 41 23 9486691 ## ## ## ## ## 25 20 10 39 68 12 16 43 20 10 10 10 12 7 19 38 44 16 31 10 10 42 25 12733679 ## ## ## ## ## 41 18 7 16 23 10 11 17 10 5 9 5 5 6 11 22 23 9 18 6 7 22 17 13552792 ## ## ## ## ## 29 24 10 16 24 7 11 19 8 8 8 5 5 6 12 22 18 7 15 5 6 17 14 14812788 ## ## ## ## ## 27 24 11 18 29 7 8 21 8 6 14 6 6 5 11 20 15 7 13 4 6 18 12 14807656 54 25 40 40 25 ## 19 10 19 15 9 11 18 12 7 10 5 6 5 22 36 30 17 17 10 8 32 20 11111111 14 11 16 18 17 16 77 21 10 17 10 7 15 8 10 12 7 6 5 8 15 13 6 12 10 6 18 12 11111116 8 6 5 8 9 8 17 64 16 6 5 11 12 9 6 9 4 6 5 6 14 6 6 8 6 8 13 11 20180373 19 15 15 9 10 10 7 12 ## 58 41 47 68 66 28 30 19 28 10 29 54 54 25 16 11 9 23 26 20180381 20 19 23 18 23 7 15 6 66 ## 46 26 81 47 15 31 28 33 6 36 57 64 27 22 15 11 31 23 20180391 7 5 6 4 6 7 6 6 31 42 71 22 54 37 14 27 17 21 6 18 15 26 15 11 10 12 23 19 20181121 8 7 6 6 6 10 5 11 42 23 20 68 38 30 22 13 9 12 7 21 26 23 16 8 7 9 16 15 20181122 16 13 11 8 8 12 13 11 76 83 48 37 ## 65 19 29 25 32 7 36 45 61 25 17 14 12 31 26 20180361 9 7 9 6 5 8 7 7 55 39 34 33 58 64 19 30 14 22 5 22 27 36 19 15 13 10 16 14 20180362 9 5 6 4 4 6 5 5 29 14 13 15 15 18 59 8 4 6 5 12 17 17 7 6 6 7 13 10 20180363 11 10 12 8 9 7 7 5 29 27 24 11 29 31 8 62 7 9 0 13 19 20 9 4 5 9 10 8 20180371 4 4 5 5 6 4 5 5 18 23 15 9 22 11 6 7 57 12 4 10 8 11 6 6 5 5 7 6 20180372 5 4 4 4 5 6 5 5 25 25 21 11 26 21 7 10 14 49 4 10 10 13 7 6 5 5 8 9 20173041 5 4 5 5 5 5 4 4 9 5 6 7 7 6 5 4 5 4 68 6 10 9 6 6 5 7 11 11 11111113 22 15 14 10 7 20 8 7 45 57 24 26 45 32 16 16 14 16 9 ## ## ## 54 70 24 21 38 46 11111114 22 18 19 18 12 18 11 14 47 53 22 26 50 33 18 17 11 12 9 69 ## 88 41 55 16 16 53 46 11111115 34 37 29 31 33 11 10 6 40 60 23 24 59 22 14 18 15 13 8 90 ## ## 36 84 17 19 69 52 20173351 8 6 7 4 6 12 6 5 22 23 12 15 26 19 7 9 10 9 4 39 37 31 51 11 9 8 18 14 20173391 12 15 16 16 10 21 13 8 34 57 24 25 38 25 14 12 12 14 6 58 66 93 42 ## 30 22 82 53 20173401 5 5 4 5 4 9 6 7 11 15 12 8 15 10 6 6 6 6 5 19 16 23 10 29 56 9 21 15 20173431 5 5 5 4 0 7 5 7 7 8 9 9 11 6 6 9 4 5 5 15 13 20 6 8 8 62 28 29 20173432 19 18 14 13 15 24 9 8 20 22 18 18 24 13 11 8 8 7 9 28 47 57 16 32 17 33 ## 91 20173433 10 11 8 7 9 18 7 8 21 17 21 23 26 13 12 9 7 9 8 29 38 53 14 18 13 31 ## 92 DPRK5 ? DPRK6 ?
- 10. Page 10 MULTI-MASTER APPROACH Multi-master method provides: • Lower detection threshold (this event was not detected by standard methods and DPRK tests as master event) • More reliable solution (clustering of detections within 2 s interval) • More reliable location • More accurate location Notice much higher SNRCC than standard SNR DATE 2017246 ORIGIN TIME 09:31:29.86 Estimated distance from DPRK5 3.8km +-3 km Station Arrival time Residual, s SNRCC SNR SEHB 09:32:18.64 -1.13 43.6 3.4 SEHB 09:32:19.99 0.22 21.9 2.3 SEHB 09:32:20.69 0.92 6.2 3.2 SEHB 09:32:21.44 1.67 7.3 2.6 MDJ 09:32:22.59 -0.60 5.8 4.0 MDJ 09:32:23.19 0.00 5.5 3.9 MDJ 09:32:23.41 0.22 48.8 3.9 MDJ 09:32:23.53 0.35 6.1 4.0 MDJ 09:32:23.61 0.43 5.9 4.0 USRK 09:32:25.28 -0.69 15.7 4.8 USRK 09:32:25.50 -0.47 8.0 4.8 USRK 09:32:25.55 -0.42 13.0 4.8 USRK 09:32:25.68 -0.29 7.7 4.8 USRK 09:32:25.73 -0.24 9.6 4.8 USRK 09:32:25.88 -0.41 57.9 4.8 USRK 09:32:26.12 0.16 14.7 4.8 USRK 09:32:26.58 0.61 5.1 4.8 USRK 09:32:27.32 1.36 9.8 4.8 KSRS 09:32:31.00 -1.00 5.3 5.5 KSRS 09:32:31.20 -0.80 21.8 5.5 KSRS 09:32:31.35 -0.44 98.0 5.5 KSRS 09:32:31.65 -0.35 5.3 5.5 KSRS 09:32:32.25 0.25 15.5 5.5 KSRS 09:32:32.25 0.25 7.0 5.5 KSRS 09:32:32.40 0.40 13.1 5.5 MULTI-MASTER SOLUTION
- 11. Page 11 CONCENTRATION OF DETECTIONS IN MULTI-MASTER APPROACH The number of origin times from detections by 57 templates at USRK and KSRS within running 8 s interval with a 1 s step Out of noise statistics Noise quasi-normal statistics DPRK6 and biggest aftershock Weak aftershock with more detections
- 12. Page 12 AFTERSHOCKS FOUND USING MULTI-MASTER METHOD 81 aftershocks with 15 and more associated detections after the DPRK 5 and DPRK6 (209 aftershocks with Nassoc>=11)
- 13. Page 13 MAGNITUDES OF AFTERSHOCKS Scaling of Lg-amplitude to the biggest aftershock (3:38:31 UTC, 03.09.2017) with mb(IDC)=4.11
- 14. Page 14 Pg/Lg RATIOS explosions explosions aftershocks aftershocks
- 15. Page 15 MEAN VALUE AND STANDARD DEVIATION
- 16. Page 16 DISTANCE BETWEEN MEAN VALUES MEASURED IN STANDARD DEVIATIONS
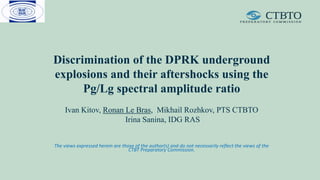
- 17. Page 17 NETWORK DISCRIMINATION Pg/Lg RATIOS STATION DPRK2 DPRK3 DPRK4 DPRK5 DPRK6 A1 A2 A3 A4 A5 FB1 0.526 0.587 0.643 0.713 0.966 0.928 0.659 0.615 0.290 0.702 FB2 0.807 0.896 1.038 1.039 1.235 0.741 0.562 0.542 0.371 0.504 FB3 1.089 1.198 1.302 1.236 1.459 0.680 0.543 0.575 0.414 0.460 FB4 1.568 1.643 1.581 1.480 1.723 0.760 0.568 0.589 0.426 0.430 FB5 1.997 2.056 1.766 1.694 1.836 0.819 0.630 0.575 0.441 0.412 FB6 2.767 2.821 2.251 2.256 2.295 0.829 0.887 0.610 0.549 0.432 FB1 0.851 0.809 1.042 1.353 1.809 0.763 0.285 0.411 0.351 0.354 FB2 1.302 1.355 1.649 2.033 2.548 0.786 0.250 0.385 0.390 0.372 FB3 1.684 1.953 2.123 2.370 2.936 0.737 0.249 0.402 0.422 0.382 FB4 2.196 2.688 2.589 2.705 3.241 0.753 0.329 0.527 0.530 0.445 FB5 2.559 2.861 2.768 2.925 3.475 0.904 0.443 0.667 0.612 0.538 FB6 3.211 3.036 3.171 3.205 3.870 1.190 0.568 0.933 0.710 0.718 FB1 0.564 0.574 0.808 0.873 1.029 0.654 0.485 0.480 0.347 0.336 FB2 1.059 1.185 0.931 1.713 1.589 0.842 0.417 0.711 0.432 0.511 FB3 1.630 1.901 0.997 2.410 1.940 0.906 0.399 0.946 0.549 0.705 FB4 2.477 2.870 1.171 3.092 2.549 0.962 0.436 1.096 0.771 1.007 FB5 2.814 3.081 1.234 3.318 2.891 1.005 0.517 1.118 0.907 1.175 FB6 3.312 3.284 1.177 3.723 3.279 1.127 0.709 1.075 0.928 1.087 KSRS USRK MDJ EVENT
- 18. Page 18 NETWORK DISCRIMINATION MAHALANOBIS DISTANCE Short (0.1-4.2) Mahalanobis distances within groups Large (100-20000) Mahalanobis, (square) MD, distances between groups Critical α=0.001 corresponds to MD =16.3 for df=3
- 19. DISCUSSION • 23 aftershocks with mb between 2.5 and 4.1 were found using cross correlation. These events are tested for Pg/Lg spectral ratio discrimination • 23 well measured aftershocks are likely split into two clusters with similarity measured by SNRcc and might be associated with two different explosions – DPRK5 and DPRK6 • Multi-master cross-correlation method is more effective in detection of the smallest events (81 reliable events found) and uses the observed variation in similarity between aftershocks • DPRK explosions and their aftershocks can be accurately discriminated using the method of Pg/Lg spectral ratio • The Mahalanobis distance serves for extremely effective network discrimination • Aftershocks sequence is likely not ended with the last few weak events found in May 2018 and two bigger events on April 22, 2018.
Editor's Notes
- The IDC detected all six DPRK underground tests. The number of associated stations increased with magnitude and also due to new IMS stations deployed since 2006. All explosions have mb by approximately one unit of magnitude larger than Ms, and thus, are not screened out by mb-Ms criterion. IDC routine automatic processing detected two events: 3:38:31.88 UTC on September 3 and 8:29:16.29 UTC on September 23 , 2017. We interpret both events as the DPRK6 aftershocks. A prototype IDC waveform cross correlation (WCC) processing detected these two aftershocks and three more events with similar characteristics. All five aftershocks were reviewed by IDC analysts who confirmed them as valid seismic events saved under the IDC LEB account. Two from five aftershocks included 3 and more IMS primary stations and were saved as REB events and were also published by the ISC.
- The IDC detected all six DPRK underground tests. The number of associated stations increased with magnitude and also due to new IMS stations deployed since 2006. All explosions have mb by approximately one unit of magnitude larger than Ms, and thus, are not screened out by mb-Ms criterion. IDC routine automatic processing detected two events: 3:38:31.88 UTC on September 3 and 8:29:16.29 UTC on September 23 , 2017. We interpret both events as the DPRK6 aftershocks. A prototype IDC waveform cross correlation (WCC) processing detected these two aftershocks and three more events with similar characteristics. All five aftershocks were reviewed by IDC analysts who confirmed them as valid seismic events saved under the IDC LEB account. Two from five aftershocks included 3 and more IMS primary stations and were saved as REB events and were also published by the ISC.
- All five aftershocks found by the WCC method were detected by regional IMS array stations USRK and KSRS at distances 410 km and 440 km, respectively. Auxiliary 3-C IMS station KLR is at the distance of ~900 km from the DPRK test site has also detected explosions and aftershocks. To corroborate our findings we added to our analysis two non-IMS 3-C stations SEHB (~345 km) and MDJ (~370 km). Here we present waveforms recorded at station USRK from the biggest explosion DPRK6 and its biggest (mb=4.1 similar to that of the DPRK1) aftershock. To demonstrate the change in frequency content of various regional phases (Pn, Pg, Lg) we filter original waveforms in 6 frequency bands: 1-2, 1.3-3, 2-4, 3-6, 4-8, 6-12 Hz. Since KSRS and SEHB have the sampling rate of 20 Hz, the latter filter is 6-10 Hz for them. The difference in Pg and Lg relative amplitudes between DPRK6 and its aftershock is clear.
- This slide continues waveform presentation at stations KSRS, SEHB, and MDJ depicting various DPRK tests and aftershocks. The overall difference in frequency content between explosions and aftershocks is confirmed, but the DPRK1 looks a bit different from DPRK5 and DPRK6. Having records from DPRK tests at USRK and KSRS we created corresponding waveform templates for the WCC detector using the DPRK4 only, which found five aftershocks in automatic processing at two IMS stations. In the prototype processing pipeline we used the length of correlation window of 10 s and conservative values of the STA (0.8 s) and LTA (20 s) lengths and STA/LTA threshold. With five aftershocks found as valid seismic events one can also use corresponding waveforms as templates. We also extend cross correlation analysis by varying defining parameters: CC window length, STA and LTA, thresholds, frequency bands in broader ranges.
- Typical results of the WCC use are presented in this slide as time series (traces) of the cross correlation coefficient (CC) and signal-to-noise ratio SNR (STA/LTA). Further we use SNRCC for CC traces in order to distinguish from standard SNR obtained from actual waveforms. Here we present results obtained for stations USRK. Since we process 1h intervals, the hour between 3:00 and 4:00 a.m. September 3, 2017 is shown. Time is presented in sample of time, 1 sample= 0.025 s. The upper left panel shows the CC trace obtained by correlation of the multichannel USRK waveform with a waveform template obtained from the DPRK2. The CC window length 140 s. The frequency band is 4-8 Hz. One can see two sharp picks corresponding to DPRK6 and its aftershock (A_SHOCK2) 8.5 min later. Correlation between DPRK2 and DPRK6 is better than the one between DPRK2 and A_SHOCK2. The mid-left panel presents similar trace for the A_SCHOCK1 (11.09.2016) and A_SHOCK2 and the lower-left panel shows the CC trace for the A_SHOCK1 and DPRK2 as a template. In all cases, CC picks on arrival times of Pn from these events are clear. To the right, we present shorter time intervals near representative CC-detections. The upper two panels illustrate the importance of master event – the CC peak for the DPRK3, and the A_SHOCK2 template results a much higher peak, which is sharp also and one can use a really small STA value of 0.1 s to produce a sharp SNRCC peak as shown in the lower panel. The arrival time can be determined with a high accuracy.
- Varying all defining parameters we calculate largest SNRCC for all pairs of events (6 DPRK and 5 aftershocks). This slide presents these peak values as a color highlighted table for stations KSRS and USRK. Chiefly, the highest values are of the diagonal. But there are couple exclusions as well. This means that another event suppresses, in terms of CC level, pre-signal noise better than the slave event. In all cases, STA=0.1s, LTA=20s, and the most efficient CC length varies from 10 s to 150 s. The best frequency band, FB, also mainly depends on source type. The largest SNRCC at the KSRS is above 650 (!) for the DPRK5 as master and DPRK6 as slave. There is also an important observation that DPRK test correlates best between themselves and not so good with their aftershocks. In turn, the aftershocks have a clear cluster A_SHOCK3 to A_SHOCK5. Here we first time present the sixth aftershock, A_SHOCK6, which is obtained using five aftershocks as master events. The A_SHOCK6 better correlates with A_SHOCK1. One may interpret aftershock clustering as manifestation of their specific location and/or source mechanisms. Both stations demonstrate the same behavior.
- Varying all defining parameters we calculate largest SNRCC for all pairs of events (6 DPRK and 5 aftershocks). This slide presents these peak values as a color highlighted table for stations KSRS and USRK. Chiefly, the highest values are of the diagonal. But there are couple exclusions as well. This means that another event suppresses, in terms of CC level, pre-signal noise better than the slave event. In all cases, STA=0.1s, LTA=20s, and the most efficient CC length varies from 10 s to 150 s. The best frequency band, FB, also mainly depends on source type. The largest SNRCC at the KSRS is above 650 (!) for the DPRK5 as master and DPRK6 as slave. There is also an important observation that DPRK test correlates best between themselves and not so good with their aftershocks. In turn, the aftershocks have a clear cluster A_SHOCK3 to A_SHOCK5. Here we first time present the sixth aftershock, A_SHOCK6, which is obtained using five aftershocks as master events. The A_SHOCK6 better correlates with A_SHOCK1. One may interpret aftershock clustering as manifestation of their specific location and/or source mechanisms. Both stations demonstrate the same behavior.
- The sixth aftershocks is better characterized by a combined master event, when all available templates are used together as independent stations. The DPRK5 was selected as a reference event and all arrival time residuals related to varying template start times are reduced to the reference event, i.e. all templates from different master events must have 0 s time residual relative to the detection found by auto-correlation of the DPRK5. This approach can substantially suppress false arrivals, which may happen at lower threshold levels. When almost all templates ( the largest number is 12 or less – 6 DPRK and 6 aftershocks as at KSRS) at a given station detect the same arrival at close times one can trust such an arrival more that just to those obtained by only one template. The A_SHOCK6 is the smallest among all aftershocks, but has been found by all four stations and many (not all) templates. Standard detection based on one master event creates a weaker event hypothesis, which is also located at a larger distance. Overall, combined masters can provide: Lower detection threshold; More reliable solution; More reliable location; More accurate location. It is also important to stress that the SNRcc estimates (highlighted green) are much higher that standard SNR for the Pn-wave arrival highlighted red. This is the advantage of the WCC method. Together with higher SNRcc we obtain very accurate arrival time estimates, as the arrival time residual column demonstrates.
- The relative sizes of all aftershocks are better estimated using Lg amplitude scaling since Lg has the largest amplitude among all other regional phases generated by six aftershocks. Frequency dependent RMS amplitudes at KSRS and USRK are shown in two figures. Table lists logarithms of the RMS amplitude ratios with the A_SHOCK2 as a reference. For mb(A_SHOCK2) = 4.1, the A_SHOCK6 has magnitude mb=2.4. The A_SHOCK4 has mb=3.61 +-0.11 and the IDC mb in the REB is 3.4. Therefore, we can find as small events as mb=2.4 and even lower judging by the number of detecting templates and their SNRcc. We have carried out an extensive search for smaller events using the combined-master approach and found no more so far.
- The relative sizes of all aftershocks are better estimated using Lg amplitude scaling since Lg has the largest amplitude among all other regional phases generated by six aftershocks. Frequency dependent RMS amplitudes at KSRS and USRK are shown in two figures. Table lists logarithms of the RMS amplitude ratios with the A_SHOCK2 as a reference. For mb(A_SHOCK2) = 4.1, the A_SHOCK6 has magnitude mb=2.4. The A_SHOCK4 has mb=3.61 +-0.11 and the IDC mb in the REB is 3.4. Therefore, we can find as small events as mb=2.4 and even lower judging by the number of detecting templates and their SNRcc. We have carried out an extensive search for smaller events using the combined-master approach and found no more so far.
- The relative sizes of all aftershocks are better estimated using Lg amplitude scaling since Lg has the largest amplitude among all other regional phases generated by six aftershocks. Frequency dependent RMS amplitudes at KSRS and USRK are shown in two figures. Table lists logarithms of the RMS amplitude ratios with the A_SHOCK2 as a reference. For mb(A_SHOCK2) = 4.1, the A_SHOCK6 has magnitude mb=2.4. The A_SHOCK4 has mb=3.61 +-0.11 and the IDC mb in the REB is 3.4. Therefore, we can find as small events as mb=2.4 and even lower judging by the number of detecting templates and their SNRcc. We have carried out an extensive search for smaller events using the combined-master approach and found no more so far.
- The difference in cross correlation between and across explosions and aftershocks may have deep roots in the difference of corresponding source mechanisms. Formally, waveforms generated by small (point) sources with similar (delta-) time functions for P-waves (like DPRK1 and A_SHOCK2) should be similar but relative amplitudes of regional phases might be quite different and also might be azimuth depended due to source directivity. Also, the spectrum of S-waves may fall relatively faster for explosions than for earthquake-type sources. All these differences are reflected in the shapes of signals from explosions and aftershocks presented earlier as well as in spectral ratios of P and S waves. Here, we use Pg for P- and Lg for S-wave groups. Figures show frequency dependent P/S ratios as obtained at 4 stations from all available records. The explosion and aftershocks curves diverge with increasing frequency allowing usage of the P/S ratio as an effective and reliable discriminant.
- To better illustrate the difference we calculated, where possible, the mean and standard deviation values for two groups of sources and present here corresponding mean-value curves together the uncertainty estimates. Two cases are presented for KSRS and USRK.
- The deviation between the mean-value curves can be measured in standard deviations for each group separately and this gives an estimate of the probability of wrong interpretation of an explosion as aftershock and vice versa. This probability is extremely small judging by the range of the distance from 4 to 35 standard deviations.
- There are 3 stations having at least 5 estimates for explosions and aftershocks. This table present corresponding P/S ratios for all frequency band. We selected FB3 to FB5 to calculate the network-based (3 stations together) Mahalanobis distance between explosion and aftershocks. These values are highlighted red. For each FB, we get the M-distance between and across source types. The M-distance is calculated from a given source to the average explosion or aftershock.
- The result of M-distance calculation is shown here. The distances within groups are around 1 and between the groups are 1000 and more. These values imply effective network discrimination of the DPRK explosions and their aftershocks as sources of quite different types. Altogether, we have strong evidences in favour of earthquake-like aftershocks, which can also be split into smaller clusters likely related to different locations and effectiveness of P and S wave generation. This result cannot be directly extrapolated to discrimination of explosions and earthquakes in the broader regional context. Different sources are needed.