SlideShare a Scribd company logo
1 of 23
Download to read offline
Center for International Development
1
Harvard University
Implementing Debt Relief for the HIPCs
August 1999
1
Prof. Jeffrey Sachs, Dr. Kwesi Botchwey, Mr. Maciej Cuchra, Ms. Sara Sievers. We thank the
following students for excellent research assistance: Simona Bovha, Laura Serban, David Nicoll and
Frederick Antwi.
2
Executive Summary
The Cologne Initiative (hereafter CI) re-opens the international official discussion about the HIPC
(highly indebted poor country) debt crisis. Unfortunately, the CI leaves in place many of the serious flaws
of the original HIPC initiative of 1996. To a first approximation, the current debt servicing "system"
works as follows. Part of the debt service that is due is postponed, formally, or de facto as arrears. Of the
substantial debt service that is actually paid, some gets covered through new loans and the rest through
grants from bilateral donors. In the end, the HIPCs generally receive more than they pay, but the amounts
of net resource transfers are small, less that US$10 per person in 1997.
Even though the net resource transfers tend to be positive, the debt servicing system is
fundamentally flawed. First and most urgently, the net resource transfers are not large enough to enable
the HIPC governments to meet basic health and education needs of the population. Second, the bilateral
grants do not neatly offset the heavy burden of debt servicing, even if they appear to do so in formal
accounting. The debt burden falls heavily on the budget, and therefore on line ministries (such as the
ministry of health) while grants frequently finance extra-budgetary activities established by the donors.
Third, the process of offsetting heavy debt payments with grants and new loans is highly unstable and
erratic. There is no guarantee that new grants will fill the fiscal void left behind by the heavy debt
servicing; indeed sometimes there is a self-fulfilling collapse of fiscal resources. The instability,
unpredictability, and time-consuming nature of these rollover mechanisms contribute to the incapacity of
HIPC governments and the international community to formulate long-term solutions to the pressing
social crises in the HIPC countries.
While the new CI aims at more “ambitious” debt reduction targets than the 1996 HIPC Initiative,
the basic problem remains that the new standards are as arbitrary as the old ones. Both initiatives focus
mainly on the relationship of debt to exports, even though debt-to-export ratios have little if anything to
do with the real ability of governments to meet urgent social needs while servicing debts. An effective
process of HIPC debt relief should be grounded on the following principles: the unmet social needs of
most HIPC countries require significant net resource inflows; to achieve these increased inflows, it will be
necessary to cancel most or all old debts; to the extent possible, new inflows should be highly
concessional; debt relief should be guided by a process that helps to insure that the increased resource
transfers will be channeled into areas of urgent human need, especially in public health and primary
education.
3
Implementing Debt Relief for the HIPCs
The Cologne Initiative (hereafter CI) re-opens the international official discussion about
HIPC (highly indebted poor country) debt crisis.
2
Unfortunately, the CI leaves in place many of
the serious flaws of the original HIPC initiative of 1996. Neither the HIPC initiative, nor the CI,
have come to grips with three basic problems:
The debt is owed by impoverished governments, and therefore should be based on the HIPC
governments’ capacity to pay, not on arbitrary numerical guidelines related to exports, which
have little if anything to do with the countries' fiscal position or ability to pay;
Most HIPC governments have no capacity to repay debts in view of the urgent social crises
that they must confront. These governments are in fact in need of large net resource transfers
from the rest of the world;
Under current arrangements, debt service burdens are imperfectly offset via new loans,
grants, rescheduling and outright arrears. The instability, unpredictability, and time-
consuming nature of these rollover mechanisms contribute to the incapacity of HIPC
governments and the international community to formulate long-term solutions to the
pressing social crises in the HIPC countries.
While the new CI aims at more “ambitious” debt reduction targets than the 1996 HIPC
Initiative, the basic problem remains that the new standards are as arbitrary as the old ones.
3
Both initiatives focused mainly on the relationship of debt to exports, even though debt-to-export
ratios have little if anything to do with the real ability of governments to meet urgent social
needs while servicing debts. An effective process of HIPC debt relief should be grounded on the
following principles:
2
The HIPCs are a group of countries designated by the IMF and World Bank to be poor and highly
indebted. There were 41 countries on the original HIPC list. Subsequently, Nigeria was eliminated
(inappropriately in our view) and Malawi was added, keeping the list at 41. In our treatment of the issue,
we consider the HIPCs to include 42 countries (the original list plus Malawi). 34 of the 42 countries,
including 548 million of the 712 million HIPC population (77 percent), are in Sub-Saharan Africa.
3
The original HIPC initiative aimed to reduce the net present value of HIPC debts to 200-250 percent of anticipated
export earnings. The new initiative drops the target to 150 percent of exports, and adds a second criterion that the
NPV of debt should be no more than 250 percent of anticipated government revenues. The export-based ratios are
irrelevant to capacity to pay (the governments do not own the export revenues; nor does a debt-to-export ratio
address the tradeoffs between debt servicing and social spending). The new debt-to-government revenue target is an
improvement, but is numerically arbitrary and offers no way to assess the tradeoffs between urgent social spending
and debt servicing.
4
For most HIPC countries, the unmet social needs are so vast and urgent that these
countries will require significant net resource inflows for many years, larger than the net
inflows that they are now receiving.
To achieve these increased inflows, it will be necessary to cancel most or all old debts -- with
much greater relief than is envisioned in the CI -- and to sustain or increase the inflows of
new grants and loans.
To the extent possible, new inflows should be highly concessional, to avoid a repeat of the
current situation in which non-creditworthy countries were financed through commercial
loans rather than foreign assistance.
Debt relief should be guided by a process that helps to insure that the increased resource
transfers will be channeled into areas of urgent human need, especially in public health and
primary education. Such a process requires the leadership of key international organizations
with responsibility in these areas of urgent social need – especially the World Health
Organization, UNICEF, the United Nations Development Program, and the World Bank –
and with a diminished role of the International Monetary Fund.
The Capacity to Pay
Capacity to pay must be judged according to the alternative uses of funds claimed by debt
servicing. Many of the HIPC countries currently service their debts at the cost of widespread
malnutrition, premature death, excessive morbidity, and reduced prospects for economic growth.
If the resources were freed up and successfully redirected towards basic human needs, there
could be significant improvements in human welfare. For most countries in the world, other than
the HIPCs, debt payments do not compromise the basic human needs of the population. For
many of the HIPCs, by contrast, the most basic human needs are jeopardized by the continuation
of contractual debt servicing.
Take the case of Zambia, for example, which spent more than 30% of its national budget
on debt payments each year throughout the 1990s (Table 5), while spending roughly 10% on
basic social services. The Zambian Government’s annual health expenditures per person are
estimated to be US$ 17 dollars (Table 1), while the G7 governments spend around US$ 2,300 per
person in health care. In Zambia, 20% of the population is now HIV positive, and it is estimated
that around 9% of Zambian children under 15 have lost a mother or both parents to AIDS. Half
of all Zambians have no access to safe drinking water. Roughly 30% of children remain
unvaccinated. The infant mortality rate stands at 112 per 1000 births (compared to 5 in the
United States). Life expectancy has dropped to 43 years, and is expected to decline still further
as AIDS continues to take its toll.
Zambia is not alone in this shocking state of affairs, as we see from the figures in Tables
1, 2, and 3, where the data for selected HIPCs are presented. Looking first at the basic nutrition
levels, we see evidence of outright declines in caloric consumption in ten HIPC countries in
recent years. In nine Sub-Saharan African HIPCs, average caloric intake does not even reach
5
2,000 calories per day. During this same period, the average resident in the G7 countries
consumed roughly 3,300 calories per day. The data on protein consumption per capita are even
more dramatic: nearly half of HIPC countries showed outright declines in protein consumption
per capita in recent years. On average, individuals in HIPC countries consumed little more than
half of the protein per capita of G-7 residents. Average life expectancy at birth for all the HIPC
countries is just over 51 years; in the G-7, it is 78 years. Thirteen Sub-Saharan HIPC countries
showed declines in life expectancy during the 1990’s, partly due to the AIDS epidemic, which is
ravaging the continent.
The enormity of the AIDS epidemic in Africa could approach the scale of the Bubonic
Plague of 14
th
century Europe. In parts of Southern and East Africa, HIV infection rates are now
over 20% of the total population, including a third or more of the sexually active adult
population. In Germany, to take one comparison, the infection rate is estimated to be 0.08% of
the population, less than 1/200
th
of the prevalence in the hard-hit parts of Africa. AIDS claimed
an estimated 2 million deaths in Sub-Saharan Africa in 1998, a rate of 5,500 people per day, and
has left millions of children orphaned. Enterprises in many of the worst affected countries have
had to institute policies prohibiting employees from attending more than one funeral per week.
Firms are training three and four people for each job in anticipation of AIDS deaths, and have
often been forced to cut health care benefits entirely as costs have spiraled as a result of the
epidemic.
4
There is only a trickle of money spent on public health measures to limit the epidemic, or
to treat infected individuals. Total international assistance to developing countries is on the
order of US$ 300 million per year, or around US$ 7 per infected individual. While in the
advanced countries, medical advances have provided “drug cocktails” that postpone or prevent
the onset of AIDS in HIV-infected individuals, such treatments are orders of magnitude too
expensive in the poorest countries.
Money matters. Vaccination, drug therapies, doctor’s salaries, teachers’ salaries, basic
sanitation systems, and other underpinnings of basic human welfare cost real dollars. While the
average Frenchman or German has approximately US$ 2,500 devoted by the government to
public health, the astounding figures in Sub-Saharan Africa include: Kenya, US$8; Uganda
US$9, Cote D’Ivoire, US$25; Burkina Faso, US$54; and Ethiopia, US$3 (Table 1). The same
vast gap is evident in education spending (Table 4).
What, then, is the capacity of the HIPC countries to repay their debts while addressing
urgent human needs? In general, most have no debt-servicing capacity whatsoever. Indeed,
most of the HIPC countries receive more in grants and new loans than they paid in debt
servicing, as we will see below. In other words, the world has implicitly or explicitly recognized
that these countries cannot service their debts now or in the foreseeable future. We just hide that
fundamental reality in a complex shell game, in which large-scale debt servicing is very
imperfectly offset by debt postponements, arrears, new loans, and grants from donor
government. The shell game, however, is exhausting and debilitating. Virtually every HIPC
government spends an enormous amount of time simply staying one step ahead of outright
4
Taken from a combination of firm-level surveys conducted in 30 African countries, and press reports.
6
default, and many fail to do even that. In the meantime, there is little long-term thinking,
and less long-term planning to solve critical problems.
When the HIPC initiative was launched in 1996, there was some hope that social criteria
would be incorporated into the heart of the initiative. Such was not the case. Finance ministries
and the IMF/World Bank decided instead that debt-servicing capacity would be judged mainly
by comparing the net present value of debt with the level of exports. Debt relief aimed to reduce
the NPV of debt to between 200 and 250 percent of exports. These criteria neglected the obvious
fact that the debts were owed by governments, not exporters, and that ratio of debt to exports
could not conceivably measure the tradeoffs of debt servicing and meeting basic human needs.
The result has been a statistical standard bereft of economic and social logic.
At the Cologne Summit, the G-7 instructed the Bretton Woods institutions and other parts
of the international community to consider new ways of incorporating social priorities into their
programs. The first step should be to assess the real budgetary costs of meeting urgent social
needs – particularly in health and education -- and assessing the extent to which debt servicing
jeopardizes the budgetary capacity to meet those needs. Without such an analysis, the HIPC
Initiative will remain moribund, and impoverished governments will continue to make debt
service payments at the expense of the very lives of their citizens.
The Current Debt Quagmire
To a first approximation, the current debt servicing “system” works as follows. Part of
the debt service that is due is postponed, formally or de facto as arrears. Of the substantial debt
service that is actually paid, some gets covered through new loans and the rest through grants
from bilateral donors. In the end, the HIPCs generally receive more than they pay (in technical
terms, the net resource transfer is positive), but the amounts of net resource transfers are small
(less than US$10 per person in the HIPC countries in 1997), grossly insufficient in the face of the
social crises hitting these countries. The net resource transfers are also unstable and
unpredictable. As a general rule, the HIPCs make net resource transfers (that is, they pay more
in interest and amortization on old loans than they receive in new loans) to their bilateral
creditors, the IBRD (non-concessional World Bank lending window), the IMF, and private
creditors. They receive net resource transfers (more in loans and grants than paid in debt
service) from two main sources: IDA (the concessional World Bank lending window), and
bilateral donor grants.
Figure 1 shows the estimated net resource transfers vis-à-vis various creditors, for 1996
and 1997, for the HIPCs as a group. A negative indicates a net resource outflow from the HIPCs
(debt service in excess of new loans). Note that for all debts, the net resource transfer is negative
(more is paid in interest and amortization than is received in new loans). Grants, however, are
more than the negative net transfer on debts, so that the overall net resource transfer is positive
(grants plus loans exceeds interest plus amortization), though small in per capita terms and
declining over time.
Figure 2 shows the time path of net resource transfers in the 1990s. We see that in every
year, new loans (the lower part of the right hand side bar for each year) plus grants (the upper
7
part of the right hand side bar for each year) are greater than debt servicing (the left hand
side bar for each year). The net resource transfer from the rest of the world – equal to grants plus
new loans minus debt servicing -- is the dotted box. As just noted, these net resource transfers
have been declining over time, mainly because new loans have declined relative to debt
servicing, while grants have remained roughly unchanged in nominal terms. The result is that
overall annual net resource transfers have declined by US$ 3 - 4 billion in the past five years,
falling from around US$ 10 billion per year in the mid-1990s, to around US$ 6 billion per year in
1998.
Even though the net resource transfers tend to be positive, the debt servicing “system” is
fundamentally flawed. First, and most urgently, the net resource transfers are not large enough
to enable the HIPC governments to meet basic health and education needs of the population.
The negative net transfers on existing debt have gotten substantially larger in recent years, while
the grants extended to the HIPCs have remained roughly unchanged in nominal terms.
Second, and crucially, the bilateral grants to do not neatly offset the heavy burden of debt
servicing, even if they appear to do so in formal accounting. The debt burden falls heavily on the
budget, and therefore on line ministries (such as the health ministry) while grants frequently
finance extra-budgetary activities established by the donors. In fact, since the governments are
bankrupt, donors often attempt to establish these extra-budgetary programs precisely so that they
will not be drawn into the fiscal insolvency of the government. The result is profound de-
institutionalization of public activities, with a government that remains insolvent and illiquid,
and a bilateral donor process that supports non-governmental activities in lieu of an effective
state.
Third, the process of offsetting heavy debt payments with grants and new loans is highly
unstable and erratic. There is no guarantee that new grants will fill the fiscal void left behind by
the heavy debt servicing. Indeed, sometimes there is a self-fulfilling collapse of fiscal resources.
A “financing gap” opens up, causing the IMF to delay payments to a HIPC country. The IMF
decision in turn blocks the disbursement of funds by other major creditors, including the World
Bank and bilateral donors. The absence of such funds then dramatically worsens the budget
situation, “proving” that the IMF was right to suspend the program. A long period of default,
followed by difficult negotiations to restart lending, transpires. During this period, governments
services collapse, institutions such as hospitals or cold-chains for delivery of vaccines, break
down.
The Tables 5, 6 and 7 illustrate the significant volatility of resource transfers due to this
system of repaying old, non-payable debts through new loans and grants. Table 5 shows the
amount of debt servicing actually paid by the HIPC governments relative to government
revenues each year.
5
Table 6 shows the net transfers on debt actually paid, also as a percent of
government revenues. Table 7 shows the net resource transfers overall received by the HIPC
governments, taking into account grants received by the government. We see that debt servicing
is enormous (dozens of percent of tax revenues, and often well over 50% of the government
5
The data refers to general government, which means central government, plus regional and local governments, plus
parastatal enterprises where data is available (e.g. Bolivia); for other cases the government revenue does not include
revenue of the parastatal enterprises. Revenues include both tax and non-tax revenues. All data are from national
accounts published in the IMF country reports. See the Appendix for a detailed list of country sources.
8
revenues). It is also volatile. To take just one example, net resource transfers to Malawi fell
from 129% of revenue in 1995 to 48% of revenue in 1997, a remarkable change in 2-year period.
Table 6 show the net resource transfers paid on the debt is similarly erratic, and often very large
as a percent of government revenues. Table 7 shows that while HIPC governments indeed
receive overall net resource transfers (once account is taken of grants), these net resource flows
are also erratic and unpredictable.
A sound and stable fiscal policy would be possible only with a high degree of
predictability about the net transfers in future years. The wide fluctuations of the net transfers
that the HIPCs are currently exhibiting render consistent budgetary planning practically
impossible. The net flows are not only highly unstable, but also essentially unpredictable as they
depend on an outcome of a complex interplay between the vastly different profiles of debt flows
to different types of creditors, as well as on uncertain extraordinary revenues. Uncertainty,
volatility and instability, therefore, put the governments' finances in the state of a permanent
crisis where each fiscal period poses a dilemma about the portion of essential fiscal spending,
such as health care, education, or public infrastructure, that the governments will be able to
make. Finally, the vast discrepancy between the debt service obligations and the ordinary
government revenue, such as tax collections, make governments virtually insolvent the moment
the extraordinary transfers are suspended.
The result of constantly trying to cover up fiscal bankruptcy through new loans and
grants, therefore, results in the following main outcomes. First, there is a huge year-to-year
variation in debt servicing and net resource transfers. Second, a large proportion of government
time is spent merely staying out of default rather than investing in new long-term programs.
Third, a considerable and increasing amount of social spending is carried out by ad hoc
institutions backed by international grants, rather than by government ministries backed by
budgetary revenues. Thus, the system is promoting long-term institutional degradation of the
HIPC governments. Fourth, the net resource transfers are falling, and are inadequate to meet
basic human needs.
A Revised Program of HIPC Debt Relief
The revised HIPC program should re-establish the fiscal base for meeting the urgent
social needs confronting the HIPC countries. This should be done in the following ways.
For almost all HIPCs, we should recognize the need for significant, and increased, net
resource transfers for the foreseeable future, in order to help countries confront deep and
unmet social crises – ranging from HIV-AIDs, to holoendemic malaria, to massive
malnutrition, to unfulfilled immunization targets, to insufficient enrolments in primary
schools and very low school quality.
To bring about these increased net resource transfers, debt servicing on old debts should be
cancelled, while maintaining or increasing the flow of grants and loans. To the maximum
extent possible, new transfers should come in the form of grants and concessional loans
(ODA), rather than commercial loans.
9
Debts owed to bilateral creditors should be forgiven in their entirety in most cases, upon
demonstration of need, in the context of a process that aims to channel the budgetary saving
to urgent social needs.
Debts owed to the IBRD (non-concessional World Bank financing) should be forgiven as
well. The IDA program continues to make large net transfers to most HIPCs. IDA loans
need to be forgiven only in the unusual circumstances that IDA debt servicing is imposing
large net resource costs on a particular country, or is likely to do so in the next few years.
ESAF and standby loan repayments should be forgiven, as net repayments to the IMF
represent a growing burden on the HIPCs. It is arguable that ESAF as a whole should be
eliminated, as the IMF as an institution is more suited to short-run macroeconomic
management than to long-term development financing. In the estimates below, we assume
that once a HIPC has received a cancellation of old ESAF loans, that it does not borrow again
from ESAF (though perhaps some non-HIPC countries will continue to receive ESAF loans).
In cases where the private-sector debt is a substantial burden on economic development,
these private sector debts should be substantially forgiven as well. Public-sector creditors
would be right to insist upon pari passu (or nearly pari passu) treatment in those cases.
The bilateral creditors should coordinate their ODA to ensure that debt reduction is not offset
by declines in new loans and grants. In many cases, HIPC countries will require substantial
increases in net resource transfers in the years ahead, in order to succeed in meeting targets
for improvement in key social indicators.
If bilateral loans and grants remained unchanged, while debt servicing on public and
publicly guaranteed debts owed to the Paris Club, IBRD, and IMF, and other multilateral
creditors are forgiven, the result would be a sizeable increase in net resource transfers to the
HIPC countries, on the order of US$ 5 billion per year, and a substantial decrease in the long-
term debt stock, on the order of over 60% of the existing debt stock. Note, importantly, that the
calculations are for face value of debt, not the net present value (NPV), since NPV estimates by
class of creditor are not publicly available. Note also that in cases where the private sector debts
are also written down, the percent reduction would of course be larger. The tables 8 and 9 show
the potential savings for selected HIPCs based on the 1997 data if the above formula is adopted -
Table 8 presents the relief on the stock of the public and publicly guaranteed debt outstanding as
percentage of total long-term debt, and Table 9 presents the estimated savings on debt transfers
during that year.
Note that debt relief for the HIPC countries will almost surely not be sufficient, by itself,
to enable these countries to meet goals of improving basic conditions of public health and
education in the next few years. We stress again that debt relief will have two effects – increased
net resource transfers, and more realistic and long-term budgeting – but that these effects will
almost surely need to be augmented by increases in bilateral official development assistance to
those countries that are energetically undertaking expanded programs of social spending, as well
as much better targeting and design of social programs.
10
Financing the Debt Relief Program
One of the peculiar arguments concerning the HIPC initiative is that the rich countries
and multilateral institutions can not “afford” to forgive the HIPC debt. For most of the bilateral
creditors, a high proportion of the debt is already deemed to be uncollectable. In the United
States, for example, the roughly US$6 billion owed by the HIPCs is already held on official
accounts at around 10 percent of face value, or US$600 million. Under current procedures, the
U.S. Congress would have to appropriate only US$600 million to enable a complete write-off
and forgiveness of all of the HIPC debt owed to the United States.
In the case of the World Bank, we must consider mainly the IBRD claims. Regarding
IBRD claims, these totaled around US$4 billion in 1998, but are falling fast as a result of net
repayments. Outstanding IBRD claims may amount to no more than US$2 billion as of 1999.
These loans could be forgiven by the Bank with losses easily absorbed by loan loss reserves at
the Bank. The IBRD has already provisioned for some US$3.24 billion of loan losses. In
addition the World Bank has capital of at least US$27 billion. With respect to IDA loans, these
are backed by grants, not capital contributions to the Bank. IDA loans could be cancelled, if
necessary, without at all impairing IBRD capital. The only effect would be to reduce the size of
future IDA loans. As noted earlier, most countries will probably not need IDA relief in the next
few years.
In the case of the IMF, several methods could be used to reduce IMF claims, which
amount to roughly US$3.5 billion in NPV of ESAF loans, and another US$2.8 billion or so of
standby loans (the total was approx. US$7 billion in 1997). First, the IMF is sitting on massive
unrealized capital gains on its gold reserves, which could also be used to back debt write-offs on
the IMF balance sheet. Even without gold sales, these gold holdings could be revalued to
market prices, and the capital gain could be allocated partly to finance debt cancellation and
partly to augment the IMF various reserve accounts. In addition, the IMF maintains various
special accounts to absorb losses. The Reserve Account in the General Department of the IMF
has approximately 2.13 billion SDR (US$2.9 billion) which could be charged against debt write-
offs of standby loans. Similarly, the reserve account in the ESAF Trust Fund has approximately
US$2.82 billion, and the subsidy account also has reserves that could provide another US$2
billion or so that could be used against write-off of ESAF claims. Thus, some combination of
gold revaluation (and/or gold sales at market value) combined with the use of various reserve
funds available for adverse contingencies, could easily fund a complete write-off of IMF claims
on HIPC countries.
The more difficult case involves the African Development Bank. It is probably true that
a deep write-off of debts owed to the AfDB would impair the bank, and require some
recapitalization. The total value of such an infusion, however, would be modest. Informal
estimates by U.S. Government officials suggest that the overall recapitalization could amount to
a few billion dollars, to be shared among a large number of donor governments. If the U.S.
participated in such a recapitalization, the U.S. share might perhaps amount to a few hundred
million dollars.
11
Monitoring Debt Relief
The current international assistance strategy is based on a series of negotiations between
the indebted country and its major creditors: the bilateral donors, the IMF, the World Bank, and
the regional development banks. The IMF operates as primus inter pares among the
international institutions and donors. It alone judges whether a country’s budget is in
macroeconomic balance. When the IMF declares that a HIPC budget is out of balance, its
verdict generally stops much or all of the resource transfers to the country coming from bilateral
and other multilateral sources.
Under current aid arrangements, aid decisions – and decisions about how much debt
should be serviced – are taken with little attention to social needs. The IMF has no expertise to
deal with issues of public health, nutrition, immediate food security, the HIV-AIDS epidemic,
and other critical social issues in need of budgetary expenditure, as a recent external evaluation
of the ESAF correctly observed. When the IMF renders a decision on whether a government can
or cannot service a debt, it gives little if any attention to whether the health care system has
collapsed, whether children are being vaccinated, or whether the HIV-AIDS epidemic is being
attended to. This would be fine if the IMF were limited to its own immediate brief – monetary
stability – but, in fact, the IMF has a major if not decisive influence on the implementation of the
entire HIPC process although its net transfers to the HIPC countries are relatively small.
In the future, decisions over the extent of debt relief should be made in view of a detailed
assessment of real social needs. United Nations agencies that specialize in critical social areas
should play a decisive role in the process of assisting the HIPCs, working under the leadership of
the HIPC governments to prepare “social audits” that can be the basis for a revised and revived
strategy on meeting urgent social needs. Non-governmental organizations involved in social
services should also be encouraged to provide inputs to the deliberative process. The key U.N.
agencies would include the World Health Organization (WHO), the United Nations Children
Fund (UNICEF), the Joint United Nations Program on HIV-AIDS (UNAIDS), the World Food
Program (WFP), and the Food and Agricultural Organization (FAO).
The United Nations Development Program (UNDP) -- which is both the UN’s producer
of key social indicators in the Human Development Report (as well as human development
reports at the national level), as well as the agency charged with coordination of UN
development activities at the country level -- should play a leading role in coordinating the U.N.
efforts in preparing the social audits. The UNDP should work with the World Bank and the
International Monetary Fund to ensure that the social audits form the basis for actual debt relief
implementation and monitoring.
The debt reduction process itself could be based on a formal debt-reduction-cum-human
needs program presented by each HIPC government to a creditor committee, which would then
formally approve a timetable for debt cancellation in conjunction with enhanced efforts on the
social programs. The creditors, sitting as a committee, could formally vote on the proposed
program, so that no single institution or creditors would be the arbiter of the relief process. One
of the key aspects of any such program, of course, should be a multi-year commitment to meet
12
quantitative targets on basic human needs, such as immunization coverage, population
access to mother-and-child care, HIV incidence and prevalence, and primary school enrolment
rates. These quantified targets would not only be a guide to long-term budgeting and funding of
social programs, but would also provide a kind of conditionality for the international community
as well as the HIPC countries. Failures to meet specific quantified targets on health and
education would call into question the efficacy of the international policies applied to the HIPC
countries.
It is often asked whether debt relief will simply release countries from necessary
conditionality on future loans. In the case of the HIPCs, conditionality will be easily maintained
even after comprehensive debt relief. These countries need not only a cancellation of old debts,
but also a continued inflow of new resource flows. For that reason, bilateral and multilateral
donors will be in a position to insist upon real government performance in using international
funds, and will be in a continuing position to monitor the use of those funds – even to the point
of cutting them off if governments abusively misuse the international resources put at their
disposal.
Debt Relief within an Overall Economic Strategy
Social policy is but one aspect of overall development policy. Considerable research and
country case studies show that the single best long-term solution to crises of basic human needs
is long-term economic growth. Thus, we should not put aside the goals of long-term growth as
we turn our attention to enhanced social programs. A greatly enhanced social strategy and an
improved long-term growth strategy are surely complementary components of an overall
revision of development policies for the HIPC countries.
This note is not the place to elaborate an overall development strategy. Only a few
summary points can be noted, for elaboration elsewhere:
A successful growth strategy for a low-income country almost by nature must include a
component of export-led growth, especially export-led growth in manufactures such as
apparel and electronics assembly (at least to complement, if not soon supplant, the
dominance of natural resource commodity exports)
The rich countries and multinational institutions should redouble their efforts on the scientific
front, to work with researchers in the HIPC countries to improve agricultural technologies (in
part through the use of the new biotechnologies), and to find new approaches to public
health, especially related to the killer infectious diseases of HIV-AIDs, malaria, and TB.
The HIPC countries would generally benefit from greatly increased regional cooperation,
especially in Sub-Saharan Africa. Regional groupings such as SADC and ECOWAS have
several important roles to play in providing regional infrastructure; regional oversight of
national economic policies; and expanded trade through regional trade liberalization.
13
We are the first to acknowledge that debt relief by itself will be no solution to the long-
term development challenges facing the world’s poorest countries. Debt relief is a necessary
condition, but hardly sufficient. These countries need more than debt cancellation and
foreign aid in the coming years: they need real economic development to lift these societies
above the shocking level of poverty that they now endure. Debt relief will allow these
countries to make some headway on ensuring the survival and health of the next generation.
A healthy population, operating under a sound strategy of market-based economic
development, will have a much better opportunity to achieve sustained progress in economic
development and poverty reduction.
14
FIGURE 1
Source: Global Development Finance 1999 (electronic database); CID calculations.
Net Debt Transfers to HIPCs 1996-1997 by Category of a Creditor
(1,648)
(1,285)
2,746
(62)
236.5
(248)
(2,287) (2,299)
8,98
(1,096) (1,020)
2,496
219
600
(1,315)
(813)
(98.1)
(3,200)
-
3,200
6,400
9,600
Bilateral IBRD IDA Other
Multilateral
Exc. IMF
IMF Total Official Total Private Total NTR on
PPG
G
Creditors
US$millions
1996 1997
15
FIGURE 2
Net Transfers to HIPCs 1992-1997 Total PPG
10,362
10,639
10,774
9,359
6,701
7,094
-
5,000
10,000
15,000
20,000
1992 1992 1993 1993 1994 1994 1995 1995 1996 1996 1997
millionsUS$
Debt Service New Disbursments
Grants Net Transfer
Source: Global Development Finance 1999 (electronic database) and CID calculations.
16
TABLE 1
Health Expenditure % GDP and Per Capita
for Selected HIPCs and G7 Countries
Health
Expenditure,
public, % of GDP
Health
Expenditure per
capita, US$
Country / Year 1990-1997 1990-1997
Ethiopia 1.6 3
Nigeria 0.2 5
Chad 1.6 6
Ghana 2.9 6
Cameroon 1.0 7
Kenya 1.9 8
Mali 2.0 8
Uganda 1.9 9
Vietnam 1.1 9
Lao PDR 1.3 10
Togo 1.6 15
Zambia* 2.9 17
Burundi 1.0 18
Cote d'Ivoire 1.4 25
Mauritania 1.8 28
Honduras 2.8 33
Nicaragua 5.3 37
Republic of Yemen 1.3 39
Bolivia 3.8 54
Congo 1.8 77
Average 2.0 22
Canada 6.3 1,829
United States 6.6 4,093
Japan 5.7 2,442
UK 5.7 1,454
France 7.7 2,349
Germany 8.1 2,677
Italy 5.3 1,515
Average 6 2337
Averages for the period are for the years when data is available.
* Health expenditure as % of GDP for Zambia is for 1995 only.
Source: Human Development Report 1999
17
TABLE 2
Health Indicators for Selected HIPCs vis-a-vis G7 Countries
Social Indicator:
HIV Positive
Percentage
(adult rate)
Supply of calories
per day per capita
Grams of
proteins per day
per capita
Life expectancy at
birth, total (years)
Infant mortality rate
(per 1000 births)
Country: 1997 1997 1997 1997 1996 Year DPT %Measles %
Sierra Leone 3.2 2035 44 37.2 73 97 26 28
Rwanda 12.8 2056 46 40.5 74 97 77 66
Burundi 8.3 1685 51 42.4 106 96 63 50
Uganda 9.5 2085 45 42.5 78 97 58 60
Malawi 14.9 2043 54 42.8 134 97 95 87
Zambia 19.1 1970 52 43.1 112 97 70 69
Ethiopia 9.3 1858 54 43.3 70 97 63 52
Guinea-Bissau 2.3 2430 49 43.8 60 97 63 51
Burkina Faso 7.2 2121 62 44.4 82 97 70 68
Central African Republic 10.8 2016 44 44.9 103 96 53 46
Mozambique 14.2 1832 35 45.5 105 97 61 70
Angola 2.1 1903 41 46.5 170 97 41 78
Guinea 2.1 2231 48 46.5 132 97 53 56
Cote d'Ivoire 10.1 2610 50 46.7 90 97 70 68
Niger 1.5 2097 61 46.9 114 97 28 42
Liberia 3.7 2044 64 47.3 100 96 45 44
Tanzania 9.4 1995 49 47.9 88 97 74 69
Congo 7.8 2143 43 48.5 81 97 18 20
Chad 2.7 2032 59 48.6 92 97 24 30
Togo 8.5 2469 59 48.8 33 97 33 38
Mali 1.7 2029 61 50.4 124 97 52 56
Democratic Republic of Congo - 1755 28 50.7 111 97 18 20
Kenya 11.6 1973 52 52.0 102 97 36 32
Senegal 1.8 2418 61 52.3 125 97 65 65
Benin 2.1 2487 59 53.4 84 97 78 82
Mauritania 0.5 2622 74 53.5 133 97 28 20
Lao PDR 0.0 2108 52 53.5 157 97 60 67
Nigeria 4.1 2735 62 53.5 129 97 45 69
Republic of Yemen - 2051 54 54.3 50 97 57 51
Madagascar 0.1 2021 46 57.5 137 96 73 68
Ghana 2.4 2611 49 60.0 130 97 60 59
Sao Tome and Principe - 2138 44 64.0 164 97 73 60
Average for 32 HIPCs 6.3 2144 52 49 104 54 54
United States* N/A 3699 112 76 8 95 94 89
Canada* N/A 3119 98 79 7 94 93 98
Japan 0.01 2932 96 80 4 96 100 94
United Kingdom 0.09 3276 95 77 6 97 95 95
France 0.37 3518 101 78 5 97 97 83
Germany 0.08 3382 96 77 5 96 45 75
Italy 0.31 3507 109 78 6 97 60 75
Average for G7 0.17 3348 101 78 6 83 87
Source :
WHO
Epidemiological
Reports
WDI 1999
WHO Epidemiological
Reports / UN HD Report
1999 for US and
Canada (data for 1997)
* estimated % of population HIV positive (HIV Aids Surveillance Report 1998, CDC, US Department of Health and Human Services)
Data not available for U.S. and Canada.
FAOSTAT Nutrition Data/ Food
Balance Suppy database, July 1999
WHO Immunization Profiles
Percentage of Population
Immunized
18
TABLE 3
Social Indicators for Selected HIPCs* : Changes in 1990s
Supply of calories per day per capita Grams of proteins per day per capita Life Expectancy at Birth, (years)
1994 1997 Change 1994 1997 Change 1990 1997 Change
Burkina Faso 2395 2121 -274 Burkina Faso 71.4 62.1 -9.3 Zambia 49.1 43.1 -6.0
Mali 2270 2029 -241 Uganda 53.3 44.6 -8.7 Kenya 57.1 52.0 -5.1
Democratic Republic of Congo 1926 1755 -171 Senegal 66.9 61.4 -5.5 Uganda 46.8 42.5 -4.3
Uganda 2254 2085 -169 Mauritania 78.9 74.1 -4.8 Cote d'Ivoire 49.8 46.7 -3.1
Somalia 1635 1566 -69 Rwanda 49.8 46.1 -3.7 Central African Republic 47.6 44.9 -2.7
Cameroon 2140 2111 -29 Democratic Republic of Congo 31.7 28.1 -3.6 Tanzania 50.1 47.9 -2.1
Guinea-Bissau 2455 2430 -25 Sao Tome and Principe 47.3 44.0 -3.3 Malawi 44.6 42.8 -1.9
Sao Tome and Principe 2161 2138 -23 Mali 64.0 61.1 -2.9 Ethiopia 45.0 43.3 -1.7
Tanzania 2016 1995 -21 Cameroon 50.1 47.9 -2.2 Togo 50.5 48.8 -1.7
Burundi 1690 1685 -5 Burundi 52.2 50.6 -1.6 Burundi 43.6 42.4 -1.2
Sierra Leone 2034 2035 1 Nicaragua 50.4 48.9 -1.5 Burkina Faso 45.4 44.4 -1.0
Zambia 1967 1970 3 Congo 44.2 43.1 -1.1 Congo 49.5 48.5 -1.0
Congo 2133 2143 10 Sierra Leone 44.6 43.5 -1.1 Democratic Republic of Congo 51.5 50.7 -0.8
Guinea 2219 2231 12 Somalia 53.9 52.8 -1.1 Rwanda 40.2 40.5 0.3
Nigeria 2719 2735 16 Republic of Yemen 55.4 54.4 -1.0 Angola 45.5 46.5 1.0
Madagascar 1999 2021 22 Ghana 50.0 49.2 -0.8 Guinea-Bissau 42.3 43.8 1.5
Kenya 1947 1973 26 Madagascar 47.0 46.3 -0.7 Niger 45.5 46.9 1.5
Myanmar 2824 2862 38 Guinea 48.3 47.6 -0.7 Benin 51.9 53.4 1.5
Republic of Yemen 2013 2051 38 Bolivia 56.6 56.5 -0.1 Vietnam 66.6 68.2 1.6
Bolivia 2129 2174 45 Kenya 52.0 52.0 0.0 Guyana 62.7 64.4 1.7
Nicaragua 2140 2186 46 Guinea-Bissau 48.6 48.7 0.1 Sao Tome and Principe 62.2 64.0 1.8
School Enrollment, secondary, gross (%)
1990 1994 Change 1990 1997 Change
Sudan 24 14.4 -9.6 Guinea-Bissau 145.0220.0 75.0
Guyana 83.4 76.5 -6.9 Burkina Faso 105.4169.0 63.6
Ethiopia 14.2 11.1 -3.1 Kenya 61.8 74.0 12.2
Madagascar 18 15.5 -2.5 Zambia 107.3113.0 5.7
Uganda 13.2 11.7 -1.5 Congo 88.2 90.0 1.8
Cameroon 28 26.9 -1.1 Burundi 118.8119.0 0.2
Mozambique 7.6 6.7 -0.9 Malawi 135.4132.5 -2.9
Senegal 16.2 16 -0.2 Democratic Republic of Congo 95.8 92.0 -3.8
Niger 6.6 6.5 -0.1 Senegal 74.0 70.0 -4.0
Tanzania 4.9 5.3 0.4 Central African Republic 102.2 98.0 -4.2
Kenya 24.1 24.8 0.7 Angola 130.2125.0 -5.2
Cote d'Ivoire 22 22.8 0.8 Uganda 104.4 99.0 -5.4
Burundi 5.6 6.5 0.9 Guyana 63.8 58.0 -5.8
Chad 7.8 8.9 1.1 Togo 92.4 86.0 -6.4
Togo 23.6 25.1 1.5 Cote d'Ivoire 95.0 87.0 -8.0
Mauritania 13.7 15.3 1.6 Nigeria 85.2 77.0 -8.2
Guinea 10 11.7 1.7 Rwanda 132.4124.0 -8.4
Congo 52.9 55.3 2.4 Madagascar 103.0 94.0 -9.0
Benin 11.9 15 3.1 Lao PDR 108.2 98.0 -10.2
Mali 6.5 9.6 3.1 Niger 128.4118.0 -10.4
Zambia 24.1 27.4 3.3 Sao Tome and Principe 60.9 50.0 -10.9
Infant Mortality Rate (per 1,000 live births)
Source: WHO Epidemiological Report. World Development Indicators 1999,
FAOSTAT Nutrition Data, WHO Immunization Profiles, CID calculations.
* The countries included in these tables are generally those which face the most severe deterioration in
the delivery of social services in the 1990’s, rather than a representative sampling of the HIPC countries
as a whole.
19
TABLE 4
Public Spending on Education: Nominal Values and % of GDP in 1990s
Comparison of Selected HIPCs with G7 Countries
Public Spending on
education as % of GNP
Public spending on education
(million US$)
Public spending on education per capita,
age group 5-14 (US$)
Country / Year 1995 1995 1995
Cote-d'Ivoire 5.2 468 240
Nigeria 0.9 233 9
Congo 6.2 106 152
Nicaragua 3.7 57 46
Malawi 5.5 78 29
Senegal 3.6 156 68
Burkina-Faso 1.4 33 11
Zambia 2.2 72 29
Mauritania 5.1 52 82
Kenya 6.8 591 73
Ethiopia 4.0 229 15
Honduras 3.6 142 92
Uganda 2.6 148 27
Burundi 4.1 40 47
Lao P.D.R. 2.3 41 32
Guyana 4.3 23 130
Bolivia 6.6 429 230
Average 4.0 170 77
Public spending on
education (as % of GNP)
Public spending on education
(million US$)
Public spending on education per capita,
age group 5-14 (US$)
Country / Year 1996 1996 1996
Canada 7.0 39865 9877
United States 5.4 401409 10181
Japan 3.6 185371 13578
UK 5.4 62213 8242
France 6.1 93550 12230
Germany 4.8 113501 12333
Italy 4.7 53604 9466
Average 5.3 135645 10844
Data for selected HIPCs from WDI 1999 database.
Data on public spending on education as % of GNP in 1996 for G7 countries: HDR 1999
Data on GNP (at market prices, in current US $) : WDI 1999 database for selected HIPCs & WDI hardcopy for the G7 countries.
Data on population 5-14 : UN / Population Division / Sex and Age Annual 1950-2050 (1998 Revision) electronic database
20
TABLE 5
1992 1993 1994 1995 1996 1997 St deviation
Angola -5% -2% -5% -27% -27% -29% 13%
Guinea -21% -22% -27% -43% -28% -35% 8%
Guinea-Bissau -26% -14% -24% -46% -32% -22% 11%
Guyana -73% -53% -56% -52% -42% 11%
Honduras -57% -55% -71% -69% -75% -50% 10%
Madagascar -34% -26% -26% -21% -23% -62% 15%
Malawi -27% -20% -30% -39% -21% -19% 8%
Mali -15% -21% -35% -24% -27% -19% 7%
Mauritania -34% -54% -43% -44% -35% -36% 8%
Mozambique -28% -41% -47% -58% -44% -24% 13%
Nicaragua -16% -24% -41% -53% -38% -49% 14%
Niger -11% -35% -36% -19% -18% 11%
Sao Tome and Principe -24% -21% -37% -24% -48% -86% 25%
Senegal -16% -11% -39% -36% -36% -30% 11%
Tanzania -42% -35% -27% -28% -27% -15% 9%
Uganda -66% -65% -40% -25% -24% -28% 20%
Zambia -58% -69% -55% -379% -36% -33% 135%
Average -33%-33%-38% -58%-34%-36%
Debt Servicing Actually Paid as % of Total Government Revenue
TABLE 6
1992 1993 1994 1995 1996 1997 St Deviation
Benin 21% 26% 47% 22% 25% 2% 14%
Burkina Faso 32% 33% 44% 34% 21% 13% 11%
Burundi 48% 25% 7% 4% 3% -8% 20%
Central African Republic 25% 43% 60% 18% 23% -8% 23%
Chad 117% 48%127% 68% 91% 57% 32%
Equatorial Guinea 34% 37% 23% 1% -5% 19%
Ethiopia 21% 40% 14% 7% -2% 16%
Guinea 32% 56% 25% 7% 8% 27% 18%
Guinea-Bissau 143% 80% 73% 27% 61% 66% 38%
Guyana -13% -6% -29%-24% 2% 13%
Honduras 17% 38% -14%-24%-27% 19% 27%
Kenya -3% -6% -20% -1% -9% 8%
Lao PDR 34% 31% 21% 32% 68% 40% 16%
Madagascar 9% 16% 8% 13% 22% 36% 11%
Mali 32% 6% 31% 43% 17% 18% 13%
Mauritania 26% 24% 26% 9% 19%-0.1% 11%
Mozambique 71% 26% 52% 28% 54% 50% 17%
Nicaragua 42% -4% 35%-0.5% 4% -21% 24%
Niger 30% 27% 58% 2% 18% 20%
Sao Tome and Principe 248%156%195%169%141% -15% 88%
Tanzania 45% 7% 13% 5% -2% 18% 16%
Togo 8% -4% 30% 17% 19% 13%
Uganda 123%108% 47% 28% 24% 23% 45%
Average 50%35%38%21%25%19%
Net Transfers on Debt Actually Paid as % of Total Government Revenue
For footnotes see Table 7.
21
TABLE 7
1992 1993 1994 1995 1996 1997 St Deviation
Angola 17% 19% 12% 31% -13%-15% 19%
Benin 84% 74% 103% 72% 62% 42% 21%
Burkina Faso 91% 97% 148% 121% 97% 79% 25%
Burundi 130% 93% 153% 133% 121% 69% 30%
Central African Republic 98% 133% 213% 121% 205% 85% 54%
Chad 211% 151% 326% 203% 204%143% 66%
Cote d'Ivoire 7% 11% 66% 20% 9%-15% 27%
Equatorial Guinea 103% 82% 74% 57% 35% 26%
Ethiopia 99% 112% 74% 50% 31% 34%
Ghana 53% 50% 34% 34% 23% 20% 14%
Guinea 87% 101% 71% 65% 46% 55% 20%
Guinea-Bissau 254% 208% 242% 186% 223%189% 28%
Lao PDR 73% 69% 64% 81% 125% 88% 22%
Madagascar 84% 84% 77% 75% 81%200% 49%
Malawi 106% 87% 118% 129% 78% 48% 29%
Mali 85% 53% 119% 102% 68% 73% 24%
Mauritania 70% 99% 80% 62% 74% 53% 16%
Mozambique 348% 252% 304% 316% 205%178% 67%
Nicaragua 118% 38% 72% 78% 119% 13% 42%
Niger 133% 149% 326% 127% 121% 87%
Sao Tome and Principe 498% 386% 540% 494% 435%214% 118%
Senegal 42% 39% 86% 48% 36% 35% 19%
Tanzania 171% 139% 100% 63% 43% 61% 50%
Togo 47% 37% 92% 80% 53% 23%
Uganda 328% 218% 133% 102% 80% 74% 99%
Zambia 95% 78% 35% 48% 37% 36% 25%
Average 132%110%141%111%100%78%
Net Resource Transfers as % of Total Government Revenue
Sources (Tables 5, 6 and 7) : Global Development Finance 1999, IMF Country Reports
- National Accounts, and CID calculations; further details on the governments' revenue
calculations and a detailed list of sources available from CID.
22
TABLE 8
HIPC Country
IMF
Outstanding
Debt (IMF
Credit)
IBRD
Outstanding
Debt
Bilateral
Outstanding
Debt
Regional Development
Banks and Other
Multilateral
Organizations
Outstanding Debt Total Relief
Total Long-Term Debt
Outstanding (including
Private Creditors and
IMF Credit)
Total Relief as %
of Total Long-
Term Debt
Outstanding
Angola 0 0 2658 98 2755 8885 31%
Benin 95 0 519 361 975 1488 66%
Bolivia 248 37 1421 1714 3420 4818 71%
Burkina Faso 92 0 132 367 592 1231 48%
Burundi 28 0 149 306 482 1050 46%
Cameroon 93 410 5644 445 6592 7979 83%
Central African Republic 19 0 183 204 406 822 49%
Chad 61 0 173 292 526 1000 53%
Congo 34 73 2832 382 3321 4317 77%
Cote d'Ivoire 450 1044 4605 1157 7256 12948 56%
Democratic Republic of Congo 407 82 5604 872 6965 9023 77%
Equatorial Guinea 13 0 101 44 158 222 71%
Ethiopia 87 0 6613 928 7627 9513 80%
Ghana 347 30 1075 532 1984 5305 37%
Guinea 99 0 1380 635 2114 3107 68%
Guinea-Bissau 12 0 451 166 629 851 74%
Guyana 157 19 623 428 1228 1502 82%
Honduras 46 275 1368 1532 3221 4215 76%
Kenya 250 213 1860 540 2863 5683 50%
Lao PDR 66 0 1431 458 1955 2313 85%
Liberia 305 136 465 167 1072 1366 78%
Madagascar 69 3 2166 447 2684 3941 68%
Malawi 106 34 261 382 782 2179 36%
Mali 176 0 1234 514 1924 2863 67%
Mauritania 113 6 1075 560 1753 2150 82%
Mozambique 189 0 3786 466 4441 5664 78%
Myanmar 0 0 3017 447 3464 4640 75%
Nicaragua 27 24 2854 1179 4084 4846 84%
Niger 61 0 450 256 767 1488 52%
Nigeria 0 2373 12998 1230 16602 22926 72%
Republic of Yemen 250 0 1191 456 1898 3668 52%
Rwanda 40 0 142 292 475 1034 46%
Sao Tome and Principe 0 0 71 98 170 227 75%
Senegal 292 14 1297 602 2205 3457 64%
Sierra Leone 167 2 393 222 784 1060 74%
Somalia 151 0 1095 317 1563 2004 78%
Sudan 797 6 5521 797 7120 10291 69%
Tanzania 246 34 2866 600 3746 6340 59%
Togo 88 0 491 156 734 1295 57%
Uganda 394 0 727 445 1566 3596 44%
Vietnam 452 0 13274 259 13986 19291 72%
Zambia 1138 62 2864 672 4736 6383 74%
Total 7663 4877 97058 22024 131622 196979 65%
Cancellation of Outstanding Old Debts from IMF, IBRD, Bilateral Creditors and Regional Development Banks
All amounts in millions US$.
Source: CID calculations; Global Development Finance 1999.
23
TABLE 9
Country:
IBRD Debt
Service and
New
Lending*
IMF Debt
Service and
New Lending*
Bilateral
Creditors
Debt
Service**
Regional Development
Banks and Other
Multilateral Organizations
Debt Service**
Total Savings
on Public and
Publicly
Guaranteed
Debt
Old
Transfers on
Debt Before
Relief
New
Transfers
on Debt
After Relief
Angola 0 0 80 1 81 -713 -632
Benin 0 -1 18 21 37 6 43
Bolivia 24 12 59 218 313 49 362
Burkina Faso 0 -16 9 29 22 40 62
Burundi 0 8 0 12 20 -10 10
Cameroon 107 -23 146 132 362 -156 206
Central African Republic 0 8 0 1 9 -6 3
Chad 0 1 6 11 18 57 75
Congo 5 2 19 69 95 -72 23
Cote d'Ivoire 245 25 168 176 614 -635 -20
Democratic Republic of Congo 0 0 0 0 0 0 0
Equatorial Guinea 0 3 0 1 4 -3 2
Ethiopia 0 0 11 49 60 81 141
Ghana 15 171 61 46 293 76 368
Guinea 0 -22 33 49 60 118 178
Guinea-Bissau 0 -5 2 3 0 27 27
Guyana 7 2 56 35 100 -43 57
Honduras 73 9 106 141 329 149 477
Kenya 97 69 149 52 367 -336 31
Lao PDR 0 -3 12 7 16 115 131
Madagascar 4 -1 84 85 172 123 295
Malawi 8 8 14 15 45 76 121
Mali 0 -21 27 27 33 71 104
Mauritania 2 -11 36 51 78 -1 77
Mozambique 0 -19 47 23 51 197 248
Myanmar 0 0 45 15 60 76 136
Nicaragua 20 0 144 116 280 -135 146
Niger 0 -11 5 12 6 69 75
Nigeria 341 0 200 224 765 -1047 -282
Republic of Yemen*** 0 -140 6 64 -70 200 131
Rwanda*** 0 -17 2 5 -10 72 62
Sao Tome and Principe 0 0 2 3 5 -1 4
Senegal 9 17 89 48 163 34 197
Sierra Leone 0 -6 13 4 10 32 43
Sudan 0 57 0 0 58 -53 5
Tanzania 24 -53 6 44 22 186 208
Togo 0 -3 11 15 23 17 39
Uganda 0 0 76 28 104 156 260
Vietnam 0 63 255 8 326 338 664
Zambia 41 -8 91 66 189 30 220
Total Savings 1021 98 2086 1905 5110 -813 4298
Savings on the Cancellation of Outstanding Old Debts from IMF, IBRD, Bilateral Creditors & Regional Development Banks, and Phasing
Out New Lending from IMF and IBRD
Source: CID calculations; Global Development Finance. All amounts in millions US$.
* For the IMF and the IBRD loans the savings represent the total debt service (interest and amortization payments) and the new
lending during the year (total debt transfers)
** For the Bilateral Creditors and the Regional Development Banks and Other Multilateral Organizations Debt loans the savings
represent the total debt service (interest and amortization payments) only. The second category excludes the World Bank and the
IMF, which are accounted for separately.
*** For the Republic of Yemen and Rwanda the savings are negative because both countries paid little or no interest on bilateral
and IBRD loans and had positive net transfers on debt from the IMF in 1997.

More Related Content

What's hot

Poverty: Canada - Why there is no easy fix for Poverty
Poverty: Canada - Why there is no easy fix for PovertyPoverty: Canada - Why there is no easy fix for Poverty
Poverty: Canada - Why there is no easy fix for Povertypaul young cpa, cga
 
Article in Sunday Sun - January 8, 2017 - Social Security under Pressure
Article in Sunday Sun - January 8, 2017 - Social Security under PressureArticle in Sunday Sun - January 8, 2017 - Social Security under Pressure
Article in Sunday Sun - January 8, 2017 - Social Security under PressureSAMDOR Services Limited
 
Engaging Communities For Economic Linked In
Engaging Communities For Economic Linked InEngaging Communities For Economic Linked In
Engaging Communities For Economic Linked InMBEDC, LLC
 
EFFECT OF NON BANK FINANCIAL INSTITUTIONS CREDIT ON POVERTY
EFFECT OF NON BANK FINANCIAL INSTITUTIONS CREDIT ON POVERTYEFFECT OF NON BANK FINANCIAL INSTITUTIONS CREDIT ON POVERTY
EFFECT OF NON BANK FINANCIAL INSTITUTIONS CREDIT ON POVERTYMoses Mutharime Mwito
 
Public external debt, capital formation and economic growth in ethiopia
Public external debt, capital formation and economic growth in ethiopiaPublic external debt, capital formation and economic growth in ethiopia
Public external debt, capital formation and economic growth in ethiopiaAlexander Decker
 
What is the international debt crisis
What is the international debt crisisWhat is the international debt crisis
What is the international debt crisisrealsam
 
Fiscal Austerity & the Federal System (Paul Posner, 2013 ABFM Conf)
Fiscal Austerity & the Federal System (Paul Posner, 2013 ABFM Conf)Fiscal Austerity & the Federal System (Paul Posner, 2013 ABFM Conf)
Fiscal Austerity & the Federal System (Paul Posner, 2013 ABFM Conf)PublicFinanceTV
 
National Debt and How to Deal With It
National Debt and How to Deal With ItNational Debt and How to Deal With It
National Debt and How to Deal With ItLuke Rzepiennik
 
The global debt crisis
The global debt crisisThe global debt crisis
The global debt crisisSneha Malhotra
 
Why the portuguese public debt is not payable
Why the portuguese public debt is not payableWhy the portuguese public debt is not payable
Why the portuguese public debt is not payableGRAZIA TANTA
 
Income and Wealth Inequality in the United States
Income and Wealth Inequality in the United StatesIncome and Wealth Inequality in the United States
Income and Wealth Inequality in the United StatesDavid Doney
 
Megacommunities and The African Diaspora
Megacommunities and The African DiasporaMegacommunities and The African Diaspora
Megacommunities and The African DiasporaMo Richards MSIPM
 
Remittances to the Gambia
Remittances to the GambiaRemittances to the Gambia
Remittances to the GambiaKwaku Adu
 
Crossing the United States Policy Void
Crossing the United States Policy VoidCrossing the United States Policy Void
Crossing the United States Policy VoidBen Esget
 
Solace_Local_Roots_to_Growth
Solace_Local_Roots_to_GrowthSolace_Local_Roots_to_Growth
Solace_Local_Roots_to_GrowthHenry Hall
 

What's hot (20)

Poverty: Canada - Why there is no easy fix for Poverty
Poverty: Canada - Why there is no easy fix for PovertyPoverty: Canada - Why there is no easy fix for Poverty
Poverty: Canada - Why there is no easy fix for Poverty
 
Article in Sunday Sun - January 8, 2017 - Social Security under Pressure
Article in Sunday Sun - January 8, 2017 - Social Security under PressureArticle in Sunday Sun - January 8, 2017 - Social Security under Pressure
Article in Sunday Sun - January 8, 2017 - Social Security under Pressure
 
Engaging Communities For Economic Linked In
Engaging Communities For Economic Linked InEngaging Communities For Economic Linked In
Engaging Communities For Economic Linked In
 
EFFECT OF NON BANK FINANCIAL INSTITUTIONS CREDIT ON POVERTY
EFFECT OF NON BANK FINANCIAL INSTITUTIONS CREDIT ON POVERTYEFFECT OF NON BANK FINANCIAL INSTITUTIONS CREDIT ON POVERTY
EFFECT OF NON BANK FINANCIAL INSTITUTIONS CREDIT ON POVERTY
 
Public external debt, capital formation and economic growth in ethiopia
Public external debt, capital formation and economic growth in ethiopiaPublic external debt, capital formation and economic growth in ethiopia
Public external debt, capital formation and economic growth in ethiopia
 
Dp 2015 59
Dp 2015 59Dp 2015 59
Dp 2015 59
 
What is the international debt crisis
What is the international debt crisisWhat is the international debt crisis
What is the international debt crisis
 
International debt problem
International debt problemInternational debt problem
International debt problem
 
Best Practices for Funding Retirement & Benefits
Best Practices for Funding Retirement & BenefitsBest Practices for Funding Retirement & Benefits
Best Practices for Funding Retirement & Benefits
 
Fiscal Austerity & the Federal System (Paul Posner, 2013 ABFM Conf)
Fiscal Austerity & the Federal System (Paul Posner, 2013 ABFM Conf)Fiscal Austerity & the Federal System (Paul Posner, 2013 ABFM Conf)
Fiscal Austerity & the Federal System (Paul Posner, 2013 ABFM Conf)
 
National Debt and How to Deal With It
National Debt and How to Deal With ItNational Debt and How to Deal With It
National Debt and How to Deal With It
 
The global debt crisis
The global debt crisisThe global debt crisis
The global debt crisis
 
Why the portuguese public debt is not payable
Why the portuguese public debt is not payableWhy the portuguese public debt is not payable
Why the portuguese public debt is not payable
 
Income and Wealth Inequality in the United States
Income and Wealth Inequality in the United StatesIncome and Wealth Inequality in the United States
Income and Wealth Inequality in the United States
 
AGA Article 6 -2013
AGA Article 6 -2013AGA Article 6 -2013
AGA Article 6 -2013
 
Megacommunities and The African Diaspora
Megacommunities and The African DiasporaMegacommunities and The African Diaspora
Megacommunities and The African Diaspora
 
Remittances to the Gambia
Remittances to the GambiaRemittances to the Gambia
Remittances to the Gambia
 
3rd world debt
3rd world debt3rd world debt
3rd world debt
 
Crossing the United States Policy Void
Crossing the United States Policy VoidCrossing the United States Policy Void
Crossing the United States Policy Void
 
Solace_Local_Roots_to_Growth
Solace_Local_Roots_to_GrowthSolace_Local_Roots_to_Growth
Solace_Local_Roots_to_Growth
 

Similar to Center for international development

Debt relief and public health spending
Debt relief and public health spendingDebt relief and public health spending
Debt relief and public health spendingitargeting
 
Analysis On The Result And Implication Of The Policy
Analysis On The Result And Implication Of The PolicyAnalysis On The Result And Implication Of The Policy
Analysis On The Result And Implication Of The PolicyCrystal Torres
 
Tackling tax and_saving_lives1
Tackling tax and_saving_lives1Tackling tax and_saving_lives1
Tackling tax and_saving_lives1Dr Lendy Spires
 
Banking on Change - Breaking the Barriers to Financial Inclusion
Banking on Change - Breaking the Barriers to Financial InclusionBanking on Change - Breaking the Barriers to Financial Inclusion
Banking on Change - Breaking the Barriers to Financial InclusionDr Lendy Spires
 
The multilateral debt relief initiative
The multilateral debt relief initiativeThe multilateral debt relief initiative
The multilateral debt relief initiativeitargeting
 
Post covid ecnomic condition ways to recover from covid-19 pandemic recession
Post covid ecnomic condition   ways to recover from covid-19 pandemic recessionPost covid ecnomic condition   ways to recover from covid-19 pandemic recession
Post covid ecnomic condition ways to recover from covid-19 pandemic recessionShimanta Easin
 
Macroeconomic Developments in Low-Income Developing Countries
Macroeconomic Developments in Low-Income Developing CountriesMacroeconomic Developments in Low-Income Developing Countries
Macroeconomic Developments in Low-Income Developing CountriesDr Lendy Spires
 
ICAI-Review-The-effects-of-DFID’s-cash-transfer-programmes-on-poverty-and-vul...
ICAI-Review-The-effects-of-DFID’s-cash-transfer-programmes-on-poverty-and-vul...ICAI-Review-The-effects-of-DFID’s-cash-transfer-programmes-on-poverty-and-vul...
ICAI-Review-The-effects-of-DFID’s-cash-transfer-programmes-on-poverty-and-vul...Mike Brewin
 
Stocktaking of SDGs and Post2015 Development Agenda Demanding Development jus...
Stocktaking of SDGs and Post2015 Development Agenda Demanding Development jus...Stocktaking of SDGs and Post2015 Development Agenda Demanding Development jus...
Stocktaking of SDGs and Post2015 Development Agenda Demanding Development jus...Dr Lendy Spires
 
Conditional Cash Transfers in Latin America– achievement and challenges
Conditional Cash Transfers in Latin America– achievement and challengesConditional Cash Transfers in Latin America– achievement and challenges
Conditional Cash Transfers in Latin America– achievement and challengesUNDP Policy Centre
 
Debt relief, climate and nature in COVID-19 recovery
Debt relief, climate and nature in COVID-19 recoveryDebt relief, climate and nature in COVID-19 recovery
Debt relief, climate and nature in COVID-19 recoveryIIED
 
Wef gac poverty_sustainabledevelopment_globaldevelopmentfinance_paper_2014
Wef gac poverty_sustainabledevelopment_globaldevelopmentfinance_paper_2014Wef gac poverty_sustainabledevelopment_globaldevelopmentfinance_paper_2014
Wef gac poverty_sustainabledevelopment_globaldevelopmentfinance_paper_2014Dr Lendy Spires
 
PAYING FOR ZERO: Global Development Finance and the Post-2015 Agenda
 PAYING FOR ZERO: Global Development Finance and the Post-2015 Agenda PAYING FOR ZERO: Global Development Finance and the Post-2015 Agenda
PAYING FOR ZERO: Global Development Finance and the Post-2015 AgendaDr Lendy Spires
 
The real effects of debt bis
The real effects of debt bisThe real effects of debt bis
The real effects of debt bisneiracar
 
Where's the money going
Where's the money going Where's the money going
Where's the money going TariqCarrimjee
 
Credit demand and_rationing_in_uganda_okurut
Credit demand and_rationing_in_uganda_okurutCredit demand and_rationing_in_uganda_okurut
Credit demand and_rationing_in_uganda_okurutDr Lendy Spires
 
The four dimensions of public financial management
The four dimensions of public financial managementThe four dimensions of public financial management
The four dimensions of public financial managementicgfmconference
 
East europe's demographic problems
East europe's demographic problemsEast europe's demographic problems
East europe's demographic problemsEdward Hugh
 

Similar to Center for international development (20)

Debt relief and public health spending
Debt relief and public health spendingDebt relief and public health spending
Debt relief and public health spending
 
Analysis On The Result And Implication Of The Policy
Analysis On The Result And Implication Of The PolicyAnalysis On The Result And Implication Of The Policy
Analysis On The Result And Implication Of The Policy
 
Tackling tax and_saving_lives1
Tackling tax and_saving_lives1Tackling tax and_saving_lives1
Tackling tax and_saving_lives1
 
Banking on Change - Breaking the Barriers to Financial Inclusion
Banking on Change - Breaking the Barriers to Financial InclusionBanking on Change - Breaking the Barriers to Financial Inclusion
Banking on Change - Breaking the Barriers to Financial Inclusion
 
Banking on-change
Banking on-changeBanking on-change
Banking on-change
 
The multilateral debt relief initiative
The multilateral debt relief initiativeThe multilateral debt relief initiative
The multilateral debt relief initiative
 
Post covid ecnomic condition ways to recover from covid-19 pandemic recession
Post covid ecnomic condition   ways to recover from covid-19 pandemic recessionPost covid ecnomic condition   ways to recover from covid-19 pandemic recession
Post covid ecnomic condition ways to recover from covid-19 pandemic recession
 
Macroeconomic Developments in Low-Income Developing Countries
Macroeconomic Developments in Low-Income Developing CountriesMacroeconomic Developments in Low-Income Developing Countries
Macroeconomic Developments in Low-Income Developing Countries
 
ICAI-Review-The-effects-of-DFID’s-cash-transfer-programmes-on-poverty-and-vul...
ICAI-Review-The-effects-of-DFID’s-cash-transfer-programmes-on-poverty-and-vul...ICAI-Review-The-effects-of-DFID’s-cash-transfer-programmes-on-poverty-and-vul...
ICAI-Review-The-effects-of-DFID’s-cash-transfer-programmes-on-poverty-and-vul...
 
Stocktaking of SDGs and Post2015 Development Agenda Demanding Development jus...
Stocktaking of SDGs and Post2015 Development Agenda Demanding Development jus...Stocktaking of SDGs and Post2015 Development Agenda Demanding Development jus...
Stocktaking of SDGs and Post2015 Development Agenda Demanding Development jus...
 
Conditional Cash Transfers in Latin America– achievement and challenges
Conditional Cash Transfers in Latin America– achievement and challengesConditional Cash Transfers in Latin America– achievement and challenges
Conditional Cash Transfers in Latin America– achievement and challenges
 
Debt relief, climate and nature in COVID-19 recovery
Debt relief, climate and nature in COVID-19 recoveryDebt relief, climate and nature in COVID-19 recovery
Debt relief, climate and nature in COVID-19 recovery
 
2013a klapper
2013a klapper2013a klapper
2013a klapper
 
Wef gac poverty_sustainabledevelopment_globaldevelopmentfinance_paper_2014
Wef gac poverty_sustainabledevelopment_globaldevelopmentfinance_paper_2014Wef gac poverty_sustainabledevelopment_globaldevelopmentfinance_paper_2014
Wef gac poverty_sustainabledevelopment_globaldevelopmentfinance_paper_2014
 
PAYING FOR ZERO: Global Development Finance and the Post-2015 Agenda
 PAYING FOR ZERO: Global Development Finance and the Post-2015 Agenda PAYING FOR ZERO: Global Development Finance and the Post-2015 Agenda
PAYING FOR ZERO: Global Development Finance and the Post-2015 Agenda
 
The real effects of debt bis
The real effects of debt bisThe real effects of debt bis
The real effects of debt bis
 
Where's the money going
Where's the money going Where's the money going
Where's the money going
 
Credit demand and_rationing_in_uganda_okurut
Credit demand and_rationing_in_uganda_okurutCredit demand and_rationing_in_uganda_okurut
Credit demand and_rationing_in_uganda_okurut
 
The four dimensions of public financial management
The four dimensions of public financial managementThe four dimensions of public financial management
The four dimensions of public financial management
 
East europe's demographic problems
East europe's demographic problemsEast europe's demographic problems
East europe's demographic problems
 

More from itargeting

Debt relief agreement
Debt relief agreementDebt relief agreement
Debt relief agreementitargeting
 
Mortgage forgiveness debt_relief_act
Mortgage forgiveness debt_relief_actMortgage forgiveness debt_relief_act
Mortgage forgiveness debt_relief_actitargeting
 
Mortgage forgiveness debt
Mortgage forgiveness debtMortgage forgiveness debt
Mortgage forgiveness debtitargeting
 
Debt settlement
Debt settlementDebt settlement
Debt settlementitargeting
 
Debt reduction without default
Debt reduction without defaultDebt reduction without default
Debt reduction without defaultitargeting
 
Globalization, debt relief and poverty reduction
Globalization, debt relief and poverty reductionGlobalization, debt relief and poverty reduction
Globalization, debt relief and poverty reductionitargeting
 
Debt relief initiative for poor countries
Debt relief initiative for poor countriesDebt relief initiative for poor countries
Debt relief initiative for poor countriesitargeting
 
Is debt relief efficient
Is debt relief efficientIs debt relief efficient
Is debt relief efficientitargeting
 

More from itargeting (8)

Debt relief agreement
Debt relief agreementDebt relief agreement
Debt relief agreement
 
Mortgage forgiveness debt_relief_act
Mortgage forgiveness debt_relief_actMortgage forgiveness debt_relief_act
Mortgage forgiveness debt_relief_act
 
Mortgage forgiveness debt
Mortgage forgiveness debtMortgage forgiveness debt
Mortgage forgiveness debt
 
Debt settlement
Debt settlementDebt settlement
Debt settlement
 
Debt reduction without default
Debt reduction without defaultDebt reduction without default
Debt reduction without default
 
Globalization, debt relief and poverty reduction
Globalization, debt relief and poverty reductionGlobalization, debt relief and poverty reduction
Globalization, debt relief and poverty reduction
 
Debt relief initiative for poor countries
Debt relief initiative for poor countriesDebt relief initiative for poor countries
Debt relief initiative for poor countries
 
Is debt relief efficient
Is debt relief efficientIs debt relief efficient
Is debt relief efficient
 

Recently uploaded

BPA GROUP 7 - DARIO VS. MISON REPORTING.pdf
BPA GROUP 7 - DARIO VS. MISON REPORTING.pdfBPA GROUP 7 - DARIO VS. MISON REPORTING.pdf
BPA GROUP 7 - DARIO VS. MISON REPORTING.pdflaysamaeguardiano
 
如何办理美国加州大学欧文分校毕业证(本硕)UCI学位证书
如何办理美国加州大学欧文分校毕业证(本硕)UCI学位证书如何办理美国加州大学欧文分校毕业证(本硕)UCI学位证书
如何办理美国加州大学欧文分校毕业证(本硕)UCI学位证书Fir L
 
IBC (Insolvency and Bankruptcy Code 2016)-IOD - PPT.pptx
IBC (Insolvency and Bankruptcy Code 2016)-IOD - PPT.pptxIBC (Insolvency and Bankruptcy Code 2016)-IOD - PPT.pptx
IBC (Insolvency and Bankruptcy Code 2016)-IOD - PPT.pptxRRR Chambers
 
CALL ON ➥8923113531 🔝Call Girls Singar Nagar Lucknow best sexual service
CALL ON ➥8923113531 🔝Call Girls Singar Nagar Lucknow best sexual serviceCALL ON ➥8923113531 🔝Call Girls Singar Nagar Lucknow best sexual service
CALL ON ➥8923113531 🔝Call Girls Singar Nagar Lucknow best sexual serviceanilsa9823
 
如何办理(USF文凭证书)美国旧金山大学毕业证学位证书
如何办理(USF文凭证书)美国旧金山大学毕业证学位证书如何办理(USF文凭证书)美国旧金山大学毕业证学位证书
如何办理(USF文凭证书)美国旧金山大学毕业证学位证书Fs Las
 
一比一原版利兹大学毕业证学位证书
一比一原版利兹大学毕业证学位证书一比一原版利兹大学毕业证学位证书
一比一原版利兹大学毕业证学位证书E LSS
 
Chp 1- Contract and its kinds-business law .ppt
Chp 1- Contract and its kinds-business law .pptChp 1- Contract and its kinds-business law .ppt
Chp 1- Contract and its kinds-business law .pptzainabbkhaleeq123
 
如何办理新西兰奥克兰商学院毕业证(本硕)AIS学位证书
如何办理新西兰奥克兰商学院毕业证(本硕)AIS学位证书如何办理新西兰奥克兰商学院毕业证(本硕)AIS学位证书
如何办理新西兰奥克兰商学院毕业证(本硕)AIS学位证书Fir L
 
一比一原版西澳大学毕业证学位证书
 一比一原版西澳大学毕业证学位证书 一比一原版西澳大学毕业证学位证书
一比一原版西澳大学毕业证学位证书SS A
 
Audience profile - SF.pptxxxxxxxxxxxxxxxxxxxxxxxxxxx
Audience profile - SF.pptxxxxxxxxxxxxxxxxxxxxxxxxxxxAudience profile - SF.pptxxxxxxxxxxxxxxxxxxxxxxxxxxx
Audience profile - SF.pptxxxxxxxxxxxxxxxxxxxxxxxxxxxMollyBrown86
 
Cleades Robinson's Commitment to Service
Cleades Robinson's Commitment to ServiceCleades Robinson's Commitment to Service
Cleades Robinson's Commitment to ServiceCleades Robinson
 
LITERAL RULE OF INTERPRETATION - PRIMARY RULE
LITERAL RULE OF INTERPRETATION - PRIMARY RULELITERAL RULE OF INTERPRETATION - PRIMARY RULE
LITERAL RULE OF INTERPRETATION - PRIMARY RULEsreeramsaipranitha
 
589308994-interpretation-of-statutes-notes-law-college.pdf
589308994-interpretation-of-statutes-notes-law-college.pdf589308994-interpretation-of-statutes-notes-law-college.pdf
589308994-interpretation-of-statutes-notes-law-college.pdfSUSHMITAPOTHAL
 
一比一原版旧金山州立大学毕业证学位证书
 一比一原版旧金山州立大学毕业证学位证书 一比一原版旧金山州立大学毕业证学位证书
一比一原版旧金山州立大学毕业证学位证书SS A
 
INVOLUNTARY TRANSFERS Kenya school of law.pptx
INVOLUNTARY TRANSFERS Kenya school of law.pptxINVOLUNTARY TRANSFERS Kenya school of law.pptx
INVOLUNTARY TRANSFERS Kenya school of law.pptxnyabatejosphat1
 
Essentials of a Valid Transfer.pptxmmmmmm
Essentials of a Valid Transfer.pptxmmmmmmEssentials of a Valid Transfer.pptxmmmmmm
Essentials of a Valid Transfer.pptxmmmmmm2020000445musaib
 

Recently uploaded (20)

BPA GROUP 7 - DARIO VS. MISON REPORTING.pdf
BPA GROUP 7 - DARIO VS. MISON REPORTING.pdfBPA GROUP 7 - DARIO VS. MISON REPORTING.pdf
BPA GROUP 7 - DARIO VS. MISON REPORTING.pdf
 
如何办理美国加州大学欧文分校毕业证(本硕)UCI学位证书
如何办理美国加州大学欧文分校毕业证(本硕)UCI学位证书如何办理美国加州大学欧文分校毕业证(本硕)UCI学位证书
如何办理美国加州大学欧文分校毕业证(本硕)UCI学位证书
 
Russian Call Girls Rohini Sector 6 💓 Delhi 9999965857 @Sabina Modi VVIP MODEL...
Russian Call Girls Rohini Sector 6 💓 Delhi 9999965857 @Sabina Modi VVIP MODEL...Russian Call Girls Rohini Sector 6 💓 Delhi 9999965857 @Sabina Modi VVIP MODEL...
Russian Call Girls Rohini Sector 6 💓 Delhi 9999965857 @Sabina Modi VVIP MODEL...
 
IBC (Insolvency and Bankruptcy Code 2016)-IOD - PPT.pptx
IBC (Insolvency and Bankruptcy Code 2016)-IOD - PPT.pptxIBC (Insolvency and Bankruptcy Code 2016)-IOD - PPT.pptx
IBC (Insolvency and Bankruptcy Code 2016)-IOD - PPT.pptx
 
CALL ON ➥8923113531 🔝Call Girls Singar Nagar Lucknow best sexual service
CALL ON ➥8923113531 🔝Call Girls Singar Nagar Lucknow best sexual serviceCALL ON ➥8923113531 🔝Call Girls Singar Nagar Lucknow best sexual service
CALL ON ➥8923113531 🔝Call Girls Singar Nagar Lucknow best sexual service
 
如何办理(USF文凭证书)美国旧金山大学毕业证学位证书
如何办理(USF文凭证书)美国旧金山大学毕业证学位证书如何办理(USF文凭证书)美国旧金山大学毕业证学位证书
如何办理(USF文凭证书)美国旧金山大学毕业证学位证书
 
一比一原版利兹大学毕业证学位证书
一比一原版利兹大学毕业证学位证书一比一原版利兹大学毕业证学位证书
一比一原版利兹大学毕业证学位证书
 
Russian Call Girls Service Gomti Nagar \ 9548273370 Indian Call Girls Service...
Russian Call Girls Service Gomti Nagar \ 9548273370 Indian Call Girls Service...Russian Call Girls Service Gomti Nagar \ 9548273370 Indian Call Girls Service...
Russian Call Girls Service Gomti Nagar \ 9548273370 Indian Call Girls Service...
 
Chp 1- Contract and its kinds-business law .ppt
Chp 1- Contract and its kinds-business law .pptChp 1- Contract and its kinds-business law .ppt
Chp 1- Contract and its kinds-business law .ppt
 
如何办理新西兰奥克兰商学院毕业证(本硕)AIS学位证书
如何办理新西兰奥克兰商学院毕业证(本硕)AIS学位证书如何办理新西兰奥克兰商学院毕业证(本硕)AIS学位证书
如何办理新西兰奥克兰商学院毕业证(本硕)AIS学位证书
 
一比一原版西澳大学毕业证学位证书
 一比一原版西澳大学毕业证学位证书 一比一原版西澳大学毕业证学位证书
一比一原版西澳大学毕业证学位证书
 
Audience profile - SF.pptxxxxxxxxxxxxxxxxxxxxxxxxxxx
Audience profile - SF.pptxxxxxxxxxxxxxxxxxxxxxxxxxxxAudience profile - SF.pptxxxxxxxxxxxxxxxxxxxxxxxxxxx
Audience profile - SF.pptxxxxxxxxxxxxxxxxxxxxxxxxxxx
 
Cleades Robinson's Commitment to Service
Cleades Robinson's Commitment to ServiceCleades Robinson's Commitment to Service
Cleades Robinson's Commitment to Service
 
LITERAL RULE OF INTERPRETATION - PRIMARY RULE
LITERAL RULE OF INTERPRETATION - PRIMARY RULELITERAL RULE OF INTERPRETATION - PRIMARY RULE
LITERAL RULE OF INTERPRETATION - PRIMARY RULE
 
589308994-interpretation-of-statutes-notes-law-college.pdf
589308994-interpretation-of-statutes-notes-law-college.pdf589308994-interpretation-of-statutes-notes-law-college.pdf
589308994-interpretation-of-statutes-notes-law-college.pdf
 
Rohini Sector 25 Call Girls Delhi 9999965857 @Sabina Saikh No Advance
Rohini Sector 25 Call Girls Delhi 9999965857 @Sabina Saikh No AdvanceRohini Sector 25 Call Girls Delhi 9999965857 @Sabina Saikh No Advance
Rohini Sector 25 Call Girls Delhi 9999965857 @Sabina Saikh No Advance
 
一比一原版旧金山州立大学毕业证学位证书
 一比一原版旧金山州立大学毕业证学位证书 一比一原版旧金山州立大学毕业证学位证书
一比一原版旧金山州立大学毕业证学位证书
 
Russian Call Girls Rohini Sector 7 💓 Delhi 9999965857 @Sabina Modi VVIP MODEL...
Russian Call Girls Rohini Sector 7 💓 Delhi 9999965857 @Sabina Modi VVIP MODEL...Russian Call Girls Rohini Sector 7 💓 Delhi 9999965857 @Sabina Modi VVIP MODEL...
Russian Call Girls Rohini Sector 7 💓 Delhi 9999965857 @Sabina Modi VVIP MODEL...
 
INVOLUNTARY TRANSFERS Kenya school of law.pptx
INVOLUNTARY TRANSFERS Kenya school of law.pptxINVOLUNTARY TRANSFERS Kenya school of law.pptx
INVOLUNTARY TRANSFERS Kenya school of law.pptx
 
Essentials of a Valid Transfer.pptxmmmmmm
Essentials of a Valid Transfer.pptxmmmmmmEssentials of a Valid Transfer.pptxmmmmmm
Essentials of a Valid Transfer.pptxmmmmmm
 

Center for international development

  • 1. Center for International Development 1 Harvard University Implementing Debt Relief for the HIPCs August 1999 1 Prof. Jeffrey Sachs, Dr. Kwesi Botchwey, Mr. Maciej Cuchra, Ms. Sara Sievers. We thank the following students for excellent research assistance: Simona Bovha, Laura Serban, David Nicoll and Frederick Antwi.
  • 2. 2 Executive Summary The Cologne Initiative (hereafter CI) re-opens the international official discussion about the HIPC (highly indebted poor country) debt crisis. Unfortunately, the CI leaves in place many of the serious flaws of the original HIPC initiative of 1996. To a first approximation, the current debt servicing "system" works as follows. Part of the debt service that is due is postponed, formally, or de facto as arrears. Of the substantial debt service that is actually paid, some gets covered through new loans and the rest through grants from bilateral donors. In the end, the HIPCs generally receive more than they pay, but the amounts of net resource transfers are small, less that US$10 per person in 1997. Even though the net resource transfers tend to be positive, the debt servicing system is fundamentally flawed. First and most urgently, the net resource transfers are not large enough to enable the HIPC governments to meet basic health and education needs of the population. Second, the bilateral grants do not neatly offset the heavy burden of debt servicing, even if they appear to do so in formal accounting. The debt burden falls heavily on the budget, and therefore on line ministries (such as the ministry of health) while grants frequently finance extra-budgetary activities established by the donors. Third, the process of offsetting heavy debt payments with grants and new loans is highly unstable and erratic. There is no guarantee that new grants will fill the fiscal void left behind by the heavy debt servicing; indeed sometimes there is a self-fulfilling collapse of fiscal resources. The instability, unpredictability, and time-consuming nature of these rollover mechanisms contribute to the incapacity of HIPC governments and the international community to formulate long-term solutions to the pressing social crises in the HIPC countries. While the new CI aims at more “ambitious” debt reduction targets than the 1996 HIPC Initiative, the basic problem remains that the new standards are as arbitrary as the old ones. Both initiatives focus mainly on the relationship of debt to exports, even though debt-to-export ratios have little if anything to do with the real ability of governments to meet urgent social needs while servicing debts. An effective process of HIPC debt relief should be grounded on the following principles: the unmet social needs of most HIPC countries require significant net resource inflows; to achieve these increased inflows, it will be necessary to cancel most or all old debts; to the extent possible, new inflows should be highly concessional; debt relief should be guided by a process that helps to insure that the increased resource transfers will be channeled into areas of urgent human need, especially in public health and primary education.
  • 3. 3 Implementing Debt Relief for the HIPCs The Cologne Initiative (hereafter CI) re-opens the international official discussion about HIPC (highly indebted poor country) debt crisis. 2 Unfortunately, the CI leaves in place many of the serious flaws of the original HIPC initiative of 1996. Neither the HIPC initiative, nor the CI, have come to grips with three basic problems: The debt is owed by impoverished governments, and therefore should be based on the HIPC governments’ capacity to pay, not on arbitrary numerical guidelines related to exports, which have little if anything to do with the countries' fiscal position or ability to pay; Most HIPC governments have no capacity to repay debts in view of the urgent social crises that they must confront. These governments are in fact in need of large net resource transfers from the rest of the world; Under current arrangements, debt service burdens are imperfectly offset via new loans, grants, rescheduling and outright arrears. The instability, unpredictability, and time- consuming nature of these rollover mechanisms contribute to the incapacity of HIPC governments and the international community to formulate long-term solutions to the pressing social crises in the HIPC countries. While the new CI aims at more “ambitious” debt reduction targets than the 1996 HIPC Initiative, the basic problem remains that the new standards are as arbitrary as the old ones. 3 Both initiatives focused mainly on the relationship of debt to exports, even though debt-to-export ratios have little if anything to do with the real ability of governments to meet urgent social needs while servicing debts. An effective process of HIPC debt relief should be grounded on the following principles: 2 The HIPCs are a group of countries designated by the IMF and World Bank to be poor and highly indebted. There were 41 countries on the original HIPC list. Subsequently, Nigeria was eliminated (inappropriately in our view) and Malawi was added, keeping the list at 41. In our treatment of the issue, we consider the HIPCs to include 42 countries (the original list plus Malawi). 34 of the 42 countries, including 548 million of the 712 million HIPC population (77 percent), are in Sub-Saharan Africa. 3 The original HIPC initiative aimed to reduce the net present value of HIPC debts to 200-250 percent of anticipated export earnings. The new initiative drops the target to 150 percent of exports, and adds a second criterion that the NPV of debt should be no more than 250 percent of anticipated government revenues. The export-based ratios are irrelevant to capacity to pay (the governments do not own the export revenues; nor does a debt-to-export ratio address the tradeoffs between debt servicing and social spending). The new debt-to-government revenue target is an improvement, but is numerically arbitrary and offers no way to assess the tradeoffs between urgent social spending and debt servicing.
  • 4. 4 For most HIPC countries, the unmet social needs are so vast and urgent that these countries will require significant net resource inflows for many years, larger than the net inflows that they are now receiving. To achieve these increased inflows, it will be necessary to cancel most or all old debts -- with much greater relief than is envisioned in the CI -- and to sustain or increase the inflows of new grants and loans. To the extent possible, new inflows should be highly concessional, to avoid a repeat of the current situation in which non-creditworthy countries were financed through commercial loans rather than foreign assistance. Debt relief should be guided by a process that helps to insure that the increased resource transfers will be channeled into areas of urgent human need, especially in public health and primary education. Such a process requires the leadership of key international organizations with responsibility in these areas of urgent social need – especially the World Health Organization, UNICEF, the United Nations Development Program, and the World Bank – and with a diminished role of the International Monetary Fund. The Capacity to Pay Capacity to pay must be judged according to the alternative uses of funds claimed by debt servicing. Many of the HIPC countries currently service their debts at the cost of widespread malnutrition, premature death, excessive morbidity, and reduced prospects for economic growth. If the resources were freed up and successfully redirected towards basic human needs, there could be significant improvements in human welfare. For most countries in the world, other than the HIPCs, debt payments do not compromise the basic human needs of the population. For many of the HIPCs, by contrast, the most basic human needs are jeopardized by the continuation of contractual debt servicing. Take the case of Zambia, for example, which spent more than 30% of its national budget on debt payments each year throughout the 1990s (Table 5), while spending roughly 10% on basic social services. The Zambian Government’s annual health expenditures per person are estimated to be US$ 17 dollars (Table 1), while the G7 governments spend around US$ 2,300 per person in health care. In Zambia, 20% of the population is now HIV positive, and it is estimated that around 9% of Zambian children under 15 have lost a mother or both parents to AIDS. Half of all Zambians have no access to safe drinking water. Roughly 30% of children remain unvaccinated. The infant mortality rate stands at 112 per 1000 births (compared to 5 in the United States). Life expectancy has dropped to 43 years, and is expected to decline still further as AIDS continues to take its toll. Zambia is not alone in this shocking state of affairs, as we see from the figures in Tables 1, 2, and 3, where the data for selected HIPCs are presented. Looking first at the basic nutrition levels, we see evidence of outright declines in caloric consumption in ten HIPC countries in recent years. In nine Sub-Saharan African HIPCs, average caloric intake does not even reach
  • 5. 5 2,000 calories per day. During this same period, the average resident in the G7 countries consumed roughly 3,300 calories per day. The data on protein consumption per capita are even more dramatic: nearly half of HIPC countries showed outright declines in protein consumption per capita in recent years. On average, individuals in HIPC countries consumed little more than half of the protein per capita of G-7 residents. Average life expectancy at birth for all the HIPC countries is just over 51 years; in the G-7, it is 78 years. Thirteen Sub-Saharan HIPC countries showed declines in life expectancy during the 1990’s, partly due to the AIDS epidemic, which is ravaging the continent. The enormity of the AIDS epidemic in Africa could approach the scale of the Bubonic Plague of 14 th century Europe. In parts of Southern and East Africa, HIV infection rates are now over 20% of the total population, including a third or more of the sexually active adult population. In Germany, to take one comparison, the infection rate is estimated to be 0.08% of the population, less than 1/200 th of the prevalence in the hard-hit parts of Africa. AIDS claimed an estimated 2 million deaths in Sub-Saharan Africa in 1998, a rate of 5,500 people per day, and has left millions of children orphaned. Enterprises in many of the worst affected countries have had to institute policies prohibiting employees from attending more than one funeral per week. Firms are training three and four people for each job in anticipation of AIDS deaths, and have often been forced to cut health care benefits entirely as costs have spiraled as a result of the epidemic. 4 There is only a trickle of money spent on public health measures to limit the epidemic, or to treat infected individuals. Total international assistance to developing countries is on the order of US$ 300 million per year, or around US$ 7 per infected individual. While in the advanced countries, medical advances have provided “drug cocktails” that postpone or prevent the onset of AIDS in HIV-infected individuals, such treatments are orders of magnitude too expensive in the poorest countries. Money matters. Vaccination, drug therapies, doctor’s salaries, teachers’ salaries, basic sanitation systems, and other underpinnings of basic human welfare cost real dollars. While the average Frenchman or German has approximately US$ 2,500 devoted by the government to public health, the astounding figures in Sub-Saharan Africa include: Kenya, US$8; Uganda US$9, Cote D’Ivoire, US$25; Burkina Faso, US$54; and Ethiopia, US$3 (Table 1). The same vast gap is evident in education spending (Table 4). What, then, is the capacity of the HIPC countries to repay their debts while addressing urgent human needs? In general, most have no debt-servicing capacity whatsoever. Indeed, most of the HIPC countries receive more in grants and new loans than they paid in debt servicing, as we will see below. In other words, the world has implicitly or explicitly recognized that these countries cannot service their debts now or in the foreseeable future. We just hide that fundamental reality in a complex shell game, in which large-scale debt servicing is very imperfectly offset by debt postponements, arrears, new loans, and grants from donor government. The shell game, however, is exhausting and debilitating. Virtually every HIPC government spends an enormous amount of time simply staying one step ahead of outright 4 Taken from a combination of firm-level surveys conducted in 30 African countries, and press reports.
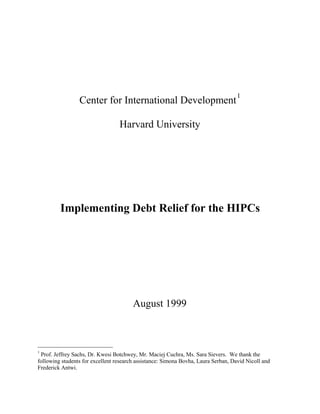
  • 6. 6 default, and many fail to do even that. In the meantime, there is little long-term thinking, and less long-term planning to solve critical problems. When the HIPC initiative was launched in 1996, there was some hope that social criteria would be incorporated into the heart of the initiative. Such was not the case. Finance ministries and the IMF/World Bank decided instead that debt-servicing capacity would be judged mainly by comparing the net present value of debt with the level of exports. Debt relief aimed to reduce the NPV of debt to between 200 and 250 percent of exports. These criteria neglected the obvious fact that the debts were owed by governments, not exporters, and that ratio of debt to exports could not conceivably measure the tradeoffs of debt servicing and meeting basic human needs. The result has been a statistical standard bereft of economic and social logic. At the Cologne Summit, the G-7 instructed the Bretton Woods institutions and other parts of the international community to consider new ways of incorporating social priorities into their programs. The first step should be to assess the real budgetary costs of meeting urgent social needs – particularly in health and education -- and assessing the extent to which debt servicing jeopardizes the budgetary capacity to meet those needs. Without such an analysis, the HIPC Initiative will remain moribund, and impoverished governments will continue to make debt service payments at the expense of the very lives of their citizens. The Current Debt Quagmire To a first approximation, the current debt servicing “system” works as follows. Part of the debt service that is due is postponed, formally or de facto as arrears. Of the substantial debt service that is actually paid, some gets covered through new loans and the rest through grants from bilateral donors. In the end, the HIPCs generally receive more than they pay (in technical terms, the net resource transfer is positive), but the amounts of net resource transfers are small (less than US$10 per person in the HIPC countries in 1997), grossly insufficient in the face of the social crises hitting these countries. The net resource transfers are also unstable and unpredictable. As a general rule, the HIPCs make net resource transfers (that is, they pay more in interest and amortization on old loans than they receive in new loans) to their bilateral creditors, the IBRD (non-concessional World Bank lending window), the IMF, and private creditors. They receive net resource transfers (more in loans and grants than paid in debt service) from two main sources: IDA (the concessional World Bank lending window), and bilateral donor grants. Figure 1 shows the estimated net resource transfers vis-à-vis various creditors, for 1996 and 1997, for the HIPCs as a group. A negative indicates a net resource outflow from the HIPCs (debt service in excess of new loans). Note that for all debts, the net resource transfer is negative (more is paid in interest and amortization than is received in new loans). Grants, however, are more than the negative net transfer on debts, so that the overall net resource transfer is positive (grants plus loans exceeds interest plus amortization), though small in per capita terms and declining over time. Figure 2 shows the time path of net resource transfers in the 1990s. We see that in every year, new loans (the lower part of the right hand side bar for each year) plus grants (the upper
  • 7. 7 part of the right hand side bar for each year) are greater than debt servicing (the left hand side bar for each year). The net resource transfer from the rest of the world – equal to grants plus new loans minus debt servicing -- is the dotted box. As just noted, these net resource transfers have been declining over time, mainly because new loans have declined relative to debt servicing, while grants have remained roughly unchanged in nominal terms. The result is that overall annual net resource transfers have declined by US$ 3 - 4 billion in the past five years, falling from around US$ 10 billion per year in the mid-1990s, to around US$ 6 billion per year in 1998. Even though the net resource transfers tend to be positive, the debt servicing “system” is fundamentally flawed. First, and most urgently, the net resource transfers are not large enough to enable the HIPC governments to meet basic health and education needs of the population. The negative net transfers on existing debt have gotten substantially larger in recent years, while the grants extended to the HIPCs have remained roughly unchanged in nominal terms. Second, and crucially, the bilateral grants to do not neatly offset the heavy burden of debt servicing, even if they appear to do so in formal accounting. The debt burden falls heavily on the budget, and therefore on line ministries (such as the health ministry) while grants frequently finance extra-budgetary activities established by the donors. In fact, since the governments are bankrupt, donors often attempt to establish these extra-budgetary programs precisely so that they will not be drawn into the fiscal insolvency of the government. The result is profound de- institutionalization of public activities, with a government that remains insolvent and illiquid, and a bilateral donor process that supports non-governmental activities in lieu of an effective state. Third, the process of offsetting heavy debt payments with grants and new loans is highly unstable and erratic. There is no guarantee that new grants will fill the fiscal void left behind by the heavy debt servicing. Indeed, sometimes there is a self-fulfilling collapse of fiscal resources. A “financing gap” opens up, causing the IMF to delay payments to a HIPC country. The IMF decision in turn blocks the disbursement of funds by other major creditors, including the World Bank and bilateral donors. The absence of such funds then dramatically worsens the budget situation, “proving” that the IMF was right to suspend the program. A long period of default, followed by difficult negotiations to restart lending, transpires. During this period, governments services collapse, institutions such as hospitals or cold-chains for delivery of vaccines, break down. The Tables 5, 6 and 7 illustrate the significant volatility of resource transfers due to this system of repaying old, non-payable debts through new loans and grants. Table 5 shows the amount of debt servicing actually paid by the HIPC governments relative to government revenues each year. 5 Table 6 shows the net transfers on debt actually paid, also as a percent of government revenues. Table 7 shows the net resource transfers overall received by the HIPC governments, taking into account grants received by the government. We see that debt servicing is enormous (dozens of percent of tax revenues, and often well over 50% of the government 5 The data refers to general government, which means central government, plus regional and local governments, plus parastatal enterprises where data is available (e.g. Bolivia); for other cases the government revenue does not include revenue of the parastatal enterprises. Revenues include both tax and non-tax revenues. All data are from national accounts published in the IMF country reports. See the Appendix for a detailed list of country sources.
  • 8. 8 revenues). It is also volatile. To take just one example, net resource transfers to Malawi fell from 129% of revenue in 1995 to 48% of revenue in 1997, a remarkable change in 2-year period. Table 6 show the net resource transfers paid on the debt is similarly erratic, and often very large as a percent of government revenues. Table 7 shows that while HIPC governments indeed receive overall net resource transfers (once account is taken of grants), these net resource flows are also erratic and unpredictable. A sound and stable fiscal policy would be possible only with a high degree of predictability about the net transfers in future years. The wide fluctuations of the net transfers that the HIPCs are currently exhibiting render consistent budgetary planning practically impossible. The net flows are not only highly unstable, but also essentially unpredictable as they depend on an outcome of a complex interplay between the vastly different profiles of debt flows to different types of creditors, as well as on uncertain extraordinary revenues. Uncertainty, volatility and instability, therefore, put the governments' finances in the state of a permanent crisis where each fiscal period poses a dilemma about the portion of essential fiscal spending, such as health care, education, or public infrastructure, that the governments will be able to make. Finally, the vast discrepancy between the debt service obligations and the ordinary government revenue, such as tax collections, make governments virtually insolvent the moment the extraordinary transfers are suspended. The result of constantly trying to cover up fiscal bankruptcy through new loans and grants, therefore, results in the following main outcomes. First, there is a huge year-to-year variation in debt servicing and net resource transfers. Second, a large proportion of government time is spent merely staying out of default rather than investing in new long-term programs. Third, a considerable and increasing amount of social spending is carried out by ad hoc institutions backed by international grants, rather than by government ministries backed by budgetary revenues. Thus, the system is promoting long-term institutional degradation of the HIPC governments. Fourth, the net resource transfers are falling, and are inadequate to meet basic human needs. A Revised Program of HIPC Debt Relief The revised HIPC program should re-establish the fiscal base for meeting the urgent social needs confronting the HIPC countries. This should be done in the following ways. For almost all HIPCs, we should recognize the need for significant, and increased, net resource transfers for the foreseeable future, in order to help countries confront deep and unmet social crises – ranging from HIV-AIDs, to holoendemic malaria, to massive malnutrition, to unfulfilled immunization targets, to insufficient enrolments in primary schools and very low school quality. To bring about these increased net resource transfers, debt servicing on old debts should be cancelled, while maintaining or increasing the flow of grants and loans. To the maximum extent possible, new transfers should come in the form of grants and concessional loans (ODA), rather than commercial loans.
  • 9. 9 Debts owed to bilateral creditors should be forgiven in their entirety in most cases, upon demonstration of need, in the context of a process that aims to channel the budgetary saving to urgent social needs. Debts owed to the IBRD (non-concessional World Bank financing) should be forgiven as well. The IDA program continues to make large net transfers to most HIPCs. IDA loans need to be forgiven only in the unusual circumstances that IDA debt servicing is imposing large net resource costs on a particular country, or is likely to do so in the next few years. ESAF and standby loan repayments should be forgiven, as net repayments to the IMF represent a growing burden on the HIPCs. It is arguable that ESAF as a whole should be eliminated, as the IMF as an institution is more suited to short-run macroeconomic management than to long-term development financing. In the estimates below, we assume that once a HIPC has received a cancellation of old ESAF loans, that it does not borrow again from ESAF (though perhaps some non-HIPC countries will continue to receive ESAF loans). In cases where the private-sector debt is a substantial burden on economic development, these private sector debts should be substantially forgiven as well. Public-sector creditors would be right to insist upon pari passu (or nearly pari passu) treatment in those cases. The bilateral creditors should coordinate their ODA to ensure that debt reduction is not offset by declines in new loans and grants. In many cases, HIPC countries will require substantial increases in net resource transfers in the years ahead, in order to succeed in meeting targets for improvement in key social indicators. If bilateral loans and grants remained unchanged, while debt servicing on public and publicly guaranteed debts owed to the Paris Club, IBRD, and IMF, and other multilateral creditors are forgiven, the result would be a sizeable increase in net resource transfers to the HIPC countries, on the order of US$ 5 billion per year, and a substantial decrease in the long- term debt stock, on the order of over 60% of the existing debt stock. Note, importantly, that the calculations are for face value of debt, not the net present value (NPV), since NPV estimates by class of creditor are not publicly available. Note also that in cases where the private sector debts are also written down, the percent reduction would of course be larger. The tables 8 and 9 show the potential savings for selected HIPCs based on the 1997 data if the above formula is adopted - Table 8 presents the relief on the stock of the public and publicly guaranteed debt outstanding as percentage of total long-term debt, and Table 9 presents the estimated savings on debt transfers during that year. Note that debt relief for the HIPC countries will almost surely not be sufficient, by itself, to enable these countries to meet goals of improving basic conditions of public health and education in the next few years. We stress again that debt relief will have two effects – increased net resource transfers, and more realistic and long-term budgeting – but that these effects will almost surely need to be augmented by increases in bilateral official development assistance to those countries that are energetically undertaking expanded programs of social spending, as well as much better targeting and design of social programs.
  • 10. 10 Financing the Debt Relief Program One of the peculiar arguments concerning the HIPC initiative is that the rich countries and multilateral institutions can not “afford” to forgive the HIPC debt. For most of the bilateral creditors, a high proportion of the debt is already deemed to be uncollectable. In the United States, for example, the roughly US$6 billion owed by the HIPCs is already held on official accounts at around 10 percent of face value, or US$600 million. Under current procedures, the U.S. Congress would have to appropriate only US$600 million to enable a complete write-off and forgiveness of all of the HIPC debt owed to the United States. In the case of the World Bank, we must consider mainly the IBRD claims. Regarding IBRD claims, these totaled around US$4 billion in 1998, but are falling fast as a result of net repayments. Outstanding IBRD claims may amount to no more than US$2 billion as of 1999. These loans could be forgiven by the Bank with losses easily absorbed by loan loss reserves at the Bank. The IBRD has already provisioned for some US$3.24 billion of loan losses. In addition the World Bank has capital of at least US$27 billion. With respect to IDA loans, these are backed by grants, not capital contributions to the Bank. IDA loans could be cancelled, if necessary, without at all impairing IBRD capital. The only effect would be to reduce the size of future IDA loans. As noted earlier, most countries will probably not need IDA relief in the next few years. In the case of the IMF, several methods could be used to reduce IMF claims, which amount to roughly US$3.5 billion in NPV of ESAF loans, and another US$2.8 billion or so of standby loans (the total was approx. US$7 billion in 1997). First, the IMF is sitting on massive unrealized capital gains on its gold reserves, which could also be used to back debt write-offs on the IMF balance sheet. Even without gold sales, these gold holdings could be revalued to market prices, and the capital gain could be allocated partly to finance debt cancellation and partly to augment the IMF various reserve accounts. In addition, the IMF maintains various special accounts to absorb losses. The Reserve Account in the General Department of the IMF has approximately 2.13 billion SDR (US$2.9 billion) which could be charged against debt write- offs of standby loans. Similarly, the reserve account in the ESAF Trust Fund has approximately US$2.82 billion, and the subsidy account also has reserves that could provide another US$2 billion or so that could be used against write-off of ESAF claims. Thus, some combination of gold revaluation (and/or gold sales at market value) combined with the use of various reserve funds available for adverse contingencies, could easily fund a complete write-off of IMF claims on HIPC countries. The more difficult case involves the African Development Bank. It is probably true that a deep write-off of debts owed to the AfDB would impair the bank, and require some recapitalization. The total value of such an infusion, however, would be modest. Informal estimates by U.S. Government officials suggest that the overall recapitalization could amount to a few billion dollars, to be shared among a large number of donor governments. If the U.S. participated in such a recapitalization, the U.S. share might perhaps amount to a few hundred million dollars.
  • 11. 11 Monitoring Debt Relief The current international assistance strategy is based on a series of negotiations between the indebted country and its major creditors: the bilateral donors, the IMF, the World Bank, and the regional development banks. The IMF operates as primus inter pares among the international institutions and donors. It alone judges whether a country’s budget is in macroeconomic balance. When the IMF declares that a HIPC budget is out of balance, its verdict generally stops much or all of the resource transfers to the country coming from bilateral and other multilateral sources. Under current aid arrangements, aid decisions – and decisions about how much debt should be serviced – are taken with little attention to social needs. The IMF has no expertise to deal with issues of public health, nutrition, immediate food security, the HIV-AIDS epidemic, and other critical social issues in need of budgetary expenditure, as a recent external evaluation of the ESAF correctly observed. When the IMF renders a decision on whether a government can or cannot service a debt, it gives little if any attention to whether the health care system has collapsed, whether children are being vaccinated, or whether the HIV-AIDS epidemic is being attended to. This would be fine if the IMF were limited to its own immediate brief – monetary stability – but, in fact, the IMF has a major if not decisive influence on the implementation of the entire HIPC process although its net transfers to the HIPC countries are relatively small. In the future, decisions over the extent of debt relief should be made in view of a detailed assessment of real social needs. United Nations agencies that specialize in critical social areas should play a decisive role in the process of assisting the HIPCs, working under the leadership of the HIPC governments to prepare “social audits” that can be the basis for a revised and revived strategy on meeting urgent social needs. Non-governmental organizations involved in social services should also be encouraged to provide inputs to the deliberative process. The key U.N. agencies would include the World Health Organization (WHO), the United Nations Children Fund (UNICEF), the Joint United Nations Program on HIV-AIDS (UNAIDS), the World Food Program (WFP), and the Food and Agricultural Organization (FAO). The United Nations Development Program (UNDP) -- which is both the UN’s producer of key social indicators in the Human Development Report (as well as human development reports at the national level), as well as the agency charged with coordination of UN development activities at the country level -- should play a leading role in coordinating the U.N. efforts in preparing the social audits. The UNDP should work with the World Bank and the International Monetary Fund to ensure that the social audits form the basis for actual debt relief implementation and monitoring. The debt reduction process itself could be based on a formal debt-reduction-cum-human needs program presented by each HIPC government to a creditor committee, which would then formally approve a timetable for debt cancellation in conjunction with enhanced efforts on the social programs. The creditors, sitting as a committee, could formally vote on the proposed program, so that no single institution or creditors would be the arbiter of the relief process. One of the key aspects of any such program, of course, should be a multi-year commitment to meet
  • 12. 12 quantitative targets on basic human needs, such as immunization coverage, population access to mother-and-child care, HIV incidence and prevalence, and primary school enrolment rates. These quantified targets would not only be a guide to long-term budgeting and funding of social programs, but would also provide a kind of conditionality for the international community as well as the HIPC countries. Failures to meet specific quantified targets on health and education would call into question the efficacy of the international policies applied to the HIPC countries. It is often asked whether debt relief will simply release countries from necessary conditionality on future loans. In the case of the HIPCs, conditionality will be easily maintained even after comprehensive debt relief. These countries need not only a cancellation of old debts, but also a continued inflow of new resource flows. For that reason, bilateral and multilateral donors will be in a position to insist upon real government performance in using international funds, and will be in a continuing position to monitor the use of those funds – even to the point of cutting them off if governments abusively misuse the international resources put at their disposal. Debt Relief within an Overall Economic Strategy Social policy is but one aspect of overall development policy. Considerable research and country case studies show that the single best long-term solution to crises of basic human needs is long-term economic growth. Thus, we should not put aside the goals of long-term growth as we turn our attention to enhanced social programs. A greatly enhanced social strategy and an improved long-term growth strategy are surely complementary components of an overall revision of development policies for the HIPC countries. This note is not the place to elaborate an overall development strategy. Only a few summary points can be noted, for elaboration elsewhere: A successful growth strategy for a low-income country almost by nature must include a component of export-led growth, especially export-led growth in manufactures such as apparel and electronics assembly (at least to complement, if not soon supplant, the dominance of natural resource commodity exports) The rich countries and multinational institutions should redouble their efforts on the scientific front, to work with researchers in the HIPC countries to improve agricultural technologies (in part through the use of the new biotechnologies), and to find new approaches to public health, especially related to the killer infectious diseases of HIV-AIDs, malaria, and TB. The HIPC countries would generally benefit from greatly increased regional cooperation, especially in Sub-Saharan Africa. Regional groupings such as SADC and ECOWAS have several important roles to play in providing regional infrastructure; regional oversight of national economic policies; and expanded trade through regional trade liberalization.
  • 13. 13 We are the first to acknowledge that debt relief by itself will be no solution to the long- term development challenges facing the world’s poorest countries. Debt relief is a necessary condition, but hardly sufficient. These countries need more than debt cancellation and foreign aid in the coming years: they need real economic development to lift these societies above the shocking level of poverty that they now endure. Debt relief will allow these countries to make some headway on ensuring the survival and health of the next generation. A healthy population, operating under a sound strategy of market-based economic development, will have a much better opportunity to achieve sustained progress in economic development and poverty reduction.
  • 14. 14 FIGURE 1 Source: Global Development Finance 1999 (electronic database); CID calculations. Net Debt Transfers to HIPCs 1996-1997 by Category of a Creditor (1,648) (1,285) 2,746 (62) 236.5 (248) (2,287) (2,299) 8,98 (1,096) (1,020) 2,496 219 600 (1,315) (813) (98.1) (3,200) - 3,200 6,400 9,600 Bilateral IBRD IDA Other Multilateral Exc. IMF IMF Total Official Total Private Total NTR on PPG G Creditors US$millions 1996 1997
  • 15. 15 FIGURE 2 Net Transfers to HIPCs 1992-1997 Total PPG 10,362 10,639 10,774 9,359 6,701 7,094 - 5,000 10,000 15,000 20,000 1992 1992 1993 1993 1994 1994 1995 1995 1996 1996 1997 millionsUS$ Debt Service New Disbursments Grants Net Transfer Source: Global Development Finance 1999 (electronic database) and CID calculations.
  • 16. 16 TABLE 1 Health Expenditure % GDP and Per Capita for Selected HIPCs and G7 Countries Health Expenditure, public, % of GDP Health Expenditure per capita, US$ Country / Year 1990-1997 1990-1997 Ethiopia 1.6 3 Nigeria 0.2 5 Chad 1.6 6 Ghana 2.9 6 Cameroon 1.0 7 Kenya 1.9 8 Mali 2.0 8 Uganda 1.9 9 Vietnam 1.1 9 Lao PDR 1.3 10 Togo 1.6 15 Zambia* 2.9 17 Burundi 1.0 18 Cote d'Ivoire 1.4 25 Mauritania 1.8 28 Honduras 2.8 33 Nicaragua 5.3 37 Republic of Yemen 1.3 39 Bolivia 3.8 54 Congo 1.8 77 Average 2.0 22 Canada 6.3 1,829 United States 6.6 4,093 Japan 5.7 2,442 UK 5.7 1,454 France 7.7 2,349 Germany 8.1 2,677 Italy 5.3 1,515 Average 6 2337 Averages for the period are for the years when data is available. * Health expenditure as % of GDP for Zambia is for 1995 only. Source: Human Development Report 1999
  • 17. 17 TABLE 2 Health Indicators for Selected HIPCs vis-a-vis G7 Countries Social Indicator: HIV Positive Percentage (adult rate) Supply of calories per day per capita Grams of proteins per day per capita Life expectancy at birth, total (years) Infant mortality rate (per 1000 births) Country: 1997 1997 1997 1997 1996 Year DPT %Measles % Sierra Leone 3.2 2035 44 37.2 73 97 26 28 Rwanda 12.8 2056 46 40.5 74 97 77 66 Burundi 8.3 1685 51 42.4 106 96 63 50 Uganda 9.5 2085 45 42.5 78 97 58 60 Malawi 14.9 2043 54 42.8 134 97 95 87 Zambia 19.1 1970 52 43.1 112 97 70 69 Ethiopia 9.3 1858 54 43.3 70 97 63 52 Guinea-Bissau 2.3 2430 49 43.8 60 97 63 51 Burkina Faso 7.2 2121 62 44.4 82 97 70 68 Central African Republic 10.8 2016 44 44.9 103 96 53 46 Mozambique 14.2 1832 35 45.5 105 97 61 70 Angola 2.1 1903 41 46.5 170 97 41 78 Guinea 2.1 2231 48 46.5 132 97 53 56 Cote d'Ivoire 10.1 2610 50 46.7 90 97 70 68 Niger 1.5 2097 61 46.9 114 97 28 42 Liberia 3.7 2044 64 47.3 100 96 45 44 Tanzania 9.4 1995 49 47.9 88 97 74 69 Congo 7.8 2143 43 48.5 81 97 18 20 Chad 2.7 2032 59 48.6 92 97 24 30 Togo 8.5 2469 59 48.8 33 97 33 38 Mali 1.7 2029 61 50.4 124 97 52 56 Democratic Republic of Congo - 1755 28 50.7 111 97 18 20 Kenya 11.6 1973 52 52.0 102 97 36 32 Senegal 1.8 2418 61 52.3 125 97 65 65 Benin 2.1 2487 59 53.4 84 97 78 82 Mauritania 0.5 2622 74 53.5 133 97 28 20 Lao PDR 0.0 2108 52 53.5 157 97 60 67 Nigeria 4.1 2735 62 53.5 129 97 45 69 Republic of Yemen - 2051 54 54.3 50 97 57 51 Madagascar 0.1 2021 46 57.5 137 96 73 68 Ghana 2.4 2611 49 60.0 130 97 60 59 Sao Tome and Principe - 2138 44 64.0 164 97 73 60 Average for 32 HIPCs 6.3 2144 52 49 104 54 54 United States* N/A 3699 112 76 8 95 94 89 Canada* N/A 3119 98 79 7 94 93 98 Japan 0.01 2932 96 80 4 96 100 94 United Kingdom 0.09 3276 95 77 6 97 95 95 France 0.37 3518 101 78 5 97 97 83 Germany 0.08 3382 96 77 5 96 45 75 Italy 0.31 3507 109 78 6 97 60 75 Average for G7 0.17 3348 101 78 6 83 87 Source : WHO Epidemiological Reports WDI 1999 WHO Epidemiological Reports / UN HD Report 1999 for US and Canada (data for 1997) * estimated % of population HIV positive (HIV Aids Surveillance Report 1998, CDC, US Department of Health and Human Services) Data not available for U.S. and Canada. FAOSTAT Nutrition Data/ Food Balance Suppy database, July 1999 WHO Immunization Profiles Percentage of Population Immunized
  • 18. 18 TABLE 3 Social Indicators for Selected HIPCs* : Changes in 1990s Supply of calories per day per capita Grams of proteins per day per capita Life Expectancy at Birth, (years) 1994 1997 Change 1994 1997 Change 1990 1997 Change Burkina Faso 2395 2121 -274 Burkina Faso 71.4 62.1 -9.3 Zambia 49.1 43.1 -6.0 Mali 2270 2029 -241 Uganda 53.3 44.6 -8.7 Kenya 57.1 52.0 -5.1 Democratic Republic of Congo 1926 1755 -171 Senegal 66.9 61.4 -5.5 Uganda 46.8 42.5 -4.3 Uganda 2254 2085 -169 Mauritania 78.9 74.1 -4.8 Cote d'Ivoire 49.8 46.7 -3.1 Somalia 1635 1566 -69 Rwanda 49.8 46.1 -3.7 Central African Republic 47.6 44.9 -2.7 Cameroon 2140 2111 -29 Democratic Republic of Congo 31.7 28.1 -3.6 Tanzania 50.1 47.9 -2.1 Guinea-Bissau 2455 2430 -25 Sao Tome and Principe 47.3 44.0 -3.3 Malawi 44.6 42.8 -1.9 Sao Tome and Principe 2161 2138 -23 Mali 64.0 61.1 -2.9 Ethiopia 45.0 43.3 -1.7 Tanzania 2016 1995 -21 Cameroon 50.1 47.9 -2.2 Togo 50.5 48.8 -1.7 Burundi 1690 1685 -5 Burundi 52.2 50.6 -1.6 Burundi 43.6 42.4 -1.2 Sierra Leone 2034 2035 1 Nicaragua 50.4 48.9 -1.5 Burkina Faso 45.4 44.4 -1.0 Zambia 1967 1970 3 Congo 44.2 43.1 -1.1 Congo 49.5 48.5 -1.0 Congo 2133 2143 10 Sierra Leone 44.6 43.5 -1.1 Democratic Republic of Congo 51.5 50.7 -0.8 Guinea 2219 2231 12 Somalia 53.9 52.8 -1.1 Rwanda 40.2 40.5 0.3 Nigeria 2719 2735 16 Republic of Yemen 55.4 54.4 -1.0 Angola 45.5 46.5 1.0 Madagascar 1999 2021 22 Ghana 50.0 49.2 -0.8 Guinea-Bissau 42.3 43.8 1.5 Kenya 1947 1973 26 Madagascar 47.0 46.3 -0.7 Niger 45.5 46.9 1.5 Myanmar 2824 2862 38 Guinea 48.3 47.6 -0.7 Benin 51.9 53.4 1.5 Republic of Yemen 2013 2051 38 Bolivia 56.6 56.5 -0.1 Vietnam 66.6 68.2 1.6 Bolivia 2129 2174 45 Kenya 52.0 52.0 0.0 Guyana 62.7 64.4 1.7 Nicaragua 2140 2186 46 Guinea-Bissau 48.6 48.7 0.1 Sao Tome and Principe 62.2 64.0 1.8 School Enrollment, secondary, gross (%) 1990 1994 Change 1990 1997 Change Sudan 24 14.4 -9.6 Guinea-Bissau 145.0220.0 75.0 Guyana 83.4 76.5 -6.9 Burkina Faso 105.4169.0 63.6 Ethiopia 14.2 11.1 -3.1 Kenya 61.8 74.0 12.2 Madagascar 18 15.5 -2.5 Zambia 107.3113.0 5.7 Uganda 13.2 11.7 -1.5 Congo 88.2 90.0 1.8 Cameroon 28 26.9 -1.1 Burundi 118.8119.0 0.2 Mozambique 7.6 6.7 -0.9 Malawi 135.4132.5 -2.9 Senegal 16.2 16 -0.2 Democratic Republic of Congo 95.8 92.0 -3.8 Niger 6.6 6.5 -0.1 Senegal 74.0 70.0 -4.0 Tanzania 4.9 5.3 0.4 Central African Republic 102.2 98.0 -4.2 Kenya 24.1 24.8 0.7 Angola 130.2125.0 -5.2 Cote d'Ivoire 22 22.8 0.8 Uganda 104.4 99.0 -5.4 Burundi 5.6 6.5 0.9 Guyana 63.8 58.0 -5.8 Chad 7.8 8.9 1.1 Togo 92.4 86.0 -6.4 Togo 23.6 25.1 1.5 Cote d'Ivoire 95.0 87.0 -8.0 Mauritania 13.7 15.3 1.6 Nigeria 85.2 77.0 -8.2 Guinea 10 11.7 1.7 Rwanda 132.4124.0 -8.4 Congo 52.9 55.3 2.4 Madagascar 103.0 94.0 -9.0 Benin 11.9 15 3.1 Lao PDR 108.2 98.0 -10.2 Mali 6.5 9.6 3.1 Niger 128.4118.0 -10.4 Zambia 24.1 27.4 3.3 Sao Tome and Principe 60.9 50.0 -10.9 Infant Mortality Rate (per 1,000 live births) Source: WHO Epidemiological Report. World Development Indicators 1999, FAOSTAT Nutrition Data, WHO Immunization Profiles, CID calculations. * The countries included in these tables are generally those which face the most severe deterioration in the delivery of social services in the 1990’s, rather than a representative sampling of the HIPC countries as a whole.
  • 19. 19 TABLE 4 Public Spending on Education: Nominal Values and % of GDP in 1990s Comparison of Selected HIPCs with G7 Countries Public Spending on education as % of GNP Public spending on education (million US$) Public spending on education per capita, age group 5-14 (US$) Country / Year 1995 1995 1995 Cote-d'Ivoire 5.2 468 240 Nigeria 0.9 233 9 Congo 6.2 106 152 Nicaragua 3.7 57 46 Malawi 5.5 78 29 Senegal 3.6 156 68 Burkina-Faso 1.4 33 11 Zambia 2.2 72 29 Mauritania 5.1 52 82 Kenya 6.8 591 73 Ethiopia 4.0 229 15 Honduras 3.6 142 92 Uganda 2.6 148 27 Burundi 4.1 40 47 Lao P.D.R. 2.3 41 32 Guyana 4.3 23 130 Bolivia 6.6 429 230 Average 4.0 170 77 Public spending on education (as % of GNP) Public spending on education (million US$) Public spending on education per capita, age group 5-14 (US$) Country / Year 1996 1996 1996 Canada 7.0 39865 9877 United States 5.4 401409 10181 Japan 3.6 185371 13578 UK 5.4 62213 8242 France 6.1 93550 12230 Germany 4.8 113501 12333 Italy 4.7 53604 9466 Average 5.3 135645 10844 Data for selected HIPCs from WDI 1999 database. Data on public spending on education as % of GNP in 1996 for G7 countries: HDR 1999 Data on GNP (at market prices, in current US $) : WDI 1999 database for selected HIPCs & WDI hardcopy for the G7 countries. Data on population 5-14 : UN / Population Division / Sex and Age Annual 1950-2050 (1998 Revision) electronic database
  • 20. 20 TABLE 5 1992 1993 1994 1995 1996 1997 St deviation Angola -5% -2% -5% -27% -27% -29% 13% Guinea -21% -22% -27% -43% -28% -35% 8% Guinea-Bissau -26% -14% -24% -46% -32% -22% 11% Guyana -73% -53% -56% -52% -42% 11% Honduras -57% -55% -71% -69% -75% -50% 10% Madagascar -34% -26% -26% -21% -23% -62% 15% Malawi -27% -20% -30% -39% -21% -19% 8% Mali -15% -21% -35% -24% -27% -19% 7% Mauritania -34% -54% -43% -44% -35% -36% 8% Mozambique -28% -41% -47% -58% -44% -24% 13% Nicaragua -16% -24% -41% -53% -38% -49% 14% Niger -11% -35% -36% -19% -18% 11% Sao Tome and Principe -24% -21% -37% -24% -48% -86% 25% Senegal -16% -11% -39% -36% -36% -30% 11% Tanzania -42% -35% -27% -28% -27% -15% 9% Uganda -66% -65% -40% -25% -24% -28% 20% Zambia -58% -69% -55% -379% -36% -33% 135% Average -33%-33%-38% -58%-34%-36% Debt Servicing Actually Paid as % of Total Government Revenue TABLE 6 1992 1993 1994 1995 1996 1997 St Deviation Benin 21% 26% 47% 22% 25% 2% 14% Burkina Faso 32% 33% 44% 34% 21% 13% 11% Burundi 48% 25% 7% 4% 3% -8% 20% Central African Republic 25% 43% 60% 18% 23% -8% 23% Chad 117% 48%127% 68% 91% 57% 32% Equatorial Guinea 34% 37% 23% 1% -5% 19% Ethiopia 21% 40% 14% 7% -2% 16% Guinea 32% 56% 25% 7% 8% 27% 18% Guinea-Bissau 143% 80% 73% 27% 61% 66% 38% Guyana -13% -6% -29%-24% 2% 13% Honduras 17% 38% -14%-24%-27% 19% 27% Kenya -3% -6% -20% -1% -9% 8% Lao PDR 34% 31% 21% 32% 68% 40% 16% Madagascar 9% 16% 8% 13% 22% 36% 11% Mali 32% 6% 31% 43% 17% 18% 13% Mauritania 26% 24% 26% 9% 19%-0.1% 11% Mozambique 71% 26% 52% 28% 54% 50% 17% Nicaragua 42% -4% 35%-0.5% 4% -21% 24% Niger 30% 27% 58% 2% 18% 20% Sao Tome and Principe 248%156%195%169%141% -15% 88% Tanzania 45% 7% 13% 5% -2% 18% 16% Togo 8% -4% 30% 17% 19% 13% Uganda 123%108% 47% 28% 24% 23% 45% Average 50%35%38%21%25%19% Net Transfers on Debt Actually Paid as % of Total Government Revenue For footnotes see Table 7.
  • 21. 21 TABLE 7 1992 1993 1994 1995 1996 1997 St Deviation Angola 17% 19% 12% 31% -13%-15% 19% Benin 84% 74% 103% 72% 62% 42% 21% Burkina Faso 91% 97% 148% 121% 97% 79% 25% Burundi 130% 93% 153% 133% 121% 69% 30% Central African Republic 98% 133% 213% 121% 205% 85% 54% Chad 211% 151% 326% 203% 204%143% 66% Cote d'Ivoire 7% 11% 66% 20% 9%-15% 27% Equatorial Guinea 103% 82% 74% 57% 35% 26% Ethiopia 99% 112% 74% 50% 31% 34% Ghana 53% 50% 34% 34% 23% 20% 14% Guinea 87% 101% 71% 65% 46% 55% 20% Guinea-Bissau 254% 208% 242% 186% 223%189% 28% Lao PDR 73% 69% 64% 81% 125% 88% 22% Madagascar 84% 84% 77% 75% 81%200% 49% Malawi 106% 87% 118% 129% 78% 48% 29% Mali 85% 53% 119% 102% 68% 73% 24% Mauritania 70% 99% 80% 62% 74% 53% 16% Mozambique 348% 252% 304% 316% 205%178% 67% Nicaragua 118% 38% 72% 78% 119% 13% 42% Niger 133% 149% 326% 127% 121% 87% Sao Tome and Principe 498% 386% 540% 494% 435%214% 118% Senegal 42% 39% 86% 48% 36% 35% 19% Tanzania 171% 139% 100% 63% 43% 61% 50% Togo 47% 37% 92% 80% 53% 23% Uganda 328% 218% 133% 102% 80% 74% 99% Zambia 95% 78% 35% 48% 37% 36% 25% Average 132%110%141%111%100%78% Net Resource Transfers as % of Total Government Revenue Sources (Tables 5, 6 and 7) : Global Development Finance 1999, IMF Country Reports - National Accounts, and CID calculations; further details on the governments' revenue calculations and a detailed list of sources available from CID.
  • 22. 22 TABLE 8 HIPC Country IMF Outstanding Debt (IMF Credit) IBRD Outstanding Debt Bilateral Outstanding Debt Regional Development Banks and Other Multilateral Organizations Outstanding Debt Total Relief Total Long-Term Debt Outstanding (including Private Creditors and IMF Credit) Total Relief as % of Total Long- Term Debt Outstanding Angola 0 0 2658 98 2755 8885 31% Benin 95 0 519 361 975 1488 66% Bolivia 248 37 1421 1714 3420 4818 71% Burkina Faso 92 0 132 367 592 1231 48% Burundi 28 0 149 306 482 1050 46% Cameroon 93 410 5644 445 6592 7979 83% Central African Republic 19 0 183 204 406 822 49% Chad 61 0 173 292 526 1000 53% Congo 34 73 2832 382 3321 4317 77% Cote d'Ivoire 450 1044 4605 1157 7256 12948 56% Democratic Republic of Congo 407 82 5604 872 6965 9023 77% Equatorial Guinea 13 0 101 44 158 222 71% Ethiopia 87 0 6613 928 7627 9513 80% Ghana 347 30 1075 532 1984 5305 37% Guinea 99 0 1380 635 2114 3107 68% Guinea-Bissau 12 0 451 166 629 851 74% Guyana 157 19 623 428 1228 1502 82% Honduras 46 275 1368 1532 3221 4215 76% Kenya 250 213 1860 540 2863 5683 50% Lao PDR 66 0 1431 458 1955 2313 85% Liberia 305 136 465 167 1072 1366 78% Madagascar 69 3 2166 447 2684 3941 68% Malawi 106 34 261 382 782 2179 36% Mali 176 0 1234 514 1924 2863 67% Mauritania 113 6 1075 560 1753 2150 82% Mozambique 189 0 3786 466 4441 5664 78% Myanmar 0 0 3017 447 3464 4640 75% Nicaragua 27 24 2854 1179 4084 4846 84% Niger 61 0 450 256 767 1488 52% Nigeria 0 2373 12998 1230 16602 22926 72% Republic of Yemen 250 0 1191 456 1898 3668 52% Rwanda 40 0 142 292 475 1034 46% Sao Tome and Principe 0 0 71 98 170 227 75% Senegal 292 14 1297 602 2205 3457 64% Sierra Leone 167 2 393 222 784 1060 74% Somalia 151 0 1095 317 1563 2004 78% Sudan 797 6 5521 797 7120 10291 69% Tanzania 246 34 2866 600 3746 6340 59% Togo 88 0 491 156 734 1295 57% Uganda 394 0 727 445 1566 3596 44% Vietnam 452 0 13274 259 13986 19291 72% Zambia 1138 62 2864 672 4736 6383 74% Total 7663 4877 97058 22024 131622 196979 65% Cancellation of Outstanding Old Debts from IMF, IBRD, Bilateral Creditors and Regional Development Banks All amounts in millions US$. Source: CID calculations; Global Development Finance 1999.
  • 23. 23 TABLE 9 Country: IBRD Debt Service and New Lending* IMF Debt Service and New Lending* Bilateral Creditors Debt Service** Regional Development Banks and Other Multilateral Organizations Debt Service** Total Savings on Public and Publicly Guaranteed Debt Old Transfers on Debt Before Relief New Transfers on Debt After Relief Angola 0 0 80 1 81 -713 -632 Benin 0 -1 18 21 37 6 43 Bolivia 24 12 59 218 313 49 362 Burkina Faso 0 -16 9 29 22 40 62 Burundi 0 8 0 12 20 -10 10 Cameroon 107 -23 146 132 362 -156 206 Central African Republic 0 8 0 1 9 -6 3 Chad 0 1 6 11 18 57 75 Congo 5 2 19 69 95 -72 23 Cote d'Ivoire 245 25 168 176 614 -635 -20 Democratic Republic of Congo 0 0 0 0 0 0 0 Equatorial Guinea 0 3 0 1 4 -3 2 Ethiopia 0 0 11 49 60 81 141 Ghana 15 171 61 46 293 76 368 Guinea 0 -22 33 49 60 118 178 Guinea-Bissau 0 -5 2 3 0 27 27 Guyana 7 2 56 35 100 -43 57 Honduras 73 9 106 141 329 149 477 Kenya 97 69 149 52 367 -336 31 Lao PDR 0 -3 12 7 16 115 131 Madagascar 4 -1 84 85 172 123 295 Malawi 8 8 14 15 45 76 121 Mali 0 -21 27 27 33 71 104 Mauritania 2 -11 36 51 78 -1 77 Mozambique 0 -19 47 23 51 197 248 Myanmar 0 0 45 15 60 76 136 Nicaragua 20 0 144 116 280 -135 146 Niger 0 -11 5 12 6 69 75 Nigeria 341 0 200 224 765 -1047 -282 Republic of Yemen*** 0 -140 6 64 -70 200 131 Rwanda*** 0 -17 2 5 -10 72 62 Sao Tome and Principe 0 0 2 3 5 -1 4 Senegal 9 17 89 48 163 34 197 Sierra Leone 0 -6 13 4 10 32 43 Sudan 0 57 0 0 58 -53 5 Tanzania 24 -53 6 44 22 186 208 Togo 0 -3 11 15 23 17 39 Uganda 0 0 76 28 104 156 260 Vietnam 0 63 255 8 326 338 664 Zambia 41 -8 91 66 189 30 220 Total Savings 1021 98 2086 1905 5110 -813 4298 Savings on the Cancellation of Outstanding Old Debts from IMF, IBRD, Bilateral Creditors & Regional Development Banks, and Phasing Out New Lending from IMF and IBRD Source: CID calculations; Global Development Finance. All amounts in millions US$. * For the IMF and the IBRD loans the savings represent the total debt service (interest and amortization payments) and the new lending during the year (total debt transfers) ** For the Bilateral Creditors and the Regional Development Banks and Other Multilateral Organizations Debt loans the savings represent the total debt service (interest and amortization payments) only. The second category excludes the World Bank and the IMF, which are accounted for separately. *** For the Republic of Yemen and Rwanda the savings are negative because both countries paid little or no interest on bilateral and IBRD loans and had positive net transfers on debt from the IMF in 1997.