Lk2519761985
•
0 likes•196 views

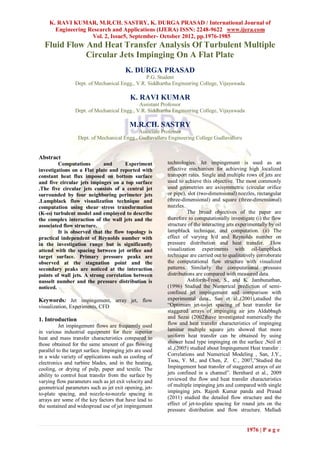
This document summarizes a study on fluid flow and heat transfer from multiple circular jets impinging on a flat plate. Computational fluid dynamics simulations were performed using the k-ω SST turbulence model to analyze the flow structure and pressure distribution. Experiments using an oil-lampblack visualization technique were also conducted for comparison. The simulations examined the effects of varying the jet-to-plate spacing ratio (h/d) from 0.5 to 4 and the Reynolds number from 9075 to 13624. It was observed that the flow topology was independent of Reynolds number but depended strongly on h/d. Primary pressure peaks occurred at stagnation points and secondary peaks at wall jet interaction regions.

Recommended
Recommended
More Related Content
What's hot
What's hot (18)
Viewers also liked
Viewers also liked (20)
Similar to Lk2519761985
Similar to Lk2519761985 (20)
Recently uploaded
Recently uploaded (20)
Lk2519761985
- 1. K. RAVI KUMAR, M.R.CH. SASTRY, K. DURGA PRASAD / International Journal of Engineering Research and Applications (IJERA) ISSN: 2248-9622 www.ijera.com Vol. 2, Issue5, September- October 2012, pp.1976-1985 Fluid Flow And Heat Transfer Analysis Of Turbulent Multiple Circular Jets Impinging On A Flat Plate K. DURGA PRASAD P.G. Student Dept. of Mechanical Engg., V.R. Siddhartha Engineering College, Vijayawada K. RAVI KUMAR Assistant Professor Dept. of Mechanical Engg., V.R. Siddhartha Engineering College, Vijayawada M.R.CH. SASTRY Associate Professor Dept. of Mechanical Engg., Gudlavalleru Engineering College Gudlavalleru Abstract Computations and Experiment technologies. Jet impingement is used as an investigations on a Flat plate and reported with effective mechanism for achieving high localized constant heat flux imposed on bottom surface transport rates. Single and multiple rows of jets are and five circular jets impinges on a top surface used to achieve this objective. The most commonly .The five circular jets consists of a central jet used geometries are axisymmetric (circular orifice surrounded by four neighboring perimeter jets or pipe), slot (two-dimensional) nozzles, rectangular .Lampblack flow visualization technique and (three-dimensional) and square (three-dimensional) computation using shear stress transformation nozzles. (K-ω) turbulent model and employed to describe The broad objectives of the paper are the complex interaction of the wall jets and the therefore to computationally investigate (i) the flow associated flow structure. structure of the interacting jets experimentally by oil It is observed that the flow topology is lampblack technique, and computation. (ii) The practical independent of Reynolds number with effect of varying h/d and Reynolds number on in the investigation range but is significantly pressure distribution and heat transfer. .Flow attend with the spacing between jet orifice and visualization experiments with oil-lampblack target surface. Primary pressure peaks are technique are carried out to qualitatively corroborate observed at the stagnation point and the the computational flow structure with visualized secondary peaks are noticed at the interaction patterns. Similarly the computational pressure points of wall jets. A strong correlation between distributions are compared with measured data. nusselt number and the pressure distribution is Ashforth-Frost, S., and K. Jambunathan, noticed. (1996) Studied the Numerical prediction of semi- confined jet impingement and comparison with Keywords: Jet impingement, array jet, flow experimental data., San et al.,(2001),studied the visualization, Experiments, CFD “Optimum jet-to-jet spacing of heat transfer for staggered arrays of impinging air jets Aldabbagh 1. Introduction and Sezai (2002)have investigated numerically the Jet impingement flows are frequently used flow and heat transfer characteristics of impinging in various industrial equipment for their superior laminar multiple square jets showed that more heat and mass transfer characteristics compared to uniform heat transfer can be obtained by using those obtained for the same amount of gas flowing shower head type impinging on the surface ,Neil et parallel to the target surface. Impinging jets are used al.,(2005) studied about Impingement Heat transfer : in a wide variety of applications such as cooling of Correlations and Numerical Modeling , San, J.Y., electronics and turbine blades, and in the heating, Tsou, Y. M., and Chen, Z. C., 2007,”Studied the cooling, or drying of pulp, paper and textile. The Impingement heat transfer of staggered arrays of air ability to control heat transfer from the surface by jets confined in a channel”. Bernhard et al., 2009 varying flow parameters such as jet exit velocity and reviewed the flow and heat transfer characteristics geometrical parameters such as jet exit opening, jet- of multiple impinging jets and compared with single to-plate spacing, and nozzle-to-nozzle spacing in impinging jets. Rajesh Kumar panda and Prasad arrays are some of the key factors that have lead to (2011) studied the detailed flow structure and the the sustained and widespread use of jet impingement effect of jet-to-plate spacing for round jets on the pressure distribution and flow structure. Malladi 1976 | P a g e
- 2. K. RAVI KUMAR, M.R.CH. SASTRY, K. DURGA PRASAD / International Journal of Engineering Research and Applications (IJERA) ISSN: 2248-9622 www.ijera.com Vol. 2, Issue5, September- October 2012, pp.1976-1985 R.Ch. Sastry, et al., (2011), studied the fluid flow on (7) Diverging section (8) Plenum chamber (9) a flat plate with three rectangular impinging slots Impingement chamber jets B 32 2. Experimental Details mm The schematic layout of the experimental 32 set up is shown in Fig.1. Air is supplied by a mm A A 160 Fig.2 Semi- mm reciprocating air compressor through a calibrated Rotameter. Flow regulating and bypass valves are placed in supply line to control the flow rate. Air enters into the plenum chamber through diverging 160 mm B section to reduce the pressure fluctuations in air. A seamless rectangular chamber of 600 mm length, 300 mm width and 6 mm thickness, is confining plate with Dimensions used as plenum chamber, whose size is large enough The impingement plate is of five millimeter to is 32mm. Air ejects as jet through the orifice and thick acrylic sheet of 160x160 mm is used. In order impinges on the target surface The impingement to determine the non dimensional pressure plate is of 160x160 mm in dimension. Chamber is a distribution on the target surface, a close array of semi-confining plate, which contains five circular pressure tap holes of 0.8 mm diameter is drilled orifices of dimensions 8 mm. Air ejects as jet along the plate. The tap holes are closely placed through the orifices and impinges on the target because of the steep change of pressure expected surface. Around the centre jet, the four perimeter due to jet interactions. Multi tube manometer is used jets are placed 90º apart from each other. Distance for wall static pressure measurement. Impingement between the centre jet and perimeter jets stabilize plate is placed over a stand, whose height can be the flow and reduce the fluctuations. Air from varied by a lead screw mechanism to obtain the plenum chamber enters into the impingement air required h/d. chamber which is made of 160 mm width, 160 mm Flow visualization experiments are carried height and 4mm thick mild steel square chamber. out with oil-lampblack technique. The oil and The exit side of the impingement air chamber is a lampblack powder are mixed in proper proportion semi-confining plate, which contains five circular lampblack powder are mixed in proper proportion orifices of dimensions 8 mm. Air ejects as jet and painted on the target surface. The lampblack through the orifices and impinges on the target coated target surface is kept beneath the plenum surface. Around the centre jet, the four perimeter cylinder. The air jets, after impinging on the target jets are placed 90º apart from each other. Distance surface, leave traces of the flow path lines on the between the centre jet and perimeter jets is 32mm. plate. These pictures are captured by a camera. Air ejects as jet through the orifice and impinges on the target surface The impingement plate is of 3. Computational Methodology 160x160 mm in dimension. Figure 3 shows the geometric model that mimics the physical model used for experiment of 8 7 6 Interest. It consists of a semi-confined plate and160x160 mm square impingement plate. The 9 semi-confining plate consists of five circular jets of 8 mm in size. The jet ejects from the circular orifice to impinge on the solid plate. Distance between the 1 impingement plate and the jet is varied to obtain the 5 h/d ratio from 0.5 to 4. The computational mesh suitable for finite volume method is generated by automatic grid generating tool GAMBIT 2.3.16. Non-uniform grids with clustered nodes are generated in the regions where steep gradient of velocity is expected. Optimum grid size is selected after the grid independence study. For the purpose of computation, a specified velocity inlet condition is imposed at the entry to the 3 orifice. A free stream turbulence intensity of 10% is 4 chosen at the exit of orifice. The jet after hitting the 2 plate, exits into the atmosphere in the transverse Fig. 1 Schematic diagram of experimental set-up direction all around the plate periphery, where (1) Test section (2) Compressor (3) Flow control constant (ambient) pressure outlet condition is valve (4) Bypass line (5) Rotameter (6) Hoss pipe imposed. A constant heat flux value is specifies at 1977 | P a g e
- 3. K. RAVI KUMAR, M.R.CH. SASTRY, K. DURGA PRASAD / International Journal of Engineering Research and Applications (IJERA) ISSN: 2248-9622 www.ijera.com Vol. 2, Issue5, September- October 2012, pp.1976-1985 the bottom surface of the target plate and periphery t is circumferentially insulated .All the input values Where Γk = µ + , Γ =µ+ are those in experiment. k t k Orifice of 8mm dia k ,1 1.176 , 2 .0 , 2 ,1 Semi,confining 1.0 , , 2 1.168 plate. Boundary conditions used for the present study are, i) No slip boundary condition Vw = 0, at z = 0 ii) Flow inlet condition, Vx, Vy =0 ,V Z h =Voe Z iii) Entrainment condition, P= Patm The parameters investigated in the present study include (i) effect of h/d varied as 0.5, 1, 2 and 4 (ii) effect of jet exit Reynolds number, varied as 9075, 10594, Fig. 3 Schematic Diagram of the Geometry and 12106,13624. Z Boundary Conditions Semi confining 3.1. Mesh sensitivity plate. Mesh sensitivity study is carried out to ascertain the The three dimensional flow is formulated accuracy of the numerical results. The mesh with the following assumptions: (i) the fluid is sensitivity study is carried out by analyzing the incompressible, (ii) the fluid properties are constant variation of static pressure distribution on the target and (iii) the mean flow is steady. The governing plate along line A-A as shown in fig: it shows the equations used for simulations are the Reynolds pressure distribution along A-A for different mesh averaged continuity and momentum equations for sizes. It is clear from the table that difference in the modeling the turbulence quantities. A finite volume value of pressure with 1.58million and 1.74 million based solver Fluent 6.3 is used for solving the is not significant. To get advantage of computational governing continuity, momentum and turbulence- time, mesh 1.58 million is used for this case. Similar model equations. SIMPLE algorithm is used for mesh sensitivity study is done for all other cases. pressure velocity coupling. The solution is Table-1 considered to be converged when the residual is in Mesh Size in Million cells Static Pressure (Pa) the order of 10-4 for continuity, momentum, turbulence equations and 10-8 for energy equations. 6.9 130 The κ-ω SST model is adopted for simulation. 1.52 400 Further area weighted average temperature of the 1.589 430 impingement surface is continuously monitored, so 1.745 431 that the variation will be within 1% for 1000 consecutive iterations 4. Results and Discussion Continuity equation 4.1. Flow Structure of Impinging Jet .(u ) 0 As each of fluid jet eject out of the orifice Momentum equation with parabolic velocity profile a continuous reduction in velocity taken place from its center to . u 1 p u 0 2 the outer boundary .It is known that with increasing distance from exit and increasing momentum Turbulent kinetic energy(K) equation exchange between the jet and the ambient ,the free ( k i ) k )+G – Y + S boundary of jet broadens while the potential core = (Γk x j k k k contacts on the impingement surface ,the wall jets x i x i are formed and spread radially. The wall jets d emanating from each impinged form a collusion Specific dissipation rate (ω) equation ( front due to interaction with neighbors. x Consequently an up wash flow taken place. Thus overall structure consists of (1) potential core (2) ui) = (Γω ) + Gω - Yω+Dω+ Sω x j x j shear layer (3) wall jets (4) up wash flow etc. Figure 4 shows the velocity contours for the four jet-to- plate spacing to Jet diameter ratio namely h/d = 0.5, 1, 2, 4 for Reynolds number 9075. 1978 | P a g e
- 4. K. RAVI KUMAR, M.R.CH. SASTRY, K. DURGA PRASAD / International Journal of Engineering Research and Applications (IJERA) ISSN: 2248-9622 www.ijera.com Vol. 2, Issue5, September- October 2012, pp.1976-1985 (a) h/d=0.5, (b) h/d=1, (c) h/d=2, (d) h/d=4 (a) This low velocity jet forms another wall jets on the semi confining plate, shown in Fig. 4 (a & b).But no such thing happens for higher h/d, because (b) the second jet diffuses out by the time it reaches the top surface, shown in Fig.4 (c &d). Fig.5 shows velocity contours along the plane B-B. The wall jets, thus separated from each other in the impingement plane by the dividing stagnation line, are shown in (c) Figs.6 and 7, by computational surface flow lines for four h/d values of 0.5, 1, 2 and 4. The computed and experimentally visualized flow structures qualitatively agree well and hence confirm the correctness of the computation. Figure 9 shows the three dimensional separated flow. It is observed that flow separation occurs corresponding to the (d) separation line. Mild asymmetry is observed however numerical values are perfectly symmetrical. It is observed that the position of the attachment line shifts close to the central jet as the Fig. 4 Computed Velocity contours along plane A- h/d increase. A, for Re = 9075 (a) h/d=0.5, (b) h/d=1, (c) h/d=2, (d) h/d=4 It can be clearly seen that in case of h/d =0.5&1 the potential core is extended up to target surface shown in Fig.4 (a & b). Where as in case of h/d= 2&4 the potential core region vanishes by the time flow reaches the target surface, shown in Fig.4(c & d). These differences in velocity pattern happen because of the variation in momentum exchange between the fluid jet and ambient. The wall jets from adjacent jets when interacts with each other a upwash flow takes place as shown in Fig.4 when h/d value lower (h/d =0.5 &1) the interaction prominent, besides as the distance is less the upwash flow fountain reaches the top wall. (a) (a) (b) (b) (c) (d) (a) h/d=0.5, (b) h/d=1, (c) h/d=2, (d) h/d=4 Fig. 6 Computed flow structure visualized as traces on impinging plate, for Re 9075 (c) (d) Fig. 5 Computed Velocity contours along B-B plane, for Re = 9075 1979 | P a g e
- 5. K. RAVI KUMAR, M.R.CH. SASTRY, K. DURGA PRASAD / International Journal of Engineering Research and Applications (IJERA) ISSN: 2248-9622 www.ijera.com Vol. 2, Issue5, September- October 2012, pp.1976-1985 Fig. 7 Flow structure visualized as traces of oil lamp black on impingement plate, for Re 9075 (a) h/d=0.5 (b) h/d=1(c) h/d=2(d) h/d=4 This may be because the flow in case of low h/d (0.5 &1) has more momentum compare to higher h/d, hence the centre jet easily moves the surrounding fluid (a) (b) (c) (d) Fig 8 Path lines colored by velocity magnitude for Re = 9075 on plane A-A (a) h/d=0.5, (b) h/d=1, (c) h/d=2, (d) h/d=4 4.2. Comparison of Experimental and experimental and computation along A-A Computational Static Pressure Distribution the pressure distribution is observed on the Figure 9 shows the comparison of non impingement surface both from experiment and dimensional pressure distribution, between computation agreed with each other with in 3 % 1.1 Computation Computation Non Dimensional Pressure,P* 0.9 0.7 0.5 0.3 0.1 -0.1 -10 -5 0 5 10 Non Dimensional Axial Distance,x/d Fig. 9 Comparison non dimensional pressure 1980 | P a g e
- 6. K. RAVI KUMAR, M.R.CH. SASTRY, K. DURGA PRASAD / International Journal of Engineering Research and Applications (IJERA) ISSN: 2248-9622 www.ijera.com Vol. 2, Issue5, September- October 2012, pp.1976-1985 Experimental with Computation lower h/d is more prominent hence larger peaks are observed for lower h/d value of unity. The position 4.3. Effect of Plate Spacing to Jet Diameter Ratio of secondary peak depends upon the position of Figure 10 shows the variation of non interaction point of wall jet and the size of the dimensional pressure distribution with different central square. Secondary peak moves closer to plates spacing to jet diameter ratio (h/d) for Re = center jet with increase in h/d. 9075 in line A – A peak pressure is observed at the point of stagnation of each jet. Up wash fountain for h/d 0.5 h/d 1 h/d 2 h/d 4 1 Non Dimensional Pressure P* 0.8 0.6 0.4 0.2 0 0 2 4 6 8 -0.2 Non Dimensional Axial Distance ,x/d ℎ Fig. 10 Non-dimensional Pressure distribution on line A-A for varying 𝑑 and for Re = 9075 h/d 0.5 h/d 1 h/d 2 h/d 4 1.1 Non Dimensional Pressure P* 0.9 0.7 0.5 0.3 0.1 -0.1 0 2 4 6 8 Non Dimensional Axial Distance ,x/d Fig. 11 Non-dimensional Pressure distribution on 4.4. Variation of Nusselt Number with Non- ℎ dimensional axial distance line B-B for varying 𝑑 and for Re = 9075 The effect of plate spacing to jet diameter Figure 11 shows the variation of non dimensional ratio (h/d) for Re=9075 and q =3000 w/m2 in plane pressure distribution in line B-B with different h/d A-A as shown in figure. It shows that when h/d .Here the behavior of pressure distribution in the increases the Nusselt number at the stagnation stagnation zone is similar to the one observed in line region reduces for h/d=2 the maximum Nusselt A-A. However, unlike line A-A, up wash fountain number value in the stagnation region is lower are prominent for high h/d hence the secondary compared to lower (h/d=1) by absolutely 6-7%. The peaks are observed are large for high h/d. difference among mussel number at the center jet is 1981 | P a g e
- 7. K. RAVI KUMAR, M.R.CH. SASTRY, K. DURGA PRASAD / International Journal of Engineering Research and Applications (IJERA) ISSN: 2248-9622 www.ijera.com Vol. 2, Issue5, September- October 2012, pp.1976-1985 less compared to the perimeter jet, because the shear layer produced by jet nozzle exists converges perimeter jets are more affected by low temperature towards the stagnation zone and hence the Nusselt quiescent ambient air. If h/d is further increased the number increases at the stagnation point. h/d 0.5 h/d 1 h/d 2 h/d 4 1 Nusselt Number, Nu 0.8 0.6 0.4 0.2 0 0 2 4 6 8 Non Dimensional Axial Distance x/d Fig. 12 Nusselt Number distribution on line A-A; ℎ for varying 𝑑 , q=3000 w/m2 k and Re=9075 h/d 0.5 h/d 1 h/d 2 h/d 4 1 Nusselt Number, Nu 0.8 0.6 0.4 0.2 0 0 2 4 6 8 Non Dimensional Axial Distance ,x/d pressure peak for higher for high Reynolds number. Fig. 13 Nusselt Number distribution on line B-B; for At any Reynolds numbers the non dimensional 𝑯 2 pressure has the high value at the stagnation region varying 𝑫 for Re=9075,q=3000w/m . and reduces radially. Second peak is observed at the second stagnation point where neighboring wall jets 4.4. Effect of Reynolds number collide. Position of second peak is independent of Figure 14 illustrates the dependence of non Reynolds number. dimensional pressure distribution on Reynolds number for h/d = 2 on line A-A. As expected the 1982 | P a g e
- 8. K. RAVI KUMAR, M.R.CH. SASTRY, K. DURGA PRASAD / International Journal of Engineering Research and Applications (IJERA) ISSN: 2248-9622 www.ijera.com Vol. 2, Issue5, September- October 2012, pp.1976-1985 Re 9075 Re 10594 Re 12106 Re 13624 1 Non Dimensional Pressure,P* 0.8 0.6 0.4 0.2 0 -10 -5 0 5 10 -0.2 Non Dimensional Axial Distance ,x/d Fig. 14 Effect of Reynolds number on non dimensional pressure distribution on line A-A for h/d=2 Re 9075 Re 10594 Re 12106 Re 13624 1 Non Dimensional Pressure,P* 0.8 0.6 0.4 0.2 0 -8 -3 2 7 -0.2 Non Dimensional Axial Distance ,x/d 4.5. Effect of Re on Nusselt number: Figure 16 illustrate the dependence of Nusselt Fig. 15 Effect of Reynolds number on non number on Reynolds number for h/d=2 and q=3000 dimensional pressure distribution on line B-B for w/m2 on line A-A. As expected at any location heat h/d=2 transfer rate is higher for high Reynolds number. As Figure 15 shows the variation of non dimensional the flow is independent of Reynolds number, in the pressure distribution with different Reynolds range of 9075-13624. The quantitative behavior of number on line B-B. The secondary peak is formed Nusselt number. clearly indication that these trends by the interaction of wall jets is higher for high are independent of Reynolds number .especially the Reynolds number. position of secondary peak is Nusselt number is found at the same radial location. 1983 | P a g e
- 9. K. RAVI KUMAR, M.R.CH. SASTRY, K. DURGA PRASAD / International Journal of Engineering Research and Applications (IJERA) ISSN: 2248-9622 www.ijera.com Vol. 2, Issue5, September- October 2012, pp.1976-1985 Re 9075 Re 10594 Re 12106 Re 13624 140 120 100 NusseltNumber Nu 80 60 40 20 0 -10 -5 0 5 10 Non Dimensional Axial Distance x/d ℎ Fig. 16 Nusselt Number distribution on line A-A for varying Re for 𝑑 =2 ,q =3000w/m2k Re 9075 Re 10594 Re 12106 Re 13624 140 120 Nusselt Number Nu 100 80 60 40 20 0 -10 Non Dimensional0 -5 Axial Distance ,x/d5 10 3. The Nusselt on the surface is found to vary Fig. 17 Nusselt Number in accordance with the flow structure. Peaks are ℎ noticed in primary and secondary stagnation region. distribution on line B-B; for varying Re for 𝑑 =2 ,q 2 Heat transfer is low at flow separation point. It is =3000w/m k observed that local heat transfer rate is higher for lower h/d. Conclusion 4. Heat transfer rate increases with Reynolds 1. The feature of the complex flow structure number and position of secondary peak found to be are study using both oil lamp black technique and independent of Reynolds number. computation .computational obtained topology of 5. The heat transfer variations are clearly co- flow pattern on impingement surface agree well relatable not only with flow topology but also with with the experiment. It is observed that the flow dimensionless pressure distribution. topology is independent of the variation of Reynolds Nomenclature number in the range 9075-13624, but it altered with d Diameter of Jet, m variation of h/d.. h Jet-to-plate distance, m 2. The non dimensional pressure distribution P Static Pressure, Pa obtained from experiment is similar to computation Nu Nusselt number,Nu .This validates the usage of shear stress transport P* Non dimensional pressure (SST) (K-ω) turbulence model for the chosen Re Reynolds number, ρvd/ µ problem. Voe Orifice exit jet velocity, m/s Vz Vertical velocity, m/s 1984 | P a g e
- 10. K. RAVI KUMAR, M.R.CH. SASTRY, K. DURGA PRASAD / International Journal of Engineering Research and Applications (IJERA) ISSN: 2248-9622 www.ijera.com Vol. 2, Issue5, September- October 2012, pp.1976-1985 Greek Symbols square jets”, International Journal of Heat κ Turbulent kinetic energy, m²/s² and Fluid Flow, Vol.23, pp.509-518. µ Dynamic viscosity, kg/m-s [4] Neil, Z., and Noam L., 2005, ρ Density, kg/m³ “Impingement Heat Transfer: Correlations Specificdissipationrate,1/sec and Numerical Modeling”,ASME Journal ν Kinematicviscosity,m²/s of Heat Transfer ,Vol. 127,pp. 544-553. Subscript [5] San, J.Y., Tsou, Y. M., and Chen, Z. C., f Fluid 2007,”Impingement heat transfer of o Orifice exit staggered arrays of air jets confined ina w Wall channel”, International Journal of Heat Abbreviations and Mass Transfer, Volume 50, PP.3718- SST Shear Stress Transport 3727. [6] Bernhard, W., and Sebastian S., 2009, References “Multiple Jet impingement -A Review”, [1] Ashforth-Frost, S., and K. Jambunathan, Int. Symp. On Heat Transfer in Gas (1996) Numerical prediction of semi- Turbine Systems, Turkey confined jet impingement and comparison [7] Rajesh Kumar panda and with experimental data, International B.V.S.S.S.Prasad.,2011 “Flow Journal for Numerical methods in fluids, visualization and conjugate heat transfer Vol.23, 295-306 study from Shower head impinging jets “ [2] San, J.Y.,and M.D.Lai,2001, “Optimum Proceeding of ASME-Turbo Expo 2011 jet –to-jet spacing of heat transfer for ,Canada. staggered arrays of impinging air jets [8] Malladi R.Ch. Sastry, and A.V.S.S.K.S “,International Journal of Heat and Mass Gupta., B.V.S.S.S.Prasad., 2011,”Study Transfer,44(21),pp.3997-4007. of fluid flow on a flat plate with three [3] Aldabbagh, L.B.Y., and Sezai, I., 2002, rectangular impinging slots jets “Numerical simulation of three- “Proceedings of the 38th National dimensional laminar multiple impinging Conference on Fluid Mechanics and Fluid Power 2011”, MANIT, Bhopal. 1985 | P a g e