Equity Market Update | March 2023
•
0 likes•19 views

This summer, gauge the temperature of global and domestic markets with ICICI Prudential Equity Market Update. Read on to get a thorough understanding of global and domestic equity market to help you navigate your equity investments. #ICICIPrudentialMutualFund #Equity #Investments #MutualFunds

Recommended
Recommended
More Related Content
Similar to Equity Market Update | March 2023
Similar to Equity Market Update | March 2023 (20)
More from iciciprumf
More from iciciprumf (20)
Recently uploaded
Recently uploaded (20)
Equity Market Update | March 2023
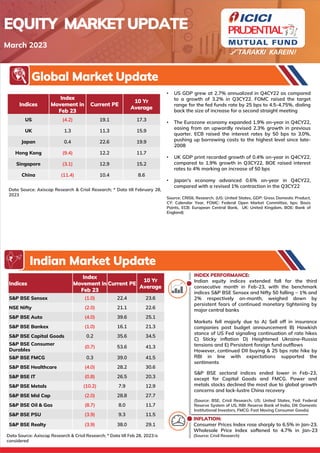
- 1. INDEX PERFORMANCE: Indian equity indices extended fall for the third consecutive month in Feb-23, with the benchmark indices S&P BSE Sensex and Nifty 50 falling ~ 1% and 2% respectively on-month, weighed down by persistent fears of continued monetary tightening by major central banks Markets fell majorly due to A) Sell off in insurance companies post budget announcement B) Hawkish stance of US Fed signaling continuation of rate hikes C) Sticky inflation D) Heightened Ukraine-Russia tensions and E) Persistent foreign fund outflows However, continued DII buying & 25 bps rate hike by RBI in line with expectations supported the sentiments S&P BSE sectoral indices ended lower in Feb-23, except for Capital Goods and FMCG. Power and metals stocks declined the most due to global growth concerns and lack-lustre China recovery (Source: BSE, Crisil Research. US: United States, Fed: Federal Reserve System of US, RBI: Reserve Bank of India, DII: Domestic Institutional Investors, FMCG: Fast Moving Consumer Goods) EQUITY MARKET UPDATE March 2023 Data Source: Axiscap Research & Crisil Research; * Data till Feb 28, 2023 is considered Data Source: Axiscap Research & Crisil Research; * Data till February 28, 2023 Indices Index Movement in Feb 23 Current PE 10 Yr Average US (4.2) 19.1 17.3 UK 1.3 11.3 15.9 Japan 0.4 22.6 19.9 Hong Kong (9.4) 12.2 11.7 Singapore (3.1) 12.9 15.2 China (11.4) 10.4 8.6 Global Market Update Indian Market Update • US GDP grew at 2.7% annualized in Q4CY22 as compared to a growth of 3.2% in Q3CY22. FOMC raised the target range for the fed funds rate by 25 bps to 4.5-4.75%, dialing back the size of increase for a second straight meeting • The Eurozone economy expanded 1.9% on-year in Q4CY22, easing from an upwardly revised 2.3% growth in previous quarter. ECB raised the interest rates by 50 bps to 3.0%, pushing up borrowing costs to the highest level since late- 2008 • UK GDP print recorded growth of 0.4% on-year in Q4CY22, compared to 1.9% growth in Q3CY22. BOE raised interest rates to 4% marking an increase of 50 bps • Japan's economy advanced 0.6% on-year in Q4CY22, compared with a revised 1% contraction in the Q3CY22 Source: CRISIL Research. (US: United States, GDP: Gross Domestic Product, CY: Calendar Year, FOMC: Federal Open Market Committee, bps: Basis Points, ECB: European Central Bank, UK: United Kingdom, BOE: Bank of England) Indices Index Movement in Feb 23 Current PE 10 Yr Average S&P BSE Sensex (1.0) 22.4 23.6 NSE Nifty (2.0) 21.1 22.6 S&P BSE Auto (4.0) 39.6 25.1 S&P BSE Bankex (1.0) 16.1 21.3 S&P BSE Capital Goods 0.2 35.6 34.5 S&P BSE Consumer Durables (0.7) 53.6 41.3 S&P BSE FMCG 0.3 39.0 41.5 S&P BSE Healthcare (4.0) 28.2 30.6 S&P BSE IT (0.8) 26.5 20.3 S&P BSE Metals (10.2) 7.9 12.9 S&P BSE Mid Cap (2.0) 28.8 27.7 S&P BSE Oil & Gas (8.7) 8.0 11.7 S&P BSE PSU (3.9) 9.3 11.5 S&P BSE Realty (3.9) 38.0 29.1 INFLATION: Consumer Prices Index rose sharply to 6.5% in Jan-23. Wholesale Price Index softened to 4.7% in Jan-23 (Source: Crisil Research)
- 2. DOMESTIC & GLOBAL DEVELOPMENTS: India’s GDP growth slowed sequentially to 4.4% in Q3FY23, compared with 6.3% growth in Q2FY23 India’s structural story remains strong due to high focus of Govt on capex, high GST collections, consistent efforts towards Govt reforms and China + 1 theme. However, impact of global slowdown, sticky and high global interest rates remain watchful triggers India continues to stand strong vis-à-vis its select Emerging & Developed Market peers despite growth moderation. Broader domestic economic activity has remained resilient with sequential increase in manufacturing capacity utilization. FPIs were the net sellers while DIIs bought equities but at a slower pace Global cues such as US and UK central bank actions, geopolitical risks and foreign capital flows may continue to influence equity markets. (Source: Crisil Research and NSDL. FPI: Foreign Portfolio Investments, DII: Domestic Institutional Investment, FY: Financial year, GDP: Gross Domestic Product, GST: Goods & Services Tax, Govt. : Government of India ) Indian Market Update Outlook & Triggers Globally, equity markets ended February 2023 on a mixed note. In the US, stocks corrected after a brief rally in Jan 2023 as hotter-than- expected economic data increased risk of further rate hikes by the US Fed. The S&P500 (USA) fell 2.61%; the tech-heavy Nasdaq100 (USA) fell 0.5% in Feb 2023. (Source: S&P; Nasdaq). On the contrary, optimism prevailed across the Atlantic - the UK’s FTSE index grew 1.35% while its European counterpart, STOXX 600, rose 1.74%. China equities remained muted in Feb 2023 due to heightened geopolitical tensions with the US. Upbeat factory output data indicated sustained economic recovery. (Source: FTSE; STOXX; SSE) Among the top gainers were France (+2.6%), Germany (+1.6%) and Taiwan (+1.6%). Meanwhile, Hong Kong (-9.4%), Brazil (-6.6%) and Mexico (-3.6%) were the most affected. (Source: Kotak Research) Foreign portfolio investors continued to withdraw from domestic equities. However, net outflows tapered to Rs.5,294 crore in Feb 2023 against Rs.28,852 crore in Jan 2023. (Source: NSDL) The market barometer indices S&P BSE Sensex and NSE Nifty50 fell 1.0% and 2.0%, respectively, in Feb 2023. Sector-wise, the BSE FMCG Index (+0.3%) and BSE Capital Goods (+0.2%) were the only gainers. Among laggards, BSE Power Index fell 15.6%, BSE Metals (- 10.2%) and BSE Oil & Gas (-8.7%). (Source: BSE and NSE) Our view going forward: • Indian equity market has underperformed Global and Asian Markets in the last few months, resulting in moderation of premium. However, we believe there is some more head-room for valuations to normalize compared to long-term average and relative to Emerging & Developed Market peers. • India’s long-term structural story is strong and its macros are also much better placed in comparison to other major economies. The Union Budget’s focus on higher Capital Expenditure by the Centre & States; push for consumption through lower taxes and goal of fiscal consolidation, together underpin India’s growth. • Other positives include healthy tax collection, strong govt. reforms and India as one of the favored destination for China +1 theme. • Global cues such as US and UK central bank actions, geopolitical risks and foreign capital flows may continue to influence equity markets. • We remain positive on sector/themes which are closely related to India economy like Banks, Auto, Infrastructure and Capital Goods. We like Pharma, where the valuations and earnings remains reasonable. • We are positive on staggered or SIP mode of investment for capturing the long-term growth opportunity. U.S. – United States of America; Bps – basis points; SIP – Systematic Investment Plan, FOF: Fund of Funds, UK: United Kingdom Earnings Growth (%) (Consolidated) FY22 FY23E FY24E Sensex 25.4 6.8 15.5 Macro Indicators Latest Update Previous Update GDP (YoY%) 4.4% (3QFY23) 6.3% (2QFY23) IIP (YoY%) 4.3% (Dec 2022) 7.1% (Nov 2022) Crude ($ bbl) 84 (Feb 28) 84 (Jan 31) Core Sector Growth (YoY%) 7.8% (Jan 2023) 7.0% (Dec 2022) Trade Deficit ($ mn) -17,743 (Dec 2022) -23,767 (Nov 2022) Current Account Deficit ($ bn) (36.4) (1QFY23) (18.2) (4QFY22) Note: Data Source: Axiscap Research and Crisil Research; Data till February 28, 2023 is considered; CAD: Current Account Deficit; GDP: Gross Domestic Product, IIP: India Industrial Production FII: Foreign Institutional Investors; MF-Mutual Fund; E- Estimate Flows Feb-23 Jan-23 Dec-22 FIIs (Net Purchases / Sales) (Rs Cr) -5,279 -29,950 1,782 MFs (Net Purchases / Sales) (Rs cr) 4,676 14,692 12,051
- 3. Equity Valuation Index Our Recommendation None of the aforesaid recommendations are based on any assumptions. These are purely for reference and the investors are requested to consult their financial advisors Equity Valuation index is calculated by assigning equal weights to Price-to-Earnings (PE), Price-to-Book (PB), G-Sec*PE and Market Cap to GDP ratio. G-Sec – Government Securities. GDP – Gross Domestic Product, Data as on Feb 28, 2023. Equity Valuation Index (EVI) is a proprietary model of ICICI Prudential AMC Ltd. (the AMC) used for assessing overall equity market valuations. The AMC may also use this model for other facilities/features offered by the AMC ` Hence, to summarize, we believe this phase may require investment portfolios to be highly nimble while giving due importance to overall asset allocation. Therefore, we recommend adapting below mentioned strategies and investing in these schemes over long term may be beneficial for your wealth creation journey • Staggered Investments: Continue SIP/STP in Equity Schemes as the long term structural story of India remains intact • Asset Allocation: As the macros are changing and to manage volatility, we recommend schemes which can invest in various asset classes • Parking Fund: As the valuations are not cheap, hence we recommend some funds to be placed in the Equity Arbitrage or Equity Savings category which can later be deployed post any market correction ICICI Prudential Freedom SIP* is a combination of Smart Features, to help investors achieve their Financial Goals. Freedom SIP allows investors to switch the SIP investments to a target scheme, post completion of the SIP tenure & monthly SWP will continue from the target scheme. ICICI Prudential Freedom SIP is an optional feature offered by ICICI Prudential AMC. This feature does not in any way give assurance of the performance of any of the Schemes of ICICI Prudential Mutual Fund or provide any guarantee of withdrawals through SWP mode. The SWP will be processed either till Dec 2099 or till the units are available in target scheme, whichever is earlier. Freedom SIP allows investors to switch the SIP investments to a target scheme, post completion of the SIP tenure & monthly SWP will continue from the target scheme. The investor may select any other SWP Amount. Multiples above are default. The illustration showing “multiples”, “X”, “times” referred do not in any manner indicate the return or return multiple which investor will be getting by investing in this feature. It only indicates the likely amount that can be withdrawn through SWP and for ease of understanding and planning of the investor, it is depicted in multiples of SIP amount opted by the investor. ICICI Prudential Booster Systematic Transfer Plan is a facility where in unit holder(s) can opt to transfer variable amount(s) from designated open ended scheme(s) of ICICI Prudential Mutual Fund to the designated open ended scheme(s) of ICICI Prudential Mutual Fund Market is expected to remain volatile due to various macro situations. Hence we recommend schemes with flexibility to invest across Asset Classes, Market Cap & Sectors/ themes Asset Allocation Flexibility Flexibility across Sector/ Theme Market cap Flexibility Recommended Schemes: Recommended Schemes: Recommended Schemes: HYBRID 1.ICICI Prudential Balanced Advantage Fund 2. ICICI Prudential Multi-Asset Fund FUND OF FUNDS 1.ICICI Prudential Asset Allocator Fund (FOF) 2. ICICI Prudential Passive Multi-Asset Fund of Funds 1. ICICI Prudential Business Cycle Fund 2. ICICI Prudential Thematic Advantage Fund (FOF) 1. ICICI Prudential Flexicap Fund 2. 2. ICICI Prudential Focused Equity Fund 3. ICICI Prudential Value Discovery Fund SIP/STP Strategy: Continue SIP/STP as the long term structural story of India remains intact, strongly recommend ICICI Prudential Freedom SIP* and ICICI Prudential Booster STP* Recommended Schemes 1. ICICI Prudential Smallcap Fund 2. ICICI Prudential India Opportunities Fund 3. ICICI Prudential Focused Equity Fund 4. ICICI Prudential Large & Mid Cap Fund 5. ICICI Prudential Value Discovery Fund 6. ICICI Prudential Flexicap Fund 102.5 50 70 90 110 130 150 170 Feb-05 Feb-06 Feb-07 Feb-08 Feb-09 Feb-10 Feb-11 Feb-12 Feb-13 Feb-14 Feb-15 Feb-16 Feb-17 Feb-18 Feb-19 Feb-20 Feb-21 Feb-22 Feb-23 Aggressively Invest in Equities Neutral Incremental Money to Debt Book Partial Profits Invest in Equities
- 4. Scheme Riskometers Please note that the Risk-o-meter(s) specified above will be evaluated and updated on a monthly basis. The above riskometers are as on January 31, 2023. Please refer to https://www.icicipruamc.com/news-and-updates/all-news for more details. ICICI Prudential Multi-Asset Fund (An open ended scheme investing in Equity, Debt and Exchange Traded Commodity Derivatives/units of Gold ETFs/units of REITs & InvITs/Preference shares) is suitable for investors who are seeking*: • Long term wealth creation • An open ended scheme investing across asset classes. *Investors should consult their financial advisers if in doubt about whether the product is suitable for them. RISKOMETER Investors understand that their principal will be at Very High risk ICICI Prudential Value Discovery Fund (An open ended equity scheme following a value investment strategy.) is suitable for investors who are seeking*: Moderate • Long Term wealth creation • An open ended equity scheme following a value investment strategy. RISKOMETER Investors understand that their LOW HIGH principal will be at Very High risk *Investors should consult their financial advisors if in doubt about whether the product is suitable for them. ICICI Prudential Business Cycle Fund (An open ended equity scheme following business cycles based investing theme) is suitable for investors who are seeking*: Moderate • Long Term wealth creation • An equity scheme that invests in Indian markets with focus on riding business cycles through dynamic allocation between various sectors and stocks at different stages of business cycles. RISKOMETER Investors understand that their principal will be at Very High risk *Investors should consult their financial advisors if in doubt about whether the product is suitable for them. ICICI Prudential Flexicap Fund (An open ended dynamic equity scheme investing across large cap, mid cap & small cap stocks) is suitable for investors who are seeking*: Moderate • Long Term wealth creation • An open ended dynamic equity scheme investing across large cap, mid cap and small cap stocks RISKOMETER Investors understand that their principal will be at Very High risk *Investors should consult their financial advisors if in doubt about whether the product is suitable for them. ICICI Prudential Balanced Advantage Fund (An open ended dynamic asset allocation Fund) is suitable for investors who are seeking*: • Long term capital appreciation/income • Investing in equity and equity related securities and debt instruments. *Investors should consult their financial advisers if in doubt about whether the product is suitable for them. RISKOMETER Investors understand that their principal will be at Moderately High risk ICICI Prudential Dividend Yield Equity Fund (An open ended equity scheme predominantly investing in dividend yielding stocks) is suitable for investors who are seeking*: • Long Term wealth creation • An open ended equity scheme that aims for growth by primarily investing in equity and equity related instruments of dividend yielding companies *Investors should consult their financial advisors if in doubt about whether the product is suitable for them. RISKOMETER Investors understand that their principal will be at Very High risk ICICI Prudential Focused Equity Fund (An open ended equity scheme investing in maximum 30 stocks across market- capitalization i.e. focus on multicap) is suitable for investors who are seeking*: • Long Term wealth creation • An open ended equity scheme investing in maximum 30 stocks across market capitalization. *Investors should consult their financial advisors if in doubt about whether the product is suitable for them. RISKOMETER Investors understand that their principal will be at Very High risk ICICI Prudential Smallcap Fund (An open ended equity scheme predominantly investing in small cap stocks) is suitable for investors who are seeking*: • Long Term wealth creation • An open ended equity scheme that seeks to generate capital appreciation by predominantly investing in equity and equity related securities of small cap companies. *Investors should consult their financial advisors if in doubt about whether the product is suitable for them. RISKOMETER Investors understand that their principal will be at Very High risk
- 5. In case of Fund of Funds, Investors may please note that they will be bearing the recurring expenses of the relevant fund of fund scheme in addition to the expenses of the underlying schemes in which the fund of fund scheme makes investment. ICICI Prudential Asset Allocator Fund (FOF) (An open ended fund of funds scheme investing in equity oriented schemes, debt oriented schemes and gold ETFs/schemes) is suitable for investors who are seeking*: • Long term wealth creation • An open ended fund of funds scheme investing in equity oriented schemes, debt oriented schemes and gold ETF/schemes *Investors should consult their financial advisers if in doubt about whether the product is suitable for them. RISKOMETER Investors understand that their principal will be at Moderately High risk ICICI Prudential Thematic Advantage Fund (FOF) (An open ended fund of funds scheme investing predominantly in Sectoral/Thematic schemes) is suitable for investors who are seeking*: Moderate • Long Term wealth creation • An open ended fund of funds scheme investing predominantly in Sectoral/Thematic equity oriented schemes RISKOMETER Investors understand that their principal will be at Very High risk *Investors should consult their financial advisors if in doubt about whether the product is suitable for them. ICICI Prudential Passive Multi-Asset Fund of Funds (An open ended fund of funds scheme investing in equity, debt, gold and global index funds/exchange traded funds) is suitable for investors who are seeking*: • Long Term wealth creation • An open ended fund of funds scheme investing in equity, debt, gold and global index funds/exchange traded funds RISKOMETER Investors understand that their principal will be at High risk *Investors should consult their financial advisors if in doubt about whether the product is suitable for them. Please note that the Risk-o-meter(s) specified above will be evaluated and updated on a monthly basis. The above riskometers are as on January 31, 2023. Please refer to https://www.icicipruamc.com/news-and-updates/all-news for more details. ICICI Prudential Large & Mid Cap Fund (An open ended equity scheme investing in both large cap and mid cap stocks) is suitable for investors who are seeking*: • Long term wealth creation • An open ended equity scheme investing in both large cap and mid cap stocks *Investors should consult their financial advisers if in doubt about whether the product is suitable for them. RISKOMETER Investors understand that their principal will be at Very High risk ICICI Prudential India Opportunities Fund (An open ended equity scheme following special situations theme) is suitable for investors who are seeking*: • Long term wealth creation • An equity scheme that invests in stocks based on special situations theme *Investors should consult their financial advisers if in doubt about whether the product is suitable for them. RISKOMETER Investors understand that their principal will be at Very High risk Scheme Riskometers
- 6. Disclaimer Mutual Fund investments are subject to market risks, read all scheme related documents carefully. In preparation of the material contained in this document, ICICI Prudential Asset Management Company Limited (the AMC) has used information that is publicly available, including information developed in-house. Some of the material used in the document may have been obtained from members/persons other than the AMC and/or its affiliates and which may have been made available to the AMC and/or to its affiliates. Information gathered and material used in this document is believed to be from reliable sources. The AMC, however, does not warrant the accuracy, reasonableness and / or completeness of any information. We have included statements / opinions / recommendations in this document, which contain words, or phrases such as “will”, “expect”, “should”, “believe” and similar expressions or variations of such expressions that are “forward looking statements”. Actual results may differ materially from those suggested by the forward looking statements due to risk or uncertainties associated with our expectations with respect to, but not limited to, exposure to market risks, general economic and political conditions in India and other countries globally, which have an impact on our services and / or investments, the monetary and interest policies of India, inflation, deflation, unanticipated turbulence in interest rates, foreign exchange rates, equity prices or other rates or prices etc. The AMC (including its affiliates), the Mutual Fund, the trust and any of its officers, directors, personnel and employees, shall not be liable for any loss, damage of any nature, including but not limited to direct, indirect, punitive, special, exemplary, consequential, as also any loss of profit in any way arising from the use of this material in any manner. The recipient alone shall be fully responsible/are liable for any decision taken on this material. All figures and other data given in this document are dated as on Feb 28,2023 unless otherwise mentioned and the same may or may not be relevant in future. The information contained herein should not be construed as a forecast or promise nor should it be considered as an investment advice. Investors are advised to consult their own legal, tax and financial advisors to determine possible tax, legal and other financial implication or consequence of subscribing to the units of ICICI Prudential Mutual Fund. The sector(s)/stock(s) mentioned in this communication do not constitute any recommenda- tion of the same and ICICI Prudential Mutual Fund may or may not have any future position in these sector(s)/stock(s). Past performance may or may not be sustained in the future. The portfolio of the scheme is subject to changes within the provisions of the Scheme Information document of the scheme. Please refer to the SID for more details. The information contained herein is only for the purpose of information and not for distribution and do not constitute an offer to buy or sell or solicitation of any offer to buy or sell any securities or financial instruments in the United States of America ("US") and/or Canada or for the benefit of US persons (being persons falling within the definition of the term "US Person" under the US Securities Act, 1933, as amended) or persons residing in Canada.