Equity Valuations Perspective | January 2024
•
0 likes•71 views

Navigate Equity Markets better through our VCTS (Valuations, Cycle, Triggers and Sentiments) framework. The document below highlights the impact of various dynamic variables on the equity market across time periods. Read on to know more!” #ICICIPrudentialMutualFund #Equity #Investments #MutualFunds

Recommended
Recommended
More Related Content
Similar to Equity Valuations Perspective | January 2024
Similar to Equity Valuations Perspective | January 2024 (20)
More from iciciprumf
More from iciciprumf (20)
Recently uploaded
Recently uploaded (20)
Equity Valuations Perspective | January 2024
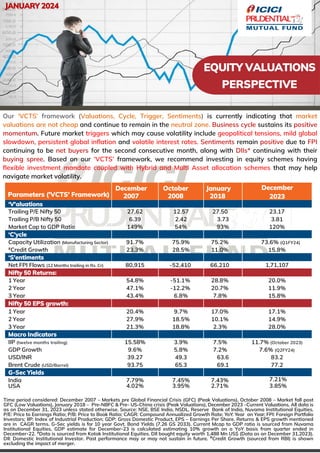
- 1. EQUITY VALUATIONS PERSPECTIVE Time period considered: December 2007 – Markets pre Global Financial Crisis (GFC) (Peak Valuations), October 2008 – Market fall post GFC (Low Valuations), January 2018 – Pre-NBFC & Pre- US-China crisis (Peak Valuations), December 2023 –Current Valuations. All data is as on December 31, 2023 unless stated otherwise. Source: NSE, BSE India, NSDL, Reserve Bank of India, Nuvama Institutional Equities. P/E: Price to Earnings Ratio; P/B: Price to Book Ratio; CAGR: Compound Annualized Growth Rate; YoY: Year on Year; FPI: Foreign Portfolio Investors; IIP: Index of Industrial Production; GDP: Gross Domestic Product, EPS – Earnings Per Share. Returns & EPS growth mentioned are in CAGR terms. G-Sec yields is for 10 year Govt. Bond Yields (7.26 GS 2033). Current Mcap to GDP ratio is sourced from Nuvama Institutional Equities, GDP estimate for December-23 is calculated estimating 10% growth on a YoY basis from quarter ended in December-22. *Data is sourced from Kotak Institutional Equities. DII bought equity worth 1,488 Mn US$ (Data as on December 31,2023). DII: Domestic Institutional Investor. Past performance may or may not sustain in future. #Credit Growth (sourced from RBI) is shown excluding the impact of merger. Parameters ('VCTS' Framework) December 2007 October 2008 January 2018 December 2023 ‘V'aluations Trailing P/E Nifty 50 27.62 12.57 27.50 23.17 Trailing P/B Nifty 50 6.39 2.42 3.73 3.81 Market Cap to GDP Ratio 149% 54% 93% 120% ‘C’ycle Capacity Utilization (Manufacturing Sector) 91.7% 75.9% 75.2% 73.6% (Q1FY24) #Credit Growth 23.3% 28.5% 11.0% 15.8% ‘S'entiments Net FPI Flows (12 Months trailing in Rs. Cr) 80,915 -52,410 66,210 1,71,107 Nifty 50 Returns: 1 Year 54.8% -51.1% 28.8% 20.0% 2 Year 47.1% -12.2% 20.7% 11.9% 3 Year 43.4% 6.8% 7.8% 15.8% Nifty 50 EPS growth: 1 Year 20.4% 9.7% 17.0% 17.1% 2 Year 27.9% 18.5% 10.1% 14.9% 3 Year 21.3% 18.8% 2.3% 28.0% Macro Indicators IIP (twelve months trailing) 15.58% 3.9% 7.5% 11.7% (October 2023) GDP Growth 9.6% 5.8% 7.2% 7.6% (Q2FY24) USD/INR 39.27 49.3 63.6 83.2 Brent Crude (USD/Barrel) 93.75 65.3 69.1 77.2 G-Sec Yields India 7.79% 7.45% 7.43% 7.21% USA 4.02% 3.95% 2.71% 3.85% JANUARY 2024 Our ‘VCTS’ framework (Valuations, Cycle, Trigger, Sentiments) is currently indicating that market valuations are not cheap and continue to remain in the neutral zone. Business cycle sustains its positive momentum. Future market triggers which may cause volatility include geopolitical tensions, mild global slowdown, persistent global inflation and volatile interest rates. Sentiments remain positive due to FPI continuing to be net buyers for the second consecutive month, along with DIIs* continuing with their buying spree. Based on our ‘VCTS’ framework, we recommend investing in equity schemes having flexible investment mandate coupled with Hybrid and Multi Asset allocation schemes that may help navigate market volatility.
- 2. The ‘VCTS’ (Valuations, Cycle, Trigger, Sentiments) framework is a market checklist which can be used to determine market valuations/conditions for investment at any given point in time. The framework can find application across asset classes. It aims to navigate markets efficiently by reflecting on various data points used in the framework. PE – Price-to-Earnings; PBV – Price to Book Value Ratio; COVID-19 is Coronavirus disease 2019. The information contained herein is only for the purpose of information and not for distribution and do not constitute an offer to buy or sell or solicitation of any offer to buy or sell any securities or financial instruments in the United States of America (“US”) and/or Canada or for the benefit of US persons (being persons falling within the definition of the term “US Person” under the US Securities Act, 1933, as amended) or persons residing in Canada. MUTUAL FUND INVESTMENTS ARE SUBJECT TO MARKET RISKS, READ ALL SCHEME RELATED DOCUMENTS CAREFULLY Parameters ('VCTS' Framework) Market V aluations P/E or PBV helps in ascertaining whether the market is expensive or cheap Business C ycle Indicators like capacity utilization or credit growth help in understanding the strength of business cycle T riggers Triggers are events which can have impact on the overall equity market S entiments Sentiments helps in understanding investors affinity towards the equity market Buy - Valuations Cheap Sell - Valuations Expensive Buy - Cycle is weak Sell - Cycle is Strong Triggers - Unpredictable event like COVID-19, Geo-Political Tensions Buy - Negative Sentiments Sell – Positive Sentiments