SlideShare a Scribd company logo
1 of 29
12 Chapter 5 • Forecasting and Planning 127
Chapter 5 • Forecasting and Planning 127
The competition for good employees is particularly fierce for
smaller companies, who, despite providing the majority of new
jobs in the United States,8 have a more difficult time hiring in
general. Forecasting and planning let firms better manage talent
shortages and surpluses. By understanding business cycles, the
business needs of their firms, the current talent in their firms,
and the pipelines for finding future talent, HR professionals can
proactively reduce the impact the greater competition for talent
will have.
Workforce planning is a strategic process that allows an
organization to predict and manage its talent supply and
demand. The goal of this process is to enable the organization
to attain its business goals and execute its strategy. Because
business leader input is as important as HR input, workforce
planning is an organizational initiative, not something solely
done by HR.
Despite the clear advantages of forecasting and planning, many
organizations respond to their staffing needs reactively rather
than proactively. In other words, they do little planning and
simply work to fill positions as they open up. Jim Robbins, the
former president and CEO of Cox Communications, put it this
way: "We spend four months per year on the budget process, but
we hardly spend any time talking about our talent, our strengths
and how to leverage them, our talent needs and how to build
them. Everyone is held accountable for their budget. But no one
is held accountable for the strength of their talent pool. Isn't it
the talent we have in each unit that drives our results? Aren't we
missing something?"
At Corning, a leader in specialty glass and ceramics, talent
planning is the "bridge that translates business strategy into
talent strategy."10 Corning knows that its talent portfolio
influences its success. Over- or understaffed units affect the
company's cost structure, cash flow, and ability to deliver its
products. The wrong skill mix can mean missed market
opportunities if the workforce is underskilled or, if the
workforce is overskilled, cost structures that undermine
profitability. To keep its skill mix optimized, every spring
Corning models its future talent needs across multiple scenarios
and then analyzes strategies to close any gaps.11
In this chapter, we discuss the importance of understanding the
organization's business strategy, goals, and competitive
environment to identify what talents the firm will need.
Ensuring that the right people are in place at the right time
requires forecasting the firm's labor demand and maintaining an
awareness of the relevant pipelines for its labor supply. Action
plans can then be developed to address any gaps between the
two. After reading this chapter, you will have a good
understanding of the workforce forecasting and planning
process.
THE WORKFORCE PLANNING PROCESS
The workforce planning process, which is illustrated in Figure
5-1, typically includes the following five steps:
1. Identify the firm's business strategy. A firm's strategic
vision, mission, and strategy affect its current and future
staffing requirements by influencing the types and numbers of
employees needed.
2. Articulate the firm's talent philosophy and strategic staffing
decisions. As you learned in Chapter 2, firms differ in their
commitment to things like promoting workers, retaining
workers, and their preferences for hiring people with certain
skills or training them after they are hired. Because these
factors influence the nature of the firm's future labor supply and
the type of workers it will need, they are important to
understand when forecasting and planning.
3. Conduct a workforce analysis. Forecast both labor demand
and labor supply and identify any gaps between the two.
4. Develop and implement action plans. Develop action plans to
address any gaps between labor demand and labor supply
forecasts. The plans should be consistent with the firm's talent
philosophy, and can include both short- and long-term
recruiting, retention, compensation, succession management,
and training and development plans. For example, addressing
the issues related to an aging workforce or a workforce with
many employees who are roughly the same age might require
longer-term action plans.
5. Monitor, evaluate, and revise the forecasts and action plans.
Evaluate how effective the firm's workforce plan has been in
terms of meeting the company's recruiting and hiring goals. As
the business environment changes, the firm's forecasts and
action plans may need to change, too.
118 Chapter 5 • Forecasting and Planning
Chapter 5 • Forecasting and Planning 117
6.
Identify the Firm's Talent Philosophy and Strategic Staffing
Goals
i
Business Strategy
Forecast the Firm's Demand for Labor
-Which jobs will the firm need? -What competencies does the
business strategy require? -What is the firm's expected level of
business activity? -How many workers are needed?
Forecast the Supply of Labor Available in the Market
-Which competencies are available? -Will the firm be able to
find those competencies internally or externally? -How many
external workers possess those competencies?
Identify Gaps (Projected labor surpluses or shortages)
Develop Action Plan(s) to Address the Forecasted Talent Gaps
Monitor, Evaluate, and Revise
the Forecasts and Action Plans
2 Chapter 5 • Forecasting and Planning 118
Chapter 5 • Forecasting and Planning 3
FIGURE 5-1 The Workforce Planning Process
Forecasting is not an exact science, and it is rare for a forecast
to be exactly right. Given this uncertainty, it is usually best to
construct estimates as a range—with low, probable, and high
estimates—and then recalculate those estimates as the
organization's internal and external environments change, along
with the firm's assumptions about its workforce needs. Creating
and implementing workforce plans is easier in more stable
organizations and more challenging when a company faces
rapidly changing conditions. With that said, the firms
experiencing rapid changes will find planning the most valuable
because it can guide their recruiting and hiring actions in the
face of uncertainty.12
The time frame for workforce planning should reflect the length
of the business planning cycle. Short-term workforce planning
involves planning sourcing, recruiting, development, and
separation activities the firm needs to do in the coming year. By
contrast, long-term workforce planning involves doing the same
activities but for a multiyear period.
At the very least, workforce planning should be done for those
positions throughout the organization whose execution is
considered critical for the success of their units and the firm as
a whole. If innovation and intangible assets, such as knowledge
or creativity, generate a firm's competitive advantage, then top
managers and knowledge workers are essential. If an
organization's competitive advantage is based on service, its
success depends on the quality and performance of its customer-
facing employees.14 The accurate identification of these key
positions is extremely important, as their being vacant or poorly
staffed can affect the organization's ability to perform. Critical
jobs and roles can occur at any organizational level. For
example, think about what the most critical jobs might be in a
hotel. You might have thought of the manager, or even the front
desk staff who set the tone for guests' experiences. In fact,
repeat business in the hotel industry is driven more by room
cleanliness than by guests' interactions with front desk staff,
making the housekeeping staff critical for creating a
competitive advantage.15 Positions in which top performers
significantly outperform average performers can also be
important for a firm's workforce planning. Ensuring that the
most effective and productive people possible are placed into
these positions can positively affect a company's bottom line.
Next, we discuss how an organization can forecast the future
demand for its products and services, which, in turn, will affect
its demand for labor.
FORECASTING A FIRM'S LABOR DEMAND
An organization's product demand directly affects its need for
labor. On the one hand, if an organization is experiencing
growing demand for what it does or makes, unless it plans to
increase the automation of its manufacturing processes, it will
probably need to hire more people to meet the increased
demand. Even if the organization does plan to automate, the
process of doing so is
■
likely to increase the firm's demand for people with different
types of talent—people able to use and maintain the new
machinery or technology, for example. On the other hand, if the
demand for the organization's products or services is
decreasing, the company's need for employees is likely to fall,
perhaps to the point that it needs to downsize, or lay off,
employees. When the demand for goods weakens during
recessions, many employers downsize their workforces.
Accurately forecasting business activity requires identifying
key business activity factors, identifying quality sources of
relevant forecasting information for those factors, and utilizing
these sources to compile complete, accurate, and timely data.
For example, Con-way Freight compiles monthly forecasts of
customer demand, productivity goals, and scheduled and
unscheduled absences to project hiring needs one to three
months in advance.16 This enhances Con-way's recruiters'
ability to recruit and onboard the needed drivers, which can take
one to three months.
The time frame for a business activity forecast is at the
discretion of the organization. It may make sense for
organizations in relatively stable, predictable environments to
make five-year or even 10-year forecasts. Organizations in more
dynamic, unpredictable environments may have great difficulty
making reasonably accurate business forecasts for periods
greater than 6 to 12 months out. Forecasts are best treated as
dynamic estimates, and should be revisited and updated
regularly as assumptions and environmental conditions change.
Constructing short-, mid-, and long-range estimates is also
useful because long-range forecasts are likely to be less
accurate than short-range estimates due to the increased
likelihood of environmental and organizational changes in the
long term.
There are many external sources of information firms can tap
into to forecast the demand for their products. Next, we will
discuss five of the most common types of information that can
be used to evaluate general business trends in the economy:
seasonal factors, interest rates, currency exchange rates,
competitive changes, and industry and economic forecasts.
Seasonal Forecasts
For some organizations, business demands are seasonal and
predictable. For example, United Parcel Service experiences a
sharp increase in shipping volume from November to January
every year due to holiday shipping demand. Landscaping firms
know that they will need more workers in the spring and
summer than in the winter. Because this increased seasonal
demand occurs every year, it can be anticipated. For many
organizations, business cycles are much less predictable.
Occasional spikes and dips in the demand for an organization's
products or services can be harder to forecast, but the better an
organization can anticipate them, the better it will be able to
have an appropriate workforce in place as needed.
Interest Rate Forecasts
Interest rate forecasts can project the likelihood that the
organization will need or be able to build new plants and
increase production in the near future. Higher interest rates
discourage capital investment by making it more expensive for
organizations to borrow money to fund their expansion plans.
Higher interest rates make it more expensive for consumers to
borrow money as well. As a result, product demand tends to
decline when interest rates rise. By contrast, when interest rates
fall, product demand rises. Rising interest rates generally
suggest that the demand for labor will fall, whereas falling
interest rates generally suggest that the demand for labor will
rise. For example, when interest rates fall, the demand for
homes tends to increase, increasing the demand for skilled trade
workers and mortgage specialists.
Currency Exchange Rate Forecasts
For many companies, especially global ones, exchange rate
forecasts are useful for forecasting business activity. If a
country's currency is strengthening against other currencies, it
means that one unit of the country's currency translates into
greater amounts of the foreign currency than when the country's
currency was weaker. This means that the country's companies
can import goods and materials more cheaply because one unit
of the domestic currency buys more foreign goods than it used
to. However, this also means that country's products are more
expensive overseas. For example, when the New Zealand dollar
strengthened against the U.S. dollar, Jack Links, a New Zealand
beef jerky maker, was forced to cut two-thirds of its workforce
because it
4 Chapter 5 • Forecasting and Planning 119
Chapter 5 • Forecasting and Planning 119
became cheaper for the company1 s biggest U .S. customer to
buy its jerky from Brazil, likewise, if a U.S. company does a lot
of business internationally, a strengthening U.S. dollar usually
translates into lower international demand for the firm's
products and lower labor demand for the firm. What do you
suppose happens when a country's currency weakens? As a
country's currency weakens, the relative prices of its exported
goods fall. The international demand for the country's products
rises as a result, as does the country's demand for labor.
Exchange rates can be volatile and difficult to predict in the
long term. The more stable the exchange rate, the more accurate
and useful the firm's product demand and labor forecasts will
be.
Competition-Based Forecasts
If new competitors enter an industry, customers will have
greater product choices, which will tend to dilute the demand
for any one company's products or services. For example, in the
face of increased competition from foreign carmakers, many
U.S. carmakers, including GM and DaimlerChrysler,
experienced declining demand for their products and downsized
their workforces. Alternatively, if a firm leaves a market, then
its surviving competitors might experience greater demand for
their products or services.
Industry and Economic Forecasts
The information relevant to making a forecast is likely to differ
for different companies and different industries. The
Conference Board's Index of Leading Indicators, a commonly
used barometer of economic activity over three to six months,
presents a relatively broad picture of the economy. As such, the
index can help identify trends leading to economic recessions or
recoveries. The monthly Conference Board Consumer
Confidence Index measures consumer sentiment by asking
survey respondents questions about their perceptions of their
job security and willingness to spend money. This index also
can help predict future economic activity and thus demand for a
company's products or services and associated labor needs.
Additional economic indicators include gross domestic product
(GDP), the business inventories and sales ratio tracked by the
Department of Commerce, and the Purchasing Managers Index
issued monthly by the Institute for Supply Management.
Disappointing corporate earnings preannouncements from a
firm's own customers can also suggest a declining demand for
its products. Industries often have their own forecasts as well.
The National Restaurant Association's annual industry forecast
is one example. An organization can analyze its past product
demand with regard to these indicators to identify which ones
tended to accurately predict changes in its business activity, and
then use that information to forecast the company's future labor
demand.
Legal Factors
New legislation can also influence labor demand. The employer
health insurance mandate in the 2010 Patient Protection &
Affordable Care Act, also called Obamacare, requires employers
with at least 50 full-time employees to provide government-
approved, affordable health insurance to at least 95 percent of
their employees and dependents beginning in 2014. If any of
those employees receives government health insurance
subsidies, the IRS will fine the employer up to $2,000 per
employee. This is expected to affect staffing models,
particularly for service jobs, and boost the temporary staffing
industry as employers try to stay under 50 employees.18
Employers may impose strict limits on the duration of
temporary worker assignments or send jobs overseas to avoid
being affected by this law.
Other Factors
Additional factors can also indicate changing demand for the
organization's products and services and the need for changes in
the workforce. Some other factors that often cause companies to
change the size of their workforce include:
· An increase or decrease in consumer spending
· An increase or decrease in the unemployment rate
· An increase or decrease in the disposable income of consumers
· Increased or decreased purchases of durable goods
· Increased or decreased housing purchases
6 Chapter 5 • Forecasting and Planning 121
122 Chapter 5 • Forecasting and Planning 7
·
Many firms start hiring as soon as the economy begins
expanding so that new employees will be well trained and
productive by the time the increased economic growth generates
increased business activity for the firm. Some information the
firm needs to forecast its sales can be generated internally. For
example, by tracking a firm's incoming orders, managers can get
an idea about what the likely order volume will be in the next
month or quarter. Similarly, a company entering or exiting a
particular line of business will know that its labor needs are
likely to change accordingly. In other words, the firm will
generate its forecasts based on its own internal business needs.
Internal Forecasting Tools
A firm can also forecast its labor demand, depending on the
goals it has generated internally, which might include the
following:
· Achieving the staffing levels the firm needs to generate a
given amount of revenue within a particular period of time (e.g.,
hiring enough salespeople to generate $5 million in revenue
within six months)
· Increasing the firm's staffing levels to execute a growth
strategy
· Decreasing the firm's staffing levels during a restructuring
· Obtaining the new talent the firm needs to create new products
or provide different services
To better size their sales forces in each of their sales channels,
companies, like Whirlpool, calculate the investment in human
resources required to reach their optimum profit level. Sizing
analyses and statistical models can identify if a company is
slightly overstaffed in one area or has untapped potential in
another. It is a good idea to identify the minimal as well as
optimal staffing levels the firm needs to meet its goals.
The most important labor demand forecasts are those for the
positions and skills that will be central to the organization's
intended strategic direction. For example, assume an
organization is experiencing slow growth in its bricks-and-
mortar facilities, but it is intending to roll out a new Web-based
initiative for selling its product line. The firm's labor forecasts
might indicate that its overall hiring will stay relatively flat.
However, in light of the new strategic initiative, the company
obviously will need experienced IT specialists, computer
technicians, and software writers. It will also need customer
service employees who are technologically competent. If it
cannot hire these people, then the new Web-based initiative is
likely to fail.
There are many ways to forecast labor demand, and next, we
will discuss four of the most common ones: ratio analysis,
scatter plots, trend analysis, and judgmental forecasting.
RATIO ANALYSIS The estimated level of business activity of
the firm can be converted into the number of employees the
company will need to attain this level of productivity by using
past staffing ratios. A staffing ratio is a mathematical way of
calculating the number of employees a firm needs to produce
certain levels of output. A firm can then "index" the number of
people it seeks to employ with the business metric. For
example, a law firm might index the number of paralegals to the
number of attorneys based on a staffing ratio of 3:2. In other
words, the firm needs three paralegals for every two attorneys.
At United Parcel Service, every 22 packages that cross a border
support one job in its package operation.19
A ratio analysis assumes that there is a relatively fixed ratio
between the number of employees needed and certain business
metrics. Using historical patterns within the firm helps to
establish a reasonable range for these ratios. Of course, the
process can be used for either justifying new positions or
demonstrating the need for layoffs.
For example, assuming that a manufacturing facility has 100
employees and produces $20,000,000 of product annually, then
the firm's production-to-employee ratio is $200,000:1. For every
additional $200,000 of product the company wants to produce,
it should hire an additional worker. Because some economies of
scale will result from the expansion that will reduce the number
of employees needed, organizations should consider their
unique situation and adjust their forecasts accordingly.
Other ratios that can be used in estimating target headcount
levels include:
STAFFING RATIO
a mathematical way of calculating the number of employees a
firm needs to produce certain levels of output
· Revenue per employee
· Managers to employees
·
· Inventory levels to employees
· Store size to employees
· Number of customers or customer orders to employees
· Labor costs to all production costs
· The percentage utilization of production capacity to
employees
If an organization expects its employee-productivity ratio to
remain stable over the forecasting period, then simply applying
the past ratio of employees to the productivity that's been
forecasted for the upcoming period can be adequate. However,
if the organization is experiencing a change in productivity per
employee, due to technology, training, restructuring, and so on,
then the application of past ratios such as this is inappropriate.
Managers will often have a good idea of how estimates need to
be adjusted, and their expertise should be incorporated into the
process. In entirely novel situations for which past ratios do not
exist, the only way to generate a reasonable staffing forecast is
to rely on the judgment of the firm's managers. Although ratio
analyses are limited to one predictor of labor demand at a time
(labor hours per unit produced, for example), more advanced
statistical techniques such as a regression analysis can be used
to incorporate multiple predictors. For example, a regression
analysis that incorporates sales forecasts, store sizes, mall
traffic, and seasonal trends can be used to forecast the number
of employees needed in a retail store. Of course, the underlying
data used to construct any ratio or regression analysis must be
credible and reliable. Otherwise, the forecast will not be
accurate.
Forecasting labor demand in small- and medium-size
organizations can be more difficult because historical trends are
likely to be more variable and because there is typically less
historical information from which to draw. Additionally, adding
one new person in a 10-employee company means expanding the
workforce in 10 percent increments, which may not correspond
to the growth rate of the business. Companies of all sizes often
prefer to hire temporary or contingent workers until they are
sure they need the additional employees.
SCATTER PLOTS SCATTER PLOTS Scatter plots show
graphically how two different variables—say, revenue
a graphic that shows how two different and salesperson staffing
levels—are related. For the purposes of forecasting labor
demand, scat-
variables are related ter plots help firms determine if a factor
has historically been related to staffing levels. This
information is then used to determine what staffing levels
should be changed as the factor changes. This is related to
correlation coefficients and regression analysis, which are
discussed in Chapter 8.
Assume that new housing developments are being built in the
area served by Ambulance Express, a private ambulance service.
The company wants to forecast its future requirements for
ambulance drivers and knows that the more people living in its
service area, the more drivers it will need to meet the
community's needs. The staffing expert first collects data from
six other ambulance services in the state to learn their number
of ambulance drivers as well as the populations in their service
areas. Table 5-1 summarizes these numbers.
Figure 5-2 shows these two sets of numbers graphically in a
scatter plot. The population served by the various ambulance
services is indicated on the horizontal axis, and the
corresponding number of ambulance drivers employed by each
of the companies is indicated on the vertical axis. Each point on
the graph reflects one company. Notice that a nearly straight
line can be drawn between the points, as we have done on the
graph. This leads us to conclude that there is a
The Population Served as It Relates to the Required Number of
Ambulance Drivers
Population Served Number of Ambulance Drivers
12,500 2
25,000 5
30,000 5
35,000 6
50,000 10
60,000 11
122 Chapter 5 • Forecasting and Planning
Chapter 5 • Forecasting and Planning 121
(
Population Served
FIGURE 5-2
An Example of a Scatter Plot: The Relationship between the
Population Served and the Number of Ambulance Drivers
)direct, if not perfect, relationship between the two factors—
that is, the number of people that can be served is directly
related to the number of ambulance drivers. Therefore, the line
can be used to predict the different staffing levels needed to
serve the different population levels: Ambulance Express
anticipates serving 43,000 people within two years. Starting on
the horizontal axis, we located the point that reflects 43,000
people and then drew a dotted vertical line over to the solid
diagonal line. From this point on the solid diagonal line, we
drew a dotted horizontal line left to the vertical axis. The
staffing level at which this horizontal line touches the vertical
axis is the estimated number of ambulance drivers Ambulance
Express will need. In this example, servicing 43,000 people will
require eight drivers.
TREND ANALYSIS Trend analysis involves looking at past
employment patterns—the TREND ANALYSIS employer's, the
industry's, or even the nation's patterns, for example—and using
those patterns using past employment patterns to to predict a
firm's future labor needs. For example, if a company has been
growing 5 percent predict future needs annually for the last
eight years, it might assume that it will experience the same 5
percent annual growth for the next few years. In other words,
any employment trends likely to continue can be useful in terms
of forecasting a firm's future labor demand.
Figure 5-3 illustrates a trend analysis using a hypothetical
example of a hospital's number of nurses educated
internationally versus domestically from 2006 through 2013.
The trend lines show that the number of domestically educated
nurses has been steadily declining, and the number of
internationally educated nurses has been steadily increasing
over the last seven years. If it had been tracking these trends,
the hospital might have decided to scale up its international
recruiting efforts in time to manage this transition to a more
internationally educated nursing force.
Valero Energy Corporation used historical trends to accurately
forecast its talent demand by division and title three years in
advance. By putting five years of historical people records into
a database, the company developed a series of mathematical
algorithms used to do a trend analysis. The analysis allowed the
company to predict its turnover by location, position type,
salary, employee tenure, and division.20 Although this example
shows that it can be done, trend analysis is rarely used by itself
to make labor demand forecasts. So many factors can affect a
company's staffing needs, including the firm's competition,
economic environment, and changes in how the company gets
its work done (automation might improve its productivity, for
example), that the method can be difficult to use alone.
JUDGMENTAL FORECASTING Instead of trying to identify
past relationships between staffing levels and various factors as
we did with the previous methods, judgmental forecasting relies
on the experience and insights of people in the organization to
predict a firm's future employment needs. Asking managers and
supervisors about what they believe future staffing
8 Chapter 5 • Forecasting and Planning 123
Chapter 5 • Forecasting and Planning 123
(
□
Domestically Educated
A Internationally Educated
FIGURE 5-3
Domestically and Internationally Educated Nurses (2006-2013)
)
JUDGMENTAL FORECASTING
relying on the experience and insights of people in the
organization to predict a firm's future employment needs
and employee skill levels can be is very insightful. Managers
are often aware of what is going on in the lives of their
subordinates and may be able to provide reasonably accurate
predictions of their future labor supply. Likewise, managers are
often aware of the retirement eligibility and intentions of their
staff and can use this information to project likely talent losses
several years into the future.
Judgmental forecasting can be top-down, in which case the
organization's leaders rely on their experience and knowledge of
their industry and company to make predictions about the firm's
future staffing levels needs. The estimates the top managers
come up with then become staffing goals for lower-level
managers in the organization. In some cases, particularly when
companies are facing financial difficulties or restructuring,
budgets may determine the firm's "headcount," or number of
employees. Bottom-up judgmental forecasting uses the input of
lower-level managers to estimate the firm's total staffing
requirements. Each manager estimates the number of employees
he or she needs to execute the firm's strategy. The estimates are
consolidated and modified as they move up the organization's
hierarchy to the firm's top managers, who then review and
formalize the estimate.
Because historical trends and relationships can change, it is
usually best to supplement the more mechanical ratio, scatter
plot, and trend forecasting methods with managerial judgment.
The mechanical methods can be used as a starting point to make
the estimates, and then managers can use their judgment to
modify the estimates.
124 Chapter 5 • Forecasting and Planning
9 Chapter 5 • Forecasting and Planning 124
RETURN ON INVESTMENT ANALYSIS It is possible to
estimate the return on investment from adding a new position
based on the costs and outcomes resulting from that new hire.
The first step is to assign dollar values to the benefits expected
from a new hire for the period of time most appropriate for the
position and the organization—it could be a month, a quarter, or
a year. How much revenue during the period will be directly
generated as a result of this position? How much money per
period will this position save the organization in terms of
increased efficiency, and how much value will it add in greater
productivity, quality, or customer service? The sum of these
figures is the value of adding this position.
Next, the costs to advertise the position, interview and screen
candidates, pay for their travel, and relocate, train, and
compensate them is calculated. This is the initial investment the
company has made in the new hires, which should then be
divided into the value the new hire(s) brings to the company and
multiplied by 100 to determine the firm's percentage return on
its investment.
For example, assume a store's new furniture salespeople
generate an average of $60,000 in profit their first year. In
addition, the reduced workload on the rest of the sales staff
improves their efficiency and ability to provide high-quality
customer service by 5 percent. This is worth an additional
$15,000 to the company. If the cost of hiring and training a new
salesperson is
expected to be $7,000, and his or her salary is $25,000 before
commissions, the return on investment of hiring an additional
salesperson is predicted to be 234 percent.
100 X [($60,000 + $15,000)/($7,000 + $25,000)] =
$75,000/$32,000 = 234% ROI
Companies can incorporate other human resource data into their
models, depending on what they want to forecast. Oil company
Saudi Aramco's workforce projections include the corporate
resources required to recruit, hire, and train new staff and to
mentor employees during their careers.21 3M provides its
business leaders information about important trends, and
country-by-country comparisons of skills gaps, workforce
demographics, productivity, and return on human capital
investments.22
Many employers, particularly retailers, mistakenly treat labor
costs as an easy target when cost cutting is needed, rather than
treating employees and sufficient staffing levels as an
investment that contributes directly to the company's
performance. When Home Depot tried to boost profits by
cutting staff and relying more heavily on part-time workers,
customer satisfaction and sales growth fell. Similarly,
Walmart's staff reduction efforts led to operational problems
including understocked shelves, which led to decreased sales.
Because Walmart links the number of hours for which managers
can schedule employees to sales performance, declining sales
can trigger a spiral of lower staffing levels, further customer
service and sales declines, and additional cuts in work hours
and headcount.23
FORECASTING A FIRM'S LABOR SUPPLY
Strategic staffing requires firms to keep their fingers on the
pulse of their labor markets. Therefore, understanding current
and future skill and competency trends in the labor market is
crucial. Information about the number and quality of employees
likely to be available to an organization when it needs them
should be considered while the organization is in the process of
formulating its business strategy. For instance, attempting to
grow a fiber optics firm by 20 percent a year might not be
possible if there aren't a sufficient number of fiber optics
engineers and technicians in the labor pool willing to work for
salaries the firm is able to pay. It is obviously best for an
organization (especially small firms that have a harder time
attracting candidates) to have a reasonable estimate of the
projected availability of talent for its key positions before
developing a strategy that depends on this talent pool. The
organization's internal and external labor markets will influence
these estimates. We will discuss each one next.
Forecasting the Internal Labor Market
To determine the likely supply of a firm's internal talent at a
future point in time, subtract the number of employees the firm
anticipates losing via promotions, demotions, transfers,
retirements, and resignations from the number of employees in
the position at the beginning of the forecasting period. Then add
any anticipated talent gains for the position from transfers,
promotions, and demotions to the internal labor supply forecast.
In tighter labor markets when workers are harder to find, more
employees than usual may leave the organization to pursue
other opportunities. Fewer employees may leave during looser
labor markets when jobs are less plentiful.
Analyzing a company's demographic mix and current turnover
rates can help managers forecast how many current employees
are likely to still be in the company's workforce at a given
forecasting date. An organization that expanded rapidly in the
past may find that a particularly large cohort of employees hired
at roughly the same time will be retiring at about the same time,
for example. This, of course, will mean that the firm will have
to hire a large number of new employees to replace them. Given
their better knowledge of their subordinates, supervising
managers may also be able to reasonably estimate the
percentage of their current workforce likely to be with the
organization at some specified date in the future. Transition
analysis, managerial judgment, talent inventories, and
replacement charts are some of the methods that can be used to
forecast internal talent resources, and will be explained next.
TRANSITION ANALYSIS
TRANSITION ANALYSIS A quantitative technique called a
transition analysis (also called a quantitative tecnnique used to
Markov analysis) is a simple technique that can be used to
analyze a firm's internal labor analyze internal labor markets
and markets and forecast its internal labor supply. Conducting a
transition analysis can also help forecast internal labor supply
10 Chapter 5 • Forecasting and Planning 125
Chapter 5 • Forecasting and Planning 126
(
Feeder Position
1
Exits
Lateral Moves/Transfers
Demotions
FIGURE 5-4
The Transition Analysis Process Illustrated
)hiring managers answer applicants' questions about their
potential paths for promotion and the firm's upsizing or
downsizing plans.
Figure 5-4 shows how a transition analysis works. Managers
first identify all of the positions in the company that feed
employees into the target position and to which employees in
the target position tend to be promoted, demoted, or transferred.
Ideally, all of the employees entering and leaving the target job
are tracked so that the transition probability matrix is as
accurate as possible. The cells in the transition probability
matrix contain the percentage of employees staying in the same
job, moving to a different job in the company, or exiting the
company.
As a numerical example, assume that it is the beginning of
2014, and the company needs to forecast the likely number of
customer service representatives its call center will have at the
beginning of 2015. Table 5-2 shows the transition
probabilities—that is, the likelihood of people staying in their
current position or moving—for four jobs reflecting three job
levels in the organization based on data from the one-year
period from January 1, 2013, to January 1, 2014.
Full- and part-time customer service representatives are at the
entry level, supervisors are at the middle job level, and
managers are at the third job level. The last column identifies
the number of employees currently working at each job at the
beginning of 2014. The transition probabilities are in the third
to seventh columns of the matrix, and reflect the probability
that an employee who begins the year employed in the job
identified to the left will be employed in the job identified at
the top of the column or will have exited the organization by the
end of the year. The numbers on the diagonal (in bold) reflect
the probability that an employee who begins 2014 in the job
named to the left will still be in that job one year later.
A transition probability matrix is presented in Table 5-2.
Reading across the first row indicates that 40 percent of the
employees who begin 2014 as full-time customer service
representatives are likely to still be working as customer service
representatives at the beginning of 2015. Ten percent of the
employees who begin the year working as a full-time customer
service representative are likely to end the year working as a
part-time customer service representative, and 10 percent are
likely to have been promoted to supervisor. None of the
employees beginning
An Example of a Transition Probability Matrix
Transition Probabilities (2013-2014)
Current (2014)
Job Category (1)
Level (2)
FTCSR (3) (%) PTCSR (4) (%)
SUP (5) (%) MGR (6) (%)
Exit (7) (%)
Number of Employees (8)
Full-Time Customer Service Representative (FTCSR)
1
40
10
10
0
40
400
Part-Time Customer Service Representative (PTCSR)
1
20
50
5
0
25
150
Supervisor (SUP)
2
5
0
85
5
5
75
Manager (MGR)
3
0
0
0
65
35
20
the year as a full-time customer service representative can be
expected to be a manager by the end of the year. The "Exit"
column reflects the percentage of employees in each job that
can be expected to have left the company by the end of the year.
In this case, the turnover rate has been 40 percent among full-
time customer service representatives, 25 percent among part-
time customer service representatives, 5 percent among
supervisors, and 35 percent among managers. When reading the
table it is helpful to remember that for each cell the job
identified at the beginning of the row is the relevant starting
position (at the beginning of the time period captured by the
matrix), and the job identified at the top of the column is where
employees end up at the end of the time period captured by the
matrix.
The bottom row of Table 5-3 shows the forecasted employees in
each of the four jobs at the beginning of 2015. The numbers in
Table 5-3 come from multiplying the current number of
employees in each job by the transition probability in the
corresponding cell in Table 5-2. For example, multiplying the
400 current full-time customer service representative employees
by .40 (40 percent) gives us an estimate of 160 of those 400
employees being in the same job at the beginning of 2015.
Multiplying 400 by .10 (10 percent) gives us an estimate of 40
full-time customer service representatives becoming part-time
customer service representatives by 2015, and 40 being
promoted to supervisor. None of the 400 are expected to be
promoted to a manager's position by 2015 (400 x 0). In the
second row, multiplying the 150 part-time customer service
representatives by .20 gives us an estimated 30 still in the same
job in 2015, and multiplying 150 by .50 gives us an estimate of
75 of them becoming full-time customer service representatives
by 2015. Multiplying 150 by .05 gives us an estimate of
approximately eight of the part-time customer service
representatives being promoted to supervisor by 2015, perhaps
due to the completion of a degree. The numbers in bold on the
diagonal reflect the number of people in each job in 2014
expected to be in the same job at the beginning of 2015. In the
bottom row of the table are the column sums (in bold), which
represent the total number of people forecasted to be in the job
identified at the top of the column in 2014. In this case, the
company can expect to enter 2015 with 194 full-time customer
service representatives, 115 part-time customer service
representatives, 112 supervisors, and 17 managers, based on the
transition probabilities. A total of 207 employees will have left
the organization.
(
Current (2014)
)Predicted shortages and surpluses can be easily calculated by
subtracting current employee counts from estimated employee
counts. If the company expects to maintain its current staffing
levels, it is likely to have to hire from outside the organization
for three of the four positions (206 full-time customer service
representatives, 35 part-time customer service representatives,
and three managers). For supervisors, however, the company
can anticipate having 112 compared to its current number of 75.
This suggests that it may be facing a surplus of 37 supervisors
if the firm's internal movements and quit rates continue. This
could give the firm the opportunity to expand because the
company will have a surplus of supervisors. Or it could mean
that alternative promotion paths have to be considered for them
or that their promotion rates need to be reduced to prevent the
surplus.
(
Job Category (1)
Level (2)
FTCSR (3)
PTCSR (4)
SUP (5)
MGR (6)
Exit (7)
Employees (8)
Full-Time Customer Service
1
160
40
40
0
160
400
Representative (FTCSR)
Part-Time Customer Service
1
30
75
8
0
37
150
Representative (PTCSR)
Supervisor (SUP)
2
4
0
64
4
3
75
Manager (MGR)
3
0
0
0
13
7
20
Forecast for 2015
194
115
112
17
207
206
Deficit
35
Deficit
37
Surplus
3
Deficit
Exits
Forecasted Employees for 2015
Number of
)
Forecasting Employees Using the Transition Probability Matrix

More Related Content

Similar to 12 Chapter 5 • Forecasting and Planning 127Chapter 5 • Forecas.docx

Workforce Planning Practice by CIPD.pdf
Workforce Planning Practice by CIPD.pdfWorkforce Planning Practice by CIPD.pdf
Workforce Planning Practice by CIPD.pdfNigarish raihan
 
HUman Resource Planning
HUman Resource PlanningHUman Resource Planning
HUman Resource Planningdimplenift
 
Workforce planning
Workforce planningWorkforce planning
Workforce planningHudson
 
Running Header Staffing Plan for a Growing Business 1Staffin.docx
Running Header Staffing Plan for a Growing Business 1Staffin.docxRunning Header Staffing Plan for a Growing Business 1Staffin.docx
Running Header Staffing Plan for a Growing Business 1Staffin.docxanhlodge
 
People, Strategy & Workforce Planning
People, Strategy & Workforce PlanningPeople, Strategy & Workforce Planning
People, Strategy & Workforce PlanningSaloni Agarwal
 
Are You Ready for the Talent Exodus
Are You Ready for the Talent ExodusAre You Ready for the Talent Exodus
Are You Ready for the Talent ExodusInfor HCM
 
IntroductionWe all know that the four factors of producti.docx
IntroductionWe all know that the four factors of producti.docxIntroductionWe all know that the four factors of producti.docx
IntroductionWe all know that the four factors of producti.docxvrickens
 
Identifying Staffing Goals Creating hiring goals that are clearly .docx
Identifying Staffing Goals Creating hiring goals that are clearly .docxIdentifying Staffing Goals Creating hiring goals that are clearly .docx
Identifying Staffing Goals Creating hiring goals that are clearly .docxsheronlewthwaite
 
5 phases to craft talent management strategy
5 phases to craft talent management strategy5 phases to craft talent management strategy
5 phases to craft talent management strategyTalent World Consulting
 
Humanresourcesplanningrecruitment.pptx
Humanresourcesplanningrecruitment.pptxHumanresourcesplanningrecruitment.pptx
Humanresourcesplanningrecruitment.pptxMARISSA TAN
 
Page 2809.1Strategic Human Resource ManagementMAJOR QUESTION.docx
Page 2809.1Strategic Human Resource ManagementMAJOR QUESTION.docxPage 2809.1Strategic Human Resource ManagementMAJOR QUESTION.docx
Page 2809.1Strategic Human Resource ManagementMAJOR QUESTION.docxhoney690131
 
Getting talent on the right track
Getting talent on the right trackGetting talent on the right track
Getting talent on the right trackKrish Shankar
 
10 STRATEGIC WORKFORCE PLANNINGWayne F. Cascio, Herman Aguinis
10 STRATEGIC WORKFORCE PLANNINGWayne F. Cascio, Herman Aguinis10 STRATEGIC WORKFORCE PLANNINGWayne F. Cascio, Herman Aguinis
10 STRATEGIC WORKFORCE PLANNINGWayne F. Cascio, Herman AguinisBenitoSumpter862
 
10 STRATEGIC WORKFORCE PLANNINGWayne F. Cascio, Herman Aguinis
10 STRATEGIC WORKFORCE PLANNINGWayne F. Cascio, Herman Aguinis10 STRATEGIC WORKFORCE PLANNINGWayne F. Cascio, Herman Aguinis
10 STRATEGIC WORKFORCE PLANNINGWayne F. Cascio, Herman AguinisSantosConleyha
 
Talent Acquisition Strategies.pdf
Talent Acquisition Strategies.pdfTalent Acquisition Strategies.pdf
Talent Acquisition Strategies.pdfhrutikeshAnpat
 

Similar to 12 Chapter 5 • Forecasting and Planning 127Chapter 5 • Forecas.docx (20)

Workforce Planning Practice by CIPD.pdf
Workforce Planning Practice by CIPD.pdfWorkforce Planning Practice by CIPD.pdf
Workforce Planning Practice by CIPD.pdf
 
HUman Resource Planning
HUman Resource PlanningHUman Resource Planning
HUman Resource Planning
 
Workforce planning
Workforce planningWorkforce planning
Workforce planning
 
lecture 3.pptx
lecture 3.pptxlecture 3.pptx
lecture 3.pptx
 
Running Header Staffing Plan for a Growing Business 1Staffin.docx
Running Header Staffing Plan for a Growing Business 1Staffin.docxRunning Header Staffing Plan for a Growing Business 1Staffin.docx
Running Header Staffing Plan for a Growing Business 1Staffin.docx
 
Hr Planning
Hr PlanningHr Planning
Hr Planning
 
People, Strategy & Workforce Planning
People, Strategy & Workforce PlanningPeople, Strategy & Workforce Planning
People, Strategy & Workforce Planning
 
Human Resources Planning, Recruitment
Human Resources Planning, RecruitmentHuman Resources Planning, Recruitment
Human Resources Planning, Recruitment
 
Are You Ready for the Talent Exodus
Are You Ready for the Talent ExodusAre You Ready for the Talent Exodus
Are You Ready for the Talent Exodus
 
IntroductionWe all know that the four factors of producti.docx
IntroductionWe all know that the four factors of producti.docxIntroductionWe all know that the four factors of producti.docx
IntroductionWe all know that the four factors of producti.docx
 
Identifying Staffing Goals Creating hiring goals that are clearly .docx
Identifying Staffing Goals Creating hiring goals that are clearly .docxIdentifying Staffing Goals Creating hiring goals that are clearly .docx
Identifying Staffing Goals Creating hiring goals that are clearly .docx
 
5 phases to craft talent management strategy
5 phases to craft talent management strategy5 phases to craft talent management strategy
5 phases to craft talent management strategy
 
Humanresourcesplanningrecruitment.pptx
Humanresourcesplanningrecruitment.pptxHumanresourcesplanningrecruitment.pptx
Humanresourcesplanningrecruitment.pptx
 
Page 2809.1Strategic Human Resource ManagementMAJOR QUESTION.docx
Page 2809.1Strategic Human Resource ManagementMAJOR QUESTION.docxPage 2809.1Strategic Human Resource ManagementMAJOR QUESTION.docx
Page 2809.1Strategic Human Resource ManagementMAJOR QUESTION.docx
 
Recruitment consultant (hrm, slim)
Recruitment consultant (hrm, slim)Recruitment consultant (hrm, slim)
Recruitment consultant (hrm, slim)
 
Getting talent on the right track
Getting talent on the right trackGetting talent on the right track
Getting talent on the right track
 
10 STRATEGIC WORKFORCE PLANNINGWayne F. Cascio, Herman Aguinis
10 STRATEGIC WORKFORCE PLANNINGWayne F. Cascio, Herman Aguinis10 STRATEGIC WORKFORCE PLANNINGWayne F. Cascio, Herman Aguinis
10 STRATEGIC WORKFORCE PLANNINGWayne F. Cascio, Herman Aguinis
 
10 STRATEGIC WORKFORCE PLANNINGWayne F. Cascio, Herman Aguinis
10 STRATEGIC WORKFORCE PLANNINGWayne F. Cascio, Herman Aguinis10 STRATEGIC WORKFORCE PLANNINGWayne F. Cascio, Herman Aguinis
10 STRATEGIC WORKFORCE PLANNINGWayne F. Cascio, Herman Aguinis
 
Talent Acquisition Strategies.pdf
Talent Acquisition Strategies.pdfTalent Acquisition Strategies.pdf
Talent Acquisition Strategies.pdf
 
HAATWORK
HAATWORKHAATWORK
HAATWORK
 

More from hyacinthshackley2629

Your company nameYour nameInstruction Page1. O.docx
Your company nameYour nameInstruction Page1. O.docxYour company nameYour nameInstruction Page1. O.docx
Your company nameYour nameInstruction Page1. O.docxhyacinthshackley2629
 
Your Company NameYour Company NameBudget Proposalfor[ent.docx
Your Company NameYour Company NameBudget Proposalfor[ent.docxYour Company NameYour Company NameBudget Proposalfor[ent.docx
Your Company NameYour Company NameBudget Proposalfor[ent.docxhyacinthshackley2629
 
Your company recently reviewed the results of a penetration test.docx
Your company recently reviewed the results of a penetration test.docxYour company recently reviewed the results of a penetration test.docx
Your company recently reviewed the results of a penetration test.docxhyacinthshackley2629
 
Your company wants to explore moving much of their data and info.docx
Your company wants to explore moving much of their data and info.docxYour company wants to explore moving much of their data and info.docx
Your company wants to explore moving much of their data and info.docxhyacinthshackley2629
 
Your company plans to establish MNE manufacturing operations in Sout.docx
Your company plans to establish MNE manufacturing operations in Sout.docxYour company plans to establish MNE manufacturing operations in Sout.docx
Your company plans to establish MNE manufacturing operations in Sout.docxhyacinthshackley2629
 
Your company just purchased a Dell server MD1420 DAS to use to store.docx
Your company just purchased a Dell server MD1420 DAS to use to store.docxYour company just purchased a Dell server MD1420 DAS to use to store.docx
Your company just purchased a Dell server MD1420 DAS to use to store.docxhyacinthshackley2629
 
your company is moving to a new HRpayroll system that is sponsored .docx
your company is moving to a new HRpayroll system that is sponsored .docxyour company is moving to a new HRpayroll system that is sponsored .docx
your company is moving to a new HRpayroll system that is sponsored .docxhyacinthshackley2629
 
Your company is considering the implementation of a technology s.docx
Your company is considering the implementation of a technology s.docxYour company is considering the implementation of a technology s.docx
Your company is considering the implementation of a technology s.docxhyacinthshackley2629
 
Your company is a security service contractor that consults with bus.docx
Your company is a security service contractor that consults with bus.docxYour company is a security service contractor that consults with bus.docx
Your company is a security service contractor that consults with bus.docxhyacinthshackley2629
 
Your company has just sent you to a Project Management Conference on.docx
Your company has just sent you to a Project Management Conference on.docxYour company has just sent you to a Project Management Conference on.docx
Your company has just sent you to a Project Management Conference on.docxhyacinthshackley2629
 
Your company has designed an information system for a library.  The .docx
Your company has designed an information system for a library.  The .docxYour company has designed an information system for a library.  The .docx
Your company has designed an information system for a library.  The .docxhyacinthshackley2629
 
Your company has had embedded HR generalists in business units for t.docx
Your company has had embedded HR generalists in business units for t.docxYour company has had embedded HR generalists in business units for t.docx
Your company has had embedded HR generalists in business units for t.docxhyacinthshackley2629
 
Your company You are a new Supply Chain Analyst with the ACME.docx
Your company   You are a new Supply Chain Analyst with the ACME.docxYour company   You are a new Supply Chain Analyst with the ACME.docx
Your company You are a new Supply Chain Analyst with the ACME.docxhyacinthshackley2629
 
Your company has asked that you create a survey to collect data .docx
Your company has asked that you create a survey to collect data .docxYour company has asked that you create a survey to collect data .docx
Your company has asked that you create a survey to collect data .docxhyacinthshackley2629
 
Your Communications PlanDescriptionA.What is your .docx
Your Communications PlanDescriptionA.What is your .docxYour Communications PlanDescriptionA.What is your .docx
Your Communications PlanDescriptionA.What is your .docxhyacinthshackley2629
 
Your community includes people from diverse backgrounds. Answer .docx
Your community includes people from diverse backgrounds. Answer .docxYour community includes people from diverse backgrounds. Answer .docx
Your community includes people from diverse backgrounds. Answer .docxhyacinthshackley2629
 
Your Communications Plan Please respond to the following.docx
Your Communications Plan Please respond to the following.docxYour Communications Plan Please respond to the following.docx
Your Communications Plan Please respond to the following.docxhyacinthshackley2629
 
Your Communication InvestigationFor your mission after reading y.docx
Your Communication InvestigationFor your mission after reading y.docxYour Communication InvestigationFor your mission after reading y.docx
Your Communication InvestigationFor your mission after reading y.docxhyacinthshackley2629
 
Your Communications PlanFirst step Choose a topic. Revi.docx
Your Communications PlanFirst step Choose a topic. Revi.docxYour Communications PlanFirst step Choose a topic. Revi.docx
Your Communications PlanFirst step Choose a topic. Revi.docxhyacinthshackley2629
 
Your coffee franchise cleared for business in both countries (Mexico.docx
Your coffee franchise cleared for business in both countries (Mexico.docxYour coffee franchise cleared for business in both countries (Mexico.docx
Your coffee franchise cleared for business in both countries (Mexico.docxhyacinthshackley2629
 

More from hyacinthshackley2629 (20)

Your company nameYour nameInstruction Page1. O.docx
Your company nameYour nameInstruction Page1. O.docxYour company nameYour nameInstruction Page1. O.docx
Your company nameYour nameInstruction Page1. O.docx
 
Your Company NameYour Company NameBudget Proposalfor[ent.docx
Your Company NameYour Company NameBudget Proposalfor[ent.docxYour Company NameYour Company NameBudget Proposalfor[ent.docx
Your Company NameYour Company NameBudget Proposalfor[ent.docx
 
Your company recently reviewed the results of a penetration test.docx
Your company recently reviewed the results of a penetration test.docxYour company recently reviewed the results of a penetration test.docx
Your company recently reviewed the results of a penetration test.docx
 
Your company wants to explore moving much of their data and info.docx
Your company wants to explore moving much of their data and info.docxYour company wants to explore moving much of their data and info.docx
Your company wants to explore moving much of their data and info.docx
 
Your company plans to establish MNE manufacturing operations in Sout.docx
Your company plans to establish MNE manufacturing operations in Sout.docxYour company plans to establish MNE manufacturing operations in Sout.docx
Your company plans to establish MNE manufacturing operations in Sout.docx
 
Your company just purchased a Dell server MD1420 DAS to use to store.docx
Your company just purchased a Dell server MD1420 DAS to use to store.docxYour company just purchased a Dell server MD1420 DAS to use to store.docx
Your company just purchased a Dell server MD1420 DAS to use to store.docx
 
your company is moving to a new HRpayroll system that is sponsored .docx
your company is moving to a new HRpayroll system that is sponsored .docxyour company is moving to a new HRpayroll system that is sponsored .docx
your company is moving to a new HRpayroll system that is sponsored .docx
 
Your company is considering the implementation of a technology s.docx
Your company is considering the implementation of a technology s.docxYour company is considering the implementation of a technology s.docx
Your company is considering the implementation of a technology s.docx
 
Your company is a security service contractor that consults with bus.docx
Your company is a security service contractor that consults with bus.docxYour company is a security service contractor that consults with bus.docx
Your company is a security service contractor that consults with bus.docx
 
Your company has just sent you to a Project Management Conference on.docx
Your company has just sent you to a Project Management Conference on.docxYour company has just sent you to a Project Management Conference on.docx
Your company has just sent you to a Project Management Conference on.docx
 
Your company has designed an information system for a library.  The .docx
Your company has designed an information system for a library.  The .docxYour company has designed an information system for a library.  The .docx
Your company has designed an information system for a library.  The .docx
 
Your company has had embedded HR generalists in business units for t.docx
Your company has had embedded HR generalists in business units for t.docxYour company has had embedded HR generalists in business units for t.docx
Your company has had embedded HR generalists in business units for t.docx
 
Your company You are a new Supply Chain Analyst with the ACME.docx
Your company   You are a new Supply Chain Analyst with the ACME.docxYour company   You are a new Supply Chain Analyst with the ACME.docx
Your company You are a new Supply Chain Analyst with the ACME.docx
 
Your company has asked that you create a survey to collect data .docx
Your company has asked that you create a survey to collect data .docxYour company has asked that you create a survey to collect data .docx
Your company has asked that you create a survey to collect data .docx
 
Your Communications PlanDescriptionA.What is your .docx
Your Communications PlanDescriptionA.What is your .docxYour Communications PlanDescriptionA.What is your .docx
Your Communications PlanDescriptionA.What is your .docx
 
Your community includes people from diverse backgrounds. Answer .docx
Your community includes people from diverse backgrounds. Answer .docxYour community includes people from diverse backgrounds. Answer .docx
Your community includes people from diverse backgrounds. Answer .docx
 
Your Communications Plan Please respond to the following.docx
Your Communications Plan Please respond to the following.docxYour Communications Plan Please respond to the following.docx
Your Communications Plan Please respond to the following.docx
 
Your Communication InvestigationFor your mission after reading y.docx
Your Communication InvestigationFor your mission after reading y.docxYour Communication InvestigationFor your mission after reading y.docx
Your Communication InvestigationFor your mission after reading y.docx
 
Your Communications PlanFirst step Choose a topic. Revi.docx
Your Communications PlanFirst step Choose a topic. Revi.docxYour Communications PlanFirst step Choose a topic. Revi.docx
Your Communications PlanFirst step Choose a topic. Revi.docx
 
Your coffee franchise cleared for business in both countries (Mexico.docx
Your coffee franchise cleared for business in both countries (Mexico.docxYour coffee franchise cleared for business in both countries (Mexico.docx
Your coffee franchise cleared for business in both countries (Mexico.docx
 

Recently uploaded

Capitol Tech U Doctoral Presentation - April 2024.pptx
Capitol Tech U Doctoral Presentation - April 2024.pptxCapitol Tech U Doctoral Presentation - April 2024.pptx
Capitol Tech U Doctoral Presentation - April 2024.pptxCapitolTechU
 
POINT- BIOCHEMISTRY SEM 2 ENZYMES UNIT 5.pptx
POINT- BIOCHEMISTRY SEM 2 ENZYMES UNIT 5.pptxPOINT- BIOCHEMISTRY SEM 2 ENZYMES UNIT 5.pptx
POINT- BIOCHEMISTRY SEM 2 ENZYMES UNIT 5.pptxSayali Powar
 
call girls in Kamla Market (DELHI) 🔝 >༒9953330565🔝 genuine Escort Service 🔝✔️✔️
call girls in Kamla Market (DELHI) 🔝 >༒9953330565🔝 genuine Escort Service 🔝✔️✔️call girls in Kamla Market (DELHI) 🔝 >༒9953330565🔝 genuine Escort Service 🔝✔️✔️
call girls in Kamla Market (DELHI) 🔝 >༒9953330565🔝 genuine Escort Service 🔝✔️✔️9953056974 Low Rate Call Girls In Saket, Delhi NCR
 
Full Stack Web Development Course for Beginners
Full Stack Web Development Course  for BeginnersFull Stack Web Development Course  for Beginners
Full Stack Web Development Course for BeginnersSabitha Banu
 
Roles & Responsibilities in Pharmacovigilance
Roles & Responsibilities in PharmacovigilanceRoles & Responsibilities in Pharmacovigilance
Roles & Responsibilities in PharmacovigilanceSamikshaHamane
 
What is Model Inheritance in Odoo 17 ERP
What is Model Inheritance in Odoo 17 ERPWhat is Model Inheritance in Odoo 17 ERP
What is Model Inheritance in Odoo 17 ERPCeline George
 
Employee wellbeing at the workplace.pptx
Employee wellbeing at the workplace.pptxEmployee wellbeing at the workplace.pptx
Employee wellbeing at the workplace.pptxNirmalaLoungPoorunde1
 
Pharmacognosy Flower 3. Compositae 2023.pdf
Pharmacognosy Flower 3. Compositae 2023.pdfPharmacognosy Flower 3. Compositae 2023.pdf
Pharmacognosy Flower 3. Compositae 2023.pdfMahmoud M. Sallam
 
Types of Journalistic Writing Grade 8.pptx
Types of Journalistic Writing Grade 8.pptxTypes of Journalistic Writing Grade 8.pptx
Types of Journalistic Writing Grade 8.pptxEyham Joco
 
Solving Puzzles Benefits Everyone (English).pptx
Solving Puzzles Benefits Everyone (English).pptxSolving Puzzles Benefits Everyone (English).pptx
Solving Puzzles Benefits Everyone (English).pptxOH TEIK BIN
 
ENGLISH 7_Q4_LESSON 2_ Employing a Variety of Strategies for Effective Interp...
ENGLISH 7_Q4_LESSON 2_ Employing a Variety of Strategies for Effective Interp...ENGLISH 7_Q4_LESSON 2_ Employing a Variety of Strategies for Effective Interp...
ENGLISH 7_Q4_LESSON 2_ Employing a Variety of Strategies for Effective Interp...JhezDiaz1
 
How to Make a Pirate ship Primary Education.pptx
How to Make a Pirate ship Primary Education.pptxHow to Make a Pirate ship Primary Education.pptx
How to Make a Pirate ship Primary Education.pptxmanuelaromero2013
 
Gas measurement O2,Co2,& ph) 04/2024.pptx
Gas measurement O2,Co2,& ph) 04/2024.pptxGas measurement O2,Co2,& ph) 04/2024.pptx
Gas measurement O2,Co2,& ph) 04/2024.pptxDr.Ibrahim Hassaan
 
Introduction to ArtificiaI Intelligence in Higher Education
Introduction to ArtificiaI Intelligence in Higher EducationIntroduction to ArtificiaI Intelligence in Higher Education
Introduction to ArtificiaI Intelligence in Higher Educationpboyjonauth
 
ECONOMIC CONTEXT - LONG FORM TV DRAMA - PPT
ECONOMIC CONTEXT - LONG FORM TV DRAMA - PPTECONOMIC CONTEXT - LONG FORM TV DRAMA - PPT
ECONOMIC CONTEXT - LONG FORM TV DRAMA - PPTiammrhaywood
 
Hierarchy of management that covers different levels of management
Hierarchy of management that covers different levels of managementHierarchy of management that covers different levels of management
Hierarchy of management that covers different levels of managementmkooblal
 
Historical philosophical, theoretical, and legal foundations of special and i...
Historical philosophical, theoretical, and legal foundations of special and i...Historical philosophical, theoretical, and legal foundations of special and i...
Historical philosophical, theoretical, and legal foundations of special and i...jaredbarbolino94
 

Recently uploaded (20)

Model Call Girl in Bikash Puri Delhi reach out to us at 🔝9953056974🔝
Model Call Girl in Bikash Puri  Delhi reach out to us at 🔝9953056974🔝Model Call Girl in Bikash Puri  Delhi reach out to us at 🔝9953056974🔝
Model Call Girl in Bikash Puri Delhi reach out to us at 🔝9953056974🔝
 
Capitol Tech U Doctoral Presentation - April 2024.pptx
Capitol Tech U Doctoral Presentation - April 2024.pptxCapitol Tech U Doctoral Presentation - April 2024.pptx
Capitol Tech U Doctoral Presentation - April 2024.pptx
 
POINT- BIOCHEMISTRY SEM 2 ENZYMES UNIT 5.pptx
POINT- BIOCHEMISTRY SEM 2 ENZYMES UNIT 5.pptxPOINT- BIOCHEMISTRY SEM 2 ENZYMES UNIT 5.pptx
POINT- BIOCHEMISTRY SEM 2 ENZYMES UNIT 5.pptx
 
call girls in Kamla Market (DELHI) 🔝 >༒9953330565🔝 genuine Escort Service 🔝✔️✔️
call girls in Kamla Market (DELHI) 🔝 >༒9953330565🔝 genuine Escort Service 🔝✔️✔️call girls in Kamla Market (DELHI) 🔝 >༒9953330565🔝 genuine Escort Service 🔝✔️✔️
call girls in Kamla Market (DELHI) 🔝 >༒9953330565🔝 genuine Escort Service 🔝✔️✔️
 
Full Stack Web Development Course for Beginners
Full Stack Web Development Course  for BeginnersFull Stack Web Development Course  for Beginners
Full Stack Web Development Course for Beginners
 
Roles & Responsibilities in Pharmacovigilance
Roles & Responsibilities in PharmacovigilanceRoles & Responsibilities in Pharmacovigilance
Roles & Responsibilities in Pharmacovigilance
 
What is Model Inheritance in Odoo 17 ERP
What is Model Inheritance in Odoo 17 ERPWhat is Model Inheritance in Odoo 17 ERP
What is Model Inheritance in Odoo 17 ERP
 
Employee wellbeing at the workplace.pptx
Employee wellbeing at the workplace.pptxEmployee wellbeing at the workplace.pptx
Employee wellbeing at the workplace.pptx
 
Pharmacognosy Flower 3. Compositae 2023.pdf
Pharmacognosy Flower 3. Compositae 2023.pdfPharmacognosy Flower 3. Compositae 2023.pdf
Pharmacognosy Flower 3. Compositae 2023.pdf
 
Types of Journalistic Writing Grade 8.pptx
Types of Journalistic Writing Grade 8.pptxTypes of Journalistic Writing Grade 8.pptx
Types of Journalistic Writing Grade 8.pptx
 
Solving Puzzles Benefits Everyone (English).pptx
Solving Puzzles Benefits Everyone (English).pptxSolving Puzzles Benefits Everyone (English).pptx
Solving Puzzles Benefits Everyone (English).pptx
 
Model Call Girl in Tilak Nagar Delhi reach out to us at 🔝9953056974🔝
Model Call Girl in Tilak Nagar Delhi reach out to us at 🔝9953056974🔝Model Call Girl in Tilak Nagar Delhi reach out to us at 🔝9953056974🔝
Model Call Girl in Tilak Nagar Delhi reach out to us at 🔝9953056974🔝
 
ENGLISH 7_Q4_LESSON 2_ Employing a Variety of Strategies for Effective Interp...
ENGLISH 7_Q4_LESSON 2_ Employing a Variety of Strategies for Effective Interp...ENGLISH 7_Q4_LESSON 2_ Employing a Variety of Strategies for Effective Interp...
ENGLISH 7_Q4_LESSON 2_ Employing a Variety of Strategies for Effective Interp...
 
How to Make a Pirate ship Primary Education.pptx
How to Make a Pirate ship Primary Education.pptxHow to Make a Pirate ship Primary Education.pptx
How to Make a Pirate ship Primary Education.pptx
 
Gas measurement O2,Co2,& ph) 04/2024.pptx
Gas measurement O2,Co2,& ph) 04/2024.pptxGas measurement O2,Co2,& ph) 04/2024.pptx
Gas measurement O2,Co2,& ph) 04/2024.pptx
 
Introduction to ArtificiaI Intelligence in Higher Education
Introduction to ArtificiaI Intelligence in Higher EducationIntroduction to ArtificiaI Intelligence in Higher Education
Introduction to ArtificiaI Intelligence in Higher Education
 
ECONOMIC CONTEXT - LONG FORM TV DRAMA - PPT
ECONOMIC CONTEXT - LONG FORM TV DRAMA - PPTECONOMIC CONTEXT - LONG FORM TV DRAMA - PPT
ECONOMIC CONTEXT - LONG FORM TV DRAMA - PPT
 
Hierarchy of management that covers different levels of management
Hierarchy of management that covers different levels of managementHierarchy of management that covers different levels of management
Hierarchy of management that covers different levels of management
 
Historical philosophical, theoretical, and legal foundations of special and i...
Historical philosophical, theoretical, and legal foundations of special and i...Historical philosophical, theoretical, and legal foundations of special and i...
Historical philosophical, theoretical, and legal foundations of special and i...
 
ESSENTIAL of (CS/IT/IS) class 06 (database)
ESSENTIAL of (CS/IT/IS) class 06 (database)ESSENTIAL of (CS/IT/IS) class 06 (database)
ESSENTIAL of (CS/IT/IS) class 06 (database)
 

12 Chapter 5 • Forecasting and Planning 127Chapter 5 • Forecas.docx

  • 1. 12 Chapter 5 • Forecasting and Planning 127 Chapter 5 • Forecasting and Planning 127 The competition for good employees is particularly fierce for smaller companies, who, despite providing the majority of new jobs in the United States,8 have a more difficult time hiring in general. Forecasting and planning let firms better manage talent shortages and surpluses. By understanding business cycles, the business needs of their firms, the current talent in their firms, and the pipelines for finding future talent, HR professionals can proactively reduce the impact the greater competition for talent will have. Workforce planning is a strategic process that allows an organization to predict and manage its talent supply and demand. The goal of this process is to enable the organization to attain its business goals and execute its strategy. Because business leader input is as important as HR input, workforce planning is an organizational initiative, not something solely done by HR. Despite the clear advantages of forecasting and planning, many organizations respond to their staffing needs reactively rather than proactively. In other words, they do little planning and simply work to fill positions as they open up. Jim Robbins, the former president and CEO of Cox Communications, put it this way: "We spend four months per year on the budget process, but we hardly spend any time talking about our talent, our strengths and how to leverage them, our talent needs and how to build them. Everyone is held accountable for their budget. But no one is held accountable for the strength of their talent pool. Isn't it the talent we have in each unit that drives our results? Aren't we missing something?" At Corning, a leader in specialty glass and ceramics, talent planning is the "bridge that translates business strategy into talent strategy."10 Corning knows that its talent portfolio influences its success. Over- or understaffed units affect the
  • 2. company's cost structure, cash flow, and ability to deliver its products. The wrong skill mix can mean missed market opportunities if the workforce is underskilled or, if the workforce is overskilled, cost structures that undermine profitability. To keep its skill mix optimized, every spring Corning models its future talent needs across multiple scenarios and then analyzes strategies to close any gaps.11 In this chapter, we discuss the importance of understanding the organization's business strategy, goals, and competitive environment to identify what talents the firm will need. Ensuring that the right people are in place at the right time requires forecasting the firm's labor demand and maintaining an awareness of the relevant pipelines for its labor supply. Action plans can then be developed to address any gaps between the two. After reading this chapter, you will have a good understanding of the workforce forecasting and planning process. THE WORKFORCE PLANNING PROCESS The workforce planning process, which is illustrated in Figure 5-1, typically includes the following five steps: 1. Identify the firm's business strategy. A firm's strategic vision, mission, and strategy affect its current and future staffing requirements by influencing the types and numbers of employees needed. 2. Articulate the firm's talent philosophy and strategic staffing decisions. As you learned in Chapter 2, firms differ in their commitment to things like promoting workers, retaining workers, and their preferences for hiring people with certain skills or training them after they are hired. Because these factors influence the nature of the firm's future labor supply and the type of workers it will need, they are important to understand when forecasting and planning. 3. Conduct a workforce analysis. Forecast both labor demand and labor supply and identify any gaps between the two.
  • 3. 4. Develop and implement action plans. Develop action plans to address any gaps between labor demand and labor supply forecasts. The plans should be consistent with the firm's talent philosophy, and can include both short- and long-term recruiting, retention, compensation, succession management, and training and development plans. For example, addressing the issues related to an aging workforce or a workforce with many employees who are roughly the same age might require longer-term action plans. 5. Monitor, evaluate, and revise the forecasts and action plans. Evaluate how effective the firm's workforce plan has been in terms of meeting the company's recruiting and hiring goals. As the business environment changes, the firm's forecasts and action plans may need to change, too. 118 Chapter 5 • Forecasting and Planning Chapter 5 • Forecasting and Planning 117 6. Identify the Firm's Talent Philosophy and Strategic Staffing Goals i Business Strategy Forecast the Firm's Demand for Labor -Which jobs will the firm need? -What competencies does the business strategy require? -What is the firm's expected level of business activity? -How many workers are needed?
  • 4. Forecast the Supply of Labor Available in the Market -Which competencies are available? -Will the firm be able to find those competencies internally or externally? -How many external workers possess those competencies? Identify Gaps (Projected labor surpluses or shortages) Develop Action Plan(s) to Address the Forecasted Talent Gaps Monitor, Evaluate, and Revise the Forecasts and Action Plans 2 Chapter 5 • Forecasting and Planning 118 Chapter 5 • Forecasting and Planning 3 FIGURE 5-1 The Workforce Planning Process Forecasting is not an exact science, and it is rare for a forecast to be exactly right. Given this uncertainty, it is usually best to construct estimates as a range—with low, probable, and high estimates—and then recalculate those estimates as the
  • 5. organization's internal and external environments change, along with the firm's assumptions about its workforce needs. Creating and implementing workforce plans is easier in more stable organizations and more challenging when a company faces rapidly changing conditions. With that said, the firms experiencing rapid changes will find planning the most valuable because it can guide their recruiting and hiring actions in the face of uncertainty.12 The time frame for workforce planning should reflect the length of the business planning cycle. Short-term workforce planning involves planning sourcing, recruiting, development, and separation activities the firm needs to do in the coming year. By contrast, long-term workforce planning involves doing the same activities but for a multiyear period. At the very least, workforce planning should be done for those positions throughout the organization whose execution is considered critical for the success of their units and the firm as a whole. If innovation and intangible assets, such as knowledge or creativity, generate a firm's competitive advantage, then top managers and knowledge workers are essential. If an organization's competitive advantage is based on service, its success depends on the quality and performance of its customer- facing employees.14 The accurate identification of these key positions is extremely important, as their being vacant or poorly staffed can affect the organization's ability to perform. Critical jobs and roles can occur at any organizational level. For example, think about what the most critical jobs might be in a hotel. You might have thought of the manager, or even the front desk staff who set the tone for guests' experiences. In fact, repeat business in the hotel industry is driven more by room cleanliness than by guests' interactions with front desk staff, making the housekeeping staff critical for creating a competitive advantage.15 Positions in which top performers significantly outperform average performers can also be important for a firm's workforce planning. Ensuring that the most effective and productive people possible are placed into
  • 6. these positions can positively affect a company's bottom line. Next, we discuss how an organization can forecast the future demand for its products and services, which, in turn, will affect its demand for labor. FORECASTING A FIRM'S LABOR DEMAND An organization's product demand directly affects its need for labor. On the one hand, if an organization is experiencing growing demand for what it does or makes, unless it plans to increase the automation of its manufacturing processes, it will probably need to hire more people to meet the increased demand. Even if the organization does plan to automate, the process of doing so is ■ likely to increase the firm's demand for people with different types of talent—people able to use and maintain the new machinery or technology, for example. On the other hand, if the demand for the organization's products or services is decreasing, the company's need for employees is likely to fall, perhaps to the point that it needs to downsize, or lay off, employees. When the demand for goods weakens during recessions, many employers downsize their workforces. Accurately forecasting business activity requires identifying key business activity factors, identifying quality sources of relevant forecasting information for those factors, and utilizing these sources to compile complete, accurate, and timely data. For example, Con-way Freight compiles monthly forecasts of customer demand, productivity goals, and scheduled and unscheduled absences to project hiring needs one to three months in advance.16 This enhances Con-way's recruiters' ability to recruit and onboard the needed drivers, which can take
  • 7. one to three months. The time frame for a business activity forecast is at the discretion of the organization. It may make sense for organizations in relatively stable, predictable environments to make five-year or even 10-year forecasts. Organizations in more dynamic, unpredictable environments may have great difficulty making reasonably accurate business forecasts for periods greater than 6 to 12 months out. Forecasts are best treated as dynamic estimates, and should be revisited and updated regularly as assumptions and environmental conditions change. Constructing short-, mid-, and long-range estimates is also useful because long-range forecasts are likely to be less accurate than short-range estimates due to the increased likelihood of environmental and organizational changes in the long term. There are many external sources of information firms can tap into to forecast the demand for their products. Next, we will discuss five of the most common types of information that can be used to evaluate general business trends in the economy: seasonal factors, interest rates, currency exchange rates, competitive changes, and industry and economic forecasts. Seasonal Forecasts For some organizations, business demands are seasonal and predictable. For example, United Parcel Service experiences a sharp increase in shipping volume from November to January every year due to holiday shipping demand. Landscaping firms know that they will need more workers in the spring and summer than in the winter. Because this increased seasonal demand occurs every year, it can be anticipated. For many organizations, business cycles are much less predictable. Occasional spikes and dips in the demand for an organization's products or services can be harder to forecast, but the better an organization can anticipate them, the better it will be able to have an appropriate workforce in place as needed.
  • 8. Interest Rate Forecasts Interest rate forecasts can project the likelihood that the organization will need or be able to build new plants and increase production in the near future. Higher interest rates discourage capital investment by making it more expensive for organizations to borrow money to fund their expansion plans. Higher interest rates make it more expensive for consumers to borrow money as well. As a result, product demand tends to decline when interest rates rise. By contrast, when interest rates fall, product demand rises. Rising interest rates generally suggest that the demand for labor will fall, whereas falling interest rates generally suggest that the demand for labor will rise. For example, when interest rates fall, the demand for homes tends to increase, increasing the demand for skilled trade workers and mortgage specialists. Currency Exchange Rate Forecasts For many companies, especially global ones, exchange rate forecasts are useful for forecasting business activity. If a country's currency is strengthening against other currencies, it means that one unit of the country's currency translates into greater amounts of the foreign currency than when the country's currency was weaker. This means that the country's companies can import goods and materials more cheaply because one unit of the domestic currency buys more foreign goods than it used to. However, this also means that country's products are more expensive overseas. For example, when the New Zealand dollar strengthened against the U.S. dollar, Jack Links, a New Zealand beef jerky maker, was forced to cut two-thirds of its workforce because it 4 Chapter 5 • Forecasting and Planning 119 Chapter 5 • Forecasting and Planning 119 became cheaper for the company1 s biggest U .S. customer to buy its jerky from Brazil, likewise, if a U.S. company does a lot of business internationally, a strengthening U.S. dollar usually
  • 9. translates into lower international demand for the firm's products and lower labor demand for the firm. What do you suppose happens when a country's currency weakens? As a country's currency weakens, the relative prices of its exported goods fall. The international demand for the country's products rises as a result, as does the country's demand for labor. Exchange rates can be volatile and difficult to predict in the long term. The more stable the exchange rate, the more accurate and useful the firm's product demand and labor forecasts will be. Competition-Based Forecasts If new competitors enter an industry, customers will have greater product choices, which will tend to dilute the demand for any one company's products or services. For example, in the face of increased competition from foreign carmakers, many U.S. carmakers, including GM and DaimlerChrysler, experienced declining demand for their products and downsized their workforces. Alternatively, if a firm leaves a market, then its surviving competitors might experience greater demand for their products or services. Industry and Economic Forecasts The information relevant to making a forecast is likely to differ for different companies and different industries. The Conference Board's Index of Leading Indicators, a commonly used barometer of economic activity over three to six months, presents a relatively broad picture of the economy. As such, the index can help identify trends leading to economic recessions or recoveries. The monthly Conference Board Consumer Confidence Index measures consumer sentiment by asking survey respondents questions about their perceptions of their job security and willingness to spend money. This index also can help predict future economic activity and thus demand for a company's products or services and associated labor needs. Additional economic indicators include gross domestic product (GDP), the business inventories and sales ratio tracked by the Department of Commerce, and the Purchasing Managers Index
  • 10. issued monthly by the Institute for Supply Management. Disappointing corporate earnings preannouncements from a firm's own customers can also suggest a declining demand for its products. Industries often have their own forecasts as well. The National Restaurant Association's annual industry forecast is one example. An organization can analyze its past product demand with regard to these indicators to identify which ones tended to accurately predict changes in its business activity, and then use that information to forecast the company's future labor demand. Legal Factors New legislation can also influence labor demand. The employer health insurance mandate in the 2010 Patient Protection & Affordable Care Act, also called Obamacare, requires employers with at least 50 full-time employees to provide government- approved, affordable health insurance to at least 95 percent of their employees and dependents beginning in 2014. If any of those employees receives government health insurance subsidies, the IRS will fine the employer up to $2,000 per employee. This is expected to affect staffing models, particularly for service jobs, and boost the temporary staffing industry as employers try to stay under 50 employees.18 Employers may impose strict limits on the duration of temporary worker assignments or send jobs overseas to avoid being affected by this law. Other Factors Additional factors can also indicate changing demand for the organization's products and services and the need for changes in the workforce. Some other factors that often cause companies to change the size of their workforce include: · An increase or decrease in consumer spending · An increase or decrease in the unemployment rate · An increase or decrease in the disposable income of consumers · Increased or decreased purchases of durable goods · Increased or decreased housing purchases 6 Chapter 5 • Forecasting and Planning 121
  • 11. 122 Chapter 5 • Forecasting and Planning 7 · Many firms start hiring as soon as the economy begins expanding so that new employees will be well trained and productive by the time the increased economic growth generates increased business activity for the firm. Some information the firm needs to forecast its sales can be generated internally. For example, by tracking a firm's incoming orders, managers can get an idea about what the likely order volume will be in the next month or quarter. Similarly, a company entering or exiting a particular line of business will know that its labor needs are likely to change accordingly. In other words, the firm will generate its forecasts based on its own internal business needs. Internal Forecasting Tools A firm can also forecast its labor demand, depending on the goals it has generated internally, which might include the following: · Achieving the staffing levels the firm needs to generate a given amount of revenue within a particular period of time (e.g., hiring enough salespeople to generate $5 million in revenue within six months) · Increasing the firm's staffing levels to execute a growth strategy · Decreasing the firm's staffing levels during a restructuring · Obtaining the new talent the firm needs to create new products or provide different services To better size their sales forces in each of their sales channels, companies, like Whirlpool, calculate the investment in human resources required to reach their optimum profit level. Sizing analyses and statistical models can identify if a company is slightly overstaffed in one area or has untapped potential in another. It is a good idea to identify the minimal as well as optimal staffing levels the firm needs to meet its goals. The most important labor demand forecasts are those for the positions and skills that will be central to the organization's intended strategic direction. For example, assume an
  • 12. organization is experiencing slow growth in its bricks-and- mortar facilities, but it is intending to roll out a new Web-based initiative for selling its product line. The firm's labor forecasts might indicate that its overall hiring will stay relatively flat. However, in light of the new strategic initiative, the company obviously will need experienced IT specialists, computer technicians, and software writers. It will also need customer service employees who are technologically competent. If it cannot hire these people, then the new Web-based initiative is likely to fail. There are many ways to forecast labor demand, and next, we will discuss four of the most common ones: ratio analysis, scatter plots, trend analysis, and judgmental forecasting. RATIO ANALYSIS The estimated level of business activity of the firm can be converted into the number of employees the company will need to attain this level of productivity by using past staffing ratios. A staffing ratio is a mathematical way of calculating the number of employees a firm needs to produce certain levels of output. A firm can then "index" the number of people it seeks to employ with the business metric. For example, a law firm might index the number of paralegals to the number of attorneys based on a staffing ratio of 3:2. In other words, the firm needs three paralegals for every two attorneys. At United Parcel Service, every 22 packages that cross a border support one job in its package operation.19 A ratio analysis assumes that there is a relatively fixed ratio between the number of employees needed and certain business metrics. Using historical patterns within the firm helps to establish a reasonable range for these ratios. Of course, the process can be used for either justifying new positions or demonstrating the need for layoffs. For example, assuming that a manufacturing facility has 100 employees and produces $20,000,000 of product annually, then the firm's production-to-employee ratio is $200,000:1. For every additional $200,000 of product the company wants to produce, it should hire an additional worker. Because some economies of
  • 13. scale will result from the expansion that will reduce the number of employees needed, organizations should consider their unique situation and adjust their forecasts accordingly. Other ratios that can be used in estimating target headcount levels include:
  • 14. STAFFING RATIO a mathematical way of calculating the number of employees a firm needs to produce certain levels of output · Revenue per employee · Managers to employees · · Inventory levels to employees · Store size to employees · Number of customers or customer orders to employees · Labor costs to all production costs · The percentage utilization of production capacity to employees If an organization expects its employee-productivity ratio to remain stable over the forecasting period, then simply applying the past ratio of employees to the productivity that's been forecasted for the upcoming period can be adequate. However, if the organization is experiencing a change in productivity per employee, due to technology, training, restructuring, and so on, then the application of past ratios such as this is inappropriate. Managers will often have a good idea of how estimates need to be adjusted, and their expertise should be incorporated into the process. In entirely novel situations for which past ratios do not exist, the only way to generate a reasonable staffing forecast is to rely on the judgment of the firm's managers. Although ratio analyses are limited to one predictor of labor demand at a time (labor hours per unit produced, for example), more advanced statistical techniques such as a regression analysis can be used to incorporate multiple predictors. For example, a regression analysis that incorporates sales forecasts, store sizes, mall
  • 15. traffic, and seasonal trends can be used to forecast the number of employees needed in a retail store. Of course, the underlying data used to construct any ratio or regression analysis must be credible and reliable. Otherwise, the forecast will not be accurate. Forecasting labor demand in small- and medium-size organizations can be more difficult because historical trends are likely to be more variable and because there is typically less historical information from which to draw. Additionally, adding one new person in a 10-employee company means expanding the workforce in 10 percent increments, which may not correspond to the growth rate of the business. Companies of all sizes often prefer to hire temporary or contingent workers until they are sure they need the additional employees. SCATTER PLOTS SCATTER PLOTS Scatter plots show graphically how two different variables—say, revenue a graphic that shows how two different and salesperson staffing levels—are related. For the purposes of forecasting labor demand, scat- variables are related ter plots help firms determine if a factor has historically been related to staffing levels. This information is then used to determine what staffing levels should be changed as the factor changes. This is related to correlation coefficients and regression analysis, which are discussed in Chapter 8. Assume that new housing developments are being built in the area served by Ambulance Express, a private ambulance service. The company wants to forecast its future requirements for ambulance drivers and knows that the more people living in its service area, the more drivers it will need to meet the community's needs. The staffing expert first collects data from six other ambulance services in the state to learn their number of ambulance drivers as well as the populations in their service areas. Table 5-1 summarizes these numbers. Figure 5-2 shows these two sets of numbers graphically in a scatter plot. The population served by the various ambulance
  • 16. services is indicated on the horizontal axis, and the corresponding number of ambulance drivers employed by each of the companies is indicated on the vertical axis. Each point on the graph reflects one company. Notice that a nearly straight line can be drawn between the points, as we have done on the graph. This leads us to conclude that there is a The Population Served as It Relates to the Required Number of Ambulance Drivers Population Served Number of Ambulance Drivers 12,500 2 25,000 5 30,000 5 35,000 6 50,000 10 60,000 11 122 Chapter 5 • Forecasting and Planning Chapter 5 • Forecasting and Planning 121 ( Population Served FIGURE 5-2 An Example of a Scatter Plot: The Relationship between the Population Served and the Number of Ambulance Drivers )direct, if not perfect, relationship between the two factors— that is, the number of people that can be served is directly related to the number of ambulance drivers. Therefore, the line can be used to predict the different staffing levels needed to serve the different population levels: Ambulance Express anticipates serving 43,000 people within two years. Starting on the horizontal axis, we located the point that reflects 43,000 people and then drew a dotted vertical line over to the solid diagonal line. From this point on the solid diagonal line, we drew a dotted horizontal line left to the vertical axis. The staffing level at which this horizontal line touches the vertical
  • 17. axis is the estimated number of ambulance drivers Ambulance Express will need. In this example, servicing 43,000 people will require eight drivers. TREND ANALYSIS Trend analysis involves looking at past employment patterns—the TREND ANALYSIS employer's, the industry's, or even the nation's patterns, for example—and using those patterns using past employment patterns to to predict a firm's future labor needs. For example, if a company has been growing 5 percent predict future needs annually for the last eight years, it might assume that it will experience the same 5 percent annual growth for the next few years. In other words, any employment trends likely to continue can be useful in terms of forecasting a firm's future labor demand. Figure 5-3 illustrates a trend analysis using a hypothetical example of a hospital's number of nurses educated internationally versus domestically from 2006 through 2013. The trend lines show that the number of domestically educated nurses has been steadily declining, and the number of internationally educated nurses has been steadily increasing over the last seven years. If it had been tracking these trends, the hospital might have decided to scale up its international recruiting efforts in time to manage this transition to a more internationally educated nursing force. Valero Energy Corporation used historical trends to accurately forecast its talent demand by division and title three years in advance. By putting five years of historical people records into a database, the company developed a series of mathematical algorithms used to do a trend analysis. The analysis allowed the company to predict its turnover by location, position type, salary, employee tenure, and division.20 Although this example shows that it can be done, trend analysis is rarely used by itself to make labor demand forecasts. So many factors can affect a company's staffing needs, including the firm's competition, economic environment, and changes in how the company gets its work done (automation might improve its productivity, for example), that the method can be difficult to use alone.
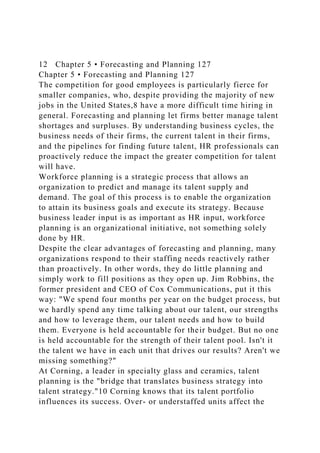
  • 18. JUDGMENTAL FORECASTING Instead of trying to identify past relationships between staffing levels and various factors as we did with the previous methods, judgmental forecasting relies on the experience and insights of people in the organization to predict a firm's future employment needs. Asking managers and supervisors about what they believe future staffing 8 Chapter 5 • Forecasting and Planning 123 Chapter 5 • Forecasting and Planning 123 ( □ Domestically Educated A Internationally Educated FIGURE 5-3 Domestically and Internationally Educated Nurses (2006-2013) )
  • 19. JUDGMENTAL FORECASTING relying on the experience and insights of people in the organization to predict a firm's future employment needs and employee skill levels can be is very insightful. Managers are often aware of what is going on in the lives of their subordinates and may be able to provide reasonably accurate predictions of their future labor supply. Likewise, managers are often aware of the retirement eligibility and intentions of their staff and can use this information to project likely talent losses several years into the future. Judgmental forecasting can be top-down, in which case the organization's leaders rely on their experience and knowledge of their industry and company to make predictions about the firm's future staffing levels needs. The estimates the top managers come up with then become staffing goals for lower-level managers in the organization. In some cases, particularly when companies are facing financial difficulties or restructuring, budgets may determine the firm's "headcount," or number of employees. Bottom-up judgmental forecasting uses the input of lower-level managers to estimate the firm's total staffing requirements. Each manager estimates the number of employees he or she needs to execute the firm's strategy. The estimates are consolidated and modified as they move up the organization's hierarchy to the firm's top managers, who then review and formalize the estimate. Because historical trends and relationships can change, it is usually best to supplement the more mechanical ratio, scatter plot, and trend forecasting methods with managerial judgment. The mechanical methods can be used as a starting point to make the estimates, and then managers can use their judgment to
  • 20. modify the estimates. 124 Chapter 5 • Forecasting and Planning 9 Chapter 5 • Forecasting and Planning 124 RETURN ON INVESTMENT ANALYSIS It is possible to estimate the return on investment from adding a new position based on the costs and outcomes resulting from that new hire. The first step is to assign dollar values to the benefits expected from a new hire for the period of time most appropriate for the position and the organization—it could be a month, a quarter, or a year. How much revenue during the period will be directly generated as a result of this position? How much money per period will this position save the organization in terms of increased efficiency, and how much value will it add in greater productivity, quality, or customer service? The sum of these figures is the value of adding this position. Next, the costs to advertise the position, interview and screen candidates, pay for their travel, and relocate, train, and compensate them is calculated. This is the initial investment the company has made in the new hires, which should then be divided into the value the new hire(s) brings to the company and multiplied by 100 to determine the firm's percentage return on its investment. For example, assume a store's new furniture salespeople generate an average of $60,000 in profit their first year. In addition, the reduced workload on the rest of the sales staff improves their efficiency and ability to provide high-quality customer service by 5 percent. This is worth an additional $15,000 to the company. If the cost of hiring and training a new salesperson is expected to be $7,000, and his or her salary is $25,000 before commissions, the return on investment of hiring an additional salesperson is predicted to be 234 percent. 100 X [($60,000 + $15,000)/($7,000 + $25,000)] =
  • 21. $75,000/$32,000 = 234% ROI Companies can incorporate other human resource data into their models, depending on what they want to forecast. Oil company Saudi Aramco's workforce projections include the corporate resources required to recruit, hire, and train new staff and to mentor employees during their careers.21 3M provides its business leaders information about important trends, and country-by-country comparisons of skills gaps, workforce demographics, productivity, and return on human capital investments.22 Many employers, particularly retailers, mistakenly treat labor costs as an easy target when cost cutting is needed, rather than treating employees and sufficient staffing levels as an investment that contributes directly to the company's performance. When Home Depot tried to boost profits by cutting staff and relying more heavily on part-time workers, customer satisfaction and sales growth fell. Similarly, Walmart's staff reduction efforts led to operational problems including understocked shelves, which led to decreased sales. Because Walmart links the number of hours for which managers can schedule employees to sales performance, declining sales can trigger a spiral of lower staffing levels, further customer service and sales declines, and additional cuts in work hours and headcount.23 FORECASTING A FIRM'S LABOR SUPPLY Strategic staffing requires firms to keep their fingers on the pulse of their labor markets. Therefore, understanding current and future skill and competency trends in the labor market is crucial. Information about the number and quality of employees likely to be available to an organization when it needs them should be considered while the organization is in the process of formulating its business strategy. For instance, attempting to grow a fiber optics firm by 20 percent a year might not be possible if there aren't a sufficient number of fiber optics engineers and technicians in the labor pool willing to work for
  • 22. salaries the firm is able to pay. It is obviously best for an organization (especially small firms that have a harder time attracting candidates) to have a reasonable estimate of the projected availability of talent for its key positions before developing a strategy that depends on this talent pool. The organization's internal and external labor markets will influence these estimates. We will discuss each one next. Forecasting the Internal Labor Market To determine the likely supply of a firm's internal talent at a future point in time, subtract the number of employees the firm anticipates losing via promotions, demotions, transfers, retirements, and resignations from the number of employees in the position at the beginning of the forecasting period. Then add any anticipated talent gains for the position from transfers, promotions, and demotions to the internal labor supply forecast. In tighter labor markets when workers are harder to find, more employees than usual may leave the organization to pursue other opportunities. Fewer employees may leave during looser labor markets when jobs are less plentiful. Analyzing a company's demographic mix and current turnover rates can help managers forecast how many current employees are likely to still be in the company's workforce at a given forecasting date. An organization that expanded rapidly in the past may find that a particularly large cohort of employees hired at roughly the same time will be retiring at about the same time, for example. This, of course, will mean that the firm will have to hire a large number of new employees to replace them. Given their better knowledge of their subordinates, supervising managers may also be able to reasonably estimate the percentage of their current workforce likely to be with the organization at some specified date in the future. Transition analysis, managerial judgment, talent inventories, and replacement charts are some of the methods that can be used to forecast internal talent resources, and will be explained next. TRANSITION ANALYSIS TRANSITION ANALYSIS A quantitative technique called a
  • 23. transition analysis (also called a quantitative tecnnique used to Markov analysis) is a simple technique that can be used to analyze a firm's internal labor analyze internal labor markets and markets and forecast its internal labor supply. Conducting a transition analysis can also help forecast internal labor supply 10 Chapter 5 • Forecasting and Planning 125 Chapter 5 • Forecasting and Planning 126 ( Feeder Position 1 Exits Lateral Moves/Transfers Demotions FIGURE 5-4 The Transition Analysis Process Illustrated )hiring managers answer applicants' questions about their potential paths for promotion and the firm's upsizing or downsizing plans. Figure 5-4 shows how a transition analysis works. Managers first identify all of the positions in the company that feed employees into the target position and to which employees in the target position tend to be promoted, demoted, or transferred. Ideally, all of the employees entering and leaving the target job are tracked so that the transition probability matrix is as accurate as possible. The cells in the transition probability matrix contain the percentage of employees staying in the same job, moving to a different job in the company, or exiting the company. As a numerical example, assume that it is the beginning of 2014, and the company needs to forecast the likely number of customer service representatives its call center will have at the beginning of 2015. Table 5-2 shows the transition probabilities—that is, the likelihood of people staying in their current position or moving—for four jobs reflecting three job levels in the organization based on data from the one-year
  • 24. period from January 1, 2013, to January 1, 2014. Full- and part-time customer service representatives are at the entry level, supervisors are at the middle job level, and managers are at the third job level. The last column identifies the number of employees currently working at each job at the beginning of 2014. The transition probabilities are in the third to seventh columns of the matrix, and reflect the probability that an employee who begins the year employed in the job identified to the left will be employed in the job identified at the top of the column or will have exited the organization by the end of the year. The numbers on the diagonal (in bold) reflect the probability that an employee who begins 2014 in the job named to the left will still be in that job one year later. A transition probability matrix is presented in Table 5-2. Reading across the first row indicates that 40 percent of the employees who begin 2014 as full-time customer service representatives are likely to still be working as customer service representatives at the beginning of 2015. Ten percent of the employees who begin the year working as a full-time customer service representative are likely to end the year working as a part-time customer service representative, and 10 percent are likely to have been promoted to supervisor. None of the employees beginning An Example of a Transition Probability Matrix Transition Probabilities (2013-2014) Current (2014) Job Category (1) Level (2) FTCSR (3) (%) PTCSR (4) (%) SUP (5) (%) MGR (6) (%)
  • 25. Exit (7) (%) Number of Employees (8) Full-Time Customer Service Representative (FTCSR) 1 40 10 10 0 40 400 Part-Time Customer Service Representative (PTCSR) 1 20 50 5 0 25 150 Supervisor (SUP) 2 5 0 85 5 5 75 Manager (MGR) 3 0 0 0 65 35 20 the year as a full-time customer service representative can be
  • 26. expected to be a manager by the end of the year. The "Exit" column reflects the percentage of employees in each job that can be expected to have left the company by the end of the year. In this case, the turnover rate has been 40 percent among full- time customer service representatives, 25 percent among part- time customer service representatives, 5 percent among supervisors, and 35 percent among managers. When reading the table it is helpful to remember that for each cell the job identified at the beginning of the row is the relevant starting position (at the beginning of the time period captured by the matrix), and the job identified at the top of the column is where employees end up at the end of the time period captured by the matrix. The bottom row of Table 5-3 shows the forecasted employees in each of the four jobs at the beginning of 2015. The numbers in Table 5-3 come from multiplying the current number of employees in each job by the transition probability in the corresponding cell in Table 5-2. For example, multiplying the 400 current full-time customer service representative employees by .40 (40 percent) gives us an estimate of 160 of those 400 employees being in the same job at the beginning of 2015. Multiplying 400 by .10 (10 percent) gives us an estimate of 40 full-time customer service representatives becoming part-time customer service representatives by 2015, and 40 being promoted to supervisor. None of the 400 are expected to be promoted to a manager's position by 2015 (400 x 0). In the second row, multiplying the 150 part-time customer service representatives by .20 gives us an estimated 30 still in the same job in 2015, and multiplying 150 by .50 gives us an estimate of 75 of them becoming full-time customer service representatives by 2015. Multiplying 150 by .05 gives us an estimate of approximately eight of the part-time customer service representatives being promoted to supervisor by 2015, perhaps due to the completion of a degree. The numbers in bold on the diagonal reflect the number of people in each job in 2014 expected to be in the same job at the beginning of 2015. In the
  • 27. bottom row of the table are the column sums (in bold), which represent the total number of people forecasted to be in the job identified at the top of the column in 2014. In this case, the company can expect to enter 2015 with 194 full-time customer service representatives, 115 part-time customer service representatives, 112 supervisors, and 17 managers, based on the transition probabilities. A total of 207 employees will have left the organization. ( Current (2014) )Predicted shortages and surpluses can be easily calculated by subtracting current employee counts from estimated employee counts. If the company expects to maintain its current staffing levels, it is likely to have to hire from outside the organization for three of the four positions (206 full-time customer service representatives, 35 part-time customer service representatives, and three managers). For supervisors, however, the company can anticipate having 112 compared to its current number of 75. This suggests that it may be facing a surplus of 37 supervisors if the firm's internal movements and quit rates continue. This could give the firm the opportunity to expand because the company will have a surplus of supervisors. Or it could mean that alternative promotion paths have to be considered for them or that their promotion rates need to be reduced to prevent the surplus. ( Job Category (1) Level (2) FTCSR (3) PTCSR (4) SUP (5) MGR (6) Exit (7) Employees (8) Full-Time Customer Service 1
  • 28. 160 40 40 0 160 400 Representative (FTCSR) Part-Time Customer Service 1 30 75 8 0 37 150 Representative (PTCSR) Supervisor (SUP) 2 4 0 64 4 3 75 Manager (MGR) 3 0 0 0 13 7 20 Forecast for 2015 194 115 112
  • 29. 17 207 206 Deficit 35 Deficit 37 Surplus 3 Deficit Exits Forecasted Employees for 2015 Number of ) Forecasting Employees Using the Transition Probability Matrix