California State University, Chico
Information: The Currency of Modern Business
The text book for BSIS 105
Jim Mensching
7/21/2014
Information: The Currency of Modern Business
Introduction
This text is specifically designed for the BSIS 105 course. This is the beginning BSIS course in the curriculum and is designed to introduce students to the way in which businesses operate. The emphasis of this course is not just business, but also how technology affects business. There are many textbooks available for beginning business courses; however none of them take the approach that we will be taking in this class.
Other textbooks approach the course from the functional point of view. That is, they’re looking at departmental functions and discuss how each department operates. While companies are still divided into functional areas, that is not the way modern organizations operate. Instead, they look at business processes and operate with respect to a series of business processes, which cut across functional boundaries. In this text we will be looking at business processes and will describe how those business processes are handled by the various people throughout the organization.
(
Figure
1
Assembly Line
Photo Source:
http://greenbusinessmatters.com/2012/02/25/add-clean-to-lean-manufacturing/
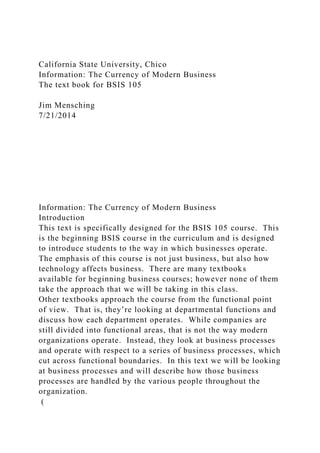
)One way to look at this situation is to think about the old way of doing things is what I would call the “bird’s eye view” and the way in which we’re going to look at it would be the “worm’s eye view”. With respect to the bird’s eye view what the bird sees is just the thing that it’s hovering over or the thing that it’s flying over. While with respect to the worm’s eye view as the worm goes through the ground, it sees everything that goes on from the beginning point to the end point. That is, they see the entire process not just specific parts of a process. Another way to look at this is with respect to an assembly line. In an assembly line each worker is given a specific task to do. All each worker is concerned with is doing their assigned job well. Hence, whatever happened before that worker and what happens after that worker is of no concern to each specific worker. In many cases the worker doesn’t really understand the entire process. The problem with this type of approach is that no matter how well each worker performs their task, if one worker fails at doing their task appropriately, than the end product will be flawed. So under these circumstances the only way to determine whether or not the product is of high quality is to do time consuming and costly testing and inspection at the end of the process. However, in a business process oriented approach everyone understands the entire process and has access to data about the entire process. So in the functional approach it is very difficult to streamline and improve a process since very few people see and understand the entire process. In some cases some or all of what an ...
California State University, ChicoInformation The Currency of M.docx
1. California State University, Chico
Information: The Currency of Modern Business
The text book for BSIS 105
Jim Mensching
7/21/2014
Information: The Currency of Modern Business
Introduction
This text is specifically designed for the BSIS 105 course. This
is the beginning BSIS course in the curriculum and is designed
to introduce students to the way in which businesses operate.
The emphasis of this course is not just business, but also how
technology affects business. There are many textbooks
available for beginning business courses; however none of them
take the approach that we will be taking in this class.
Other textbooks approach the course from the functional point
of view. That is, they’re looking at departmental functions and
discuss how each department operates. While companies are
still divided into functional areas, that is not the way modern
organizations operate. Instead, they look at business processes
and operate with respect to a series of business processes, which
cut across functional boundaries. In this text we will be looking
at business processes and will describe how those business
processes are handled by the various people throughout the
organization.
(
2. Figure
1
Assembly Line
Photo Source:
http://greenbusinessmatters.com/2012/02/25/add-clean-to-lean-
manufacturing/
)One way to look at this situation is to think about the old way
of doing things is what I would call the “bird’s eye view” and
the way in which we’re going to look at it would be the
“worm’s eye view”. With respect to the bird’s eye view what
the bird sees is just the thing that it’s hovering over or the thing
that it’s flying over. While with respect to the worm’s eye view
as the worm goes through the ground, it sees everything that
goes on from the beginning point to the end point. That is, they
see the entire process not just specific parts of a process.
Another way to look at this is with respect to an assembly line.
In an assembly line each worker is given a specific task to do.
All each worker is concerned with is doing their assigned job
well. Hence, whatever happened before that worker and what
happens after that worker is of no concern to each specific
worker. In many cases the worker doesn’t really understand the
entire process. The problem with this type of approach is that
no matter how well each worker performs their task, if one
worker fails at doing their task appropriately, than the end
product will be flawed. So under these circumstances the only
way to determine whether or not the product is of high quality
is to do time consuming and costly testing and inspection at the
end of the process. However, in a business process oriented
approach everyone understands the entire process and has
access to data about the entire process. So in the functional
approach it is very difficult to streamline and improve a process
since very few people see and understand the entire process. In
some cases some or all of what an employee is doing may no
longer be necessary or useful. Changes in technology or the
way the product is produced may make certain parts of a
3. process unnecessary, but under the functional view of the
business the process may not change.
So let’s look at an example of this. Let’s say a customer calls
the service department with a problem. The service
representative will ask the customer about a specific problem.
Under the old way of doing business, the service representatives
will ask about the specific problem the customer is having and
route the customer to the appropriate department to handle the
problem. For example, if the problem has to do with the credit
department, then the customer will be routed to the credit
department and the credit representatives will request additional
information. However, if the credit problem is really a billing
problem, then the customer will have to be routed over to the
accounting department. As you can see, this could be a serious
problem if the customer ends up being rerouted many times.
This may result in a very disgruntled customer, one who may
not want to do business with the company in the future.
However, if this is looked upon as a business process, then one
person will have all of the information available to handle the
customer’s problem since they will have visibility of the entire
business process. This should result in a satisfied customer.
(
Figure
2 Example Functional Departments with Overlapping Business
Processes
)This probably seems pretty intuitive to you and you may ask
why wasn’t this done this way all the time? The answer is
simple, there just wasn’t good enough technology to allow this
to happen. Everything was done with paper documents and the
person responsible for that document was the one responsible
for that part of the process. Even when computer technology
was first introduced into business, the manual procedures were
pretty much duplicated on the computer. While this resulted in
a substantial increase in productivity, the emphasis was not on
designing the best overall process, but on designing the separate
functional parts of the process. This is now known as legacy
4. computer systems.
But with the computer technology that’s available to businesses
presently, the integrated business process approach is the way
most businesses now operate. So as you’ll see as the course
progresses, computer technology has enabled businesses to
streamline their processes and introduce tremendous
efficiencies into their systems. So the approach we will take in
this book is to look at some of the individual business processes
and discuss how technology enables the process.
Unfortunately, the academic world has been slow to adjust to
these changes in business. As you will see as you go through
the curriculum, many of the courses take the bird’s eye view of
looking at a specific functional area and ignoring to a good
extent the other functions involved in business. For example,
you will take courses in economics, finance, human resource
management, production, accounting, etc. Most of these
courses will concentrate strictly on the topic involved in the
course and will not look at the entire business process involved
in a successful business. While in the academic world this isn’t
a gigantic problem, you must always keep in the back of your
mind that this is not the way in which businesses operate. So
the specific knowledge of each of these courses must be blended
so that you’ll understand all of the aspects of business. This is
our goal throughout the Business Information Systems
curriculum and we think that when you graduate, you will have
a firm grasp of this perspective. Not only does this perspective
help you understand business, this perspective is what our
business partners, those companies that hire our graduates, say
they need and it is one of the primary reasons they look so
favorably on the CSU Chico BIS degree students.
The Information Age
The title of this textbook needs a little explanation. When we
say that information is the currency of the modern business,
what we’re trying to convey is the fact that most businesses
today are very dependent on information coming from their
computer systems. Many people call this period of time “the
5. information age” because of the fact that there is such a wealth
of information available to companies from their information
systems that companies that try to operate without appropriate
information are at a distinct disadvantage. The days in which
decisions in business are made based on intuition or what many
people would term business experience are primarily a thing of
the past. Today decisions are made using the data from their
information system. This is termed being “data driven”. What
we’re saying is that most decisions in a business environment
must be backed up with data from the information system.
For example, if your boss asks you to do some research into
solving a problem, the expectation would be not to just give a
recommendation as to what action to take, but to provide a
detailed analysis showing the data that backs up whatever
recommendations you make. So let’s say that your boss, the
store manager, asks you to determine who the best customers
have been for the previous business year. If you gave your boss
just a list of the customer’s you think are the best customers,
that would not be ample justification. What your boss would
want to see is a recommendation plus the data that you used to
compile your recommendation list with a detailed analysis of
that data. For this example you might show a rank ordered list
of the customers by total purchases, number of store visits, total
profit from the sales, etc. (the list of possible data items could
be quite long).
Before information was as readily available as it is today, the
store manager might have come to the conclusion that the best
customers were the ones that the manager saw in the store most
frequently. Of course, this may not be a very good measure for
a variety of reasons. The manager may not be in the store the
entire time it is open. The customer that frequents the store
may not buy very much or whatever they buy they tend to
return. However, using the data to make this decision will
provide a much better view of who may be described as a “best
customer”.
Many decision makers will now say that whoever has the most
6. data and the highest quality data will make the best decisions
and will have the best performance as far as their companies are
concerned. As you will see as the course goes on, there are
many sources of data within a business. In fact the real problem
nowadays is not in gathering the data but in analyzing the data
and determining what data should be used. Just to give you a
little glimpse into what we will discuss in the course, there are
three major sources of data within most big companies. The
first and probably the most important is the operational data
that runs the company on a day-to-day basis. To give an
example of this type of data it would be all of the transactional
data that occurs for every transaction the company does. So
from this data we can see how much each customer purchased,
what they purchased and when they purchased it.
The second source of data is historical data that is used to make
longer-term decisions. This data is usually stored in what is
called a data warehouse. This is summary data that can go back
for years and many times decades. This data is used to make
strategic decisions such as building a new building, increasing
the capacity of a warehouse, whether or not to sell a new
product, and other decisions such as these.
The third form of data is what is called “big data”. This is a
new emerging capability of computer systems that store and
process non-numeric data that is tremendously voluminous.
Examples of this type of data would be things such as emails,
telephone calls, social media, video, and other data that can’t be
put into numeric digital form. We will discuss all of these data
types later in the course.
Data Type
Description
Operational Data
The most important data available to a company. This data is
necessary for a company’s daily activities.
Historical Data
7. Dated summary data used for strategic decisions. Not as
detailed as Operational Data.
Big Data
Non-numeric data of large proportions. This data can be
analyzed to provide information useful for a company’s
competitive advantage.
(
Figure
3 Three Major Data Source Descriptions
)
Not only have computers changed business from the point of
view of the availability of information, they have totally
changed the way in which businesses operate and even the way
many people live their lives. The Internet has been the force
that has caused this seismic shift in business and also in our
culture. We will be addressing these issues also in this text.
Micro vs. Macro Business View
In this book we will be taking what I’m going to call the micro
view of business. What this means is that we’ll be talking
primarily about the internal functions of a business and how
businesses operates internally. This is quite different than most
beginning business textbooks in that they primarily deal with
what might be termed the macro view of business. The macro
view deals with how businesses compete against each other and
how they deal with the various governmental agencies that
affect them. While these are important topics, they’ll be
covered in other courses. So in this course we will look at how
businesses are organized and function strictly based on internal
procedures. You’ll find that throughout your business
education many of your courses will primarily deal with a more
macro view.
So the emphasis in this course will be looking at how companies
deal with their customers, their vendors and other stakeholders.
We will look at the ways in which companies communicate with
these stakeholders and also how departments communicate with
8. each other within the company. We will first look at paper-
based systems and the documents that are involved in this type
of processing. Then we will extend this to computer-based
systems. You’ll see that these processes can be quite complex
and very often they will be different from one company to the
next.
We will not only be discussing these topics, but we will also be
using sophisticated software to illustrate how real companies do
their transactions. The software that we will use will be state of
the art software that many of the major companies in the world
use to run their businesses. While this will only be an
introduction to this software, you should find it very helpful in
understanding how businesses actually operate and also very
helpful in future courses.
Organization of the Text
The text will be organized in such a way that we will discuss
each of the three major business processes that most companies
have. Each business process will be discussed in its own
separate chapter. However, we start the text with an
introductory chapter that takes a rather general look at how
businesses operate. Most of the chapters will end with a
technical section that discusses some technical aspect of an
information system. The following provides a very brief
description of each of the chapters of the textbook.
Chapter 1
This chapter will be a general discussion of businesses, how
they are organized and introduce some of the business processes
to be discussed later in the text. The chapter will conclude with
a discussion of the Visio tool and its use in describing business
processes.
Chapter 2
This chapter discusses in detail the sales business process. It
breaks the business process into a series of sub processes and
also discusses the documents that would be used throughout the
process. We will first look at a manual system. Then the
chapter concludes with an introduction to the SAP system and
9. an assignment that will deal with the sales process within the
SAP system.
Chapter 3
This chapter discusses the purchasing business process. Again
it breaks this process into a series of sub processes and also
discusses the documents involved in the process. As in the
previous chapter, we will be doing work on the SAP system
with respect to the purchasing business process. In addition, we
will take a look at some of the career paths available to BIS
majors.
Chapter 4
This chapter deals with one of the more complex business
processes of an organization, the production process. Again,
we’ll be looking at the process and breaking it into sub
processes and examining some of the documents involved in the
process. However, because of the complexity of the process we
will only demonstrates some of the attributes of the SAP system
with respect to the process. We will also look at how to use
some of the intermediate functions of the Excel spreadsheet
system.
Chapter 5
This chapter deals with the way companies make decisions and
the types of data used in making decisions. We will discuss the
role of the operational system and the decision support systems
used in business and will see how data within these systems can
be analyzed and will use Excel to analyze some data.
Chapter 6
An introduction to computer operations will be covered in this
chapter. We discuss primarily hardware components of a
computer system and the role of software, especially the
operating system. We will introduce the role of programmers in
designing systems.
Chapter 7
This chapter describes the way computer technology is changing
business and the various emerging technologies. We will
discuss how the business environment is adapting to these
10. changes and discuss some implications of these changes. We
introduce Web page construction and have an associated
assignment in which you build a personal Web site.
Chapter 8
This final chapter ties up any loose ends in the course. We
summarize some of the other chapters and discuss additional
topics that were missed in the previous chapters.
The plan is to update this textbook every semester. So if you
have ideas with respect to improving the text, I would be very
appreciative if you shared them with me. I hope you find BIS
an interesting and challenging area of study and find this book
useful in achieving your learning goals.
Special Note:
You may have already noticed that certain terms in this
introduction have been highlighted. That means that the term is
defined in the glossary at the end of the text. This will not only
help you in defining unfamiliar terms, but should also be
helpful in studying for exams.
Information: The Currency of Modern BusinessChapter 1 – An
Overview of Business 1.1
This chapter gives you a broad overview of how businesses are
organized and how they operate. As you become more familiar
with the business world, you will find that there are many
things that at a cursory view are common to almost all
organizations whether they are businesses, not-for-profit
organizations or governmental units. For example, they all have
to hire and pay employees. They have to provide a good or a
11. service. They have to keep records and account for their
activities. However, at a lower level most companies, even
those in the same industry, will have differences in their
business processes. In some cases these differences can be
based on giving that company a competitive advantage over
their competitors. In other cases it may be that their business is
just different than other businesses. For our present discussion
we will deal in broad generalities and leave the important
differences to be discussed in subsequent courses.
Business Objectives 1.2
The objective of any business is to make a profit. This is
obvious. However, the best way to make a profit is a complex
question that involves many factors. Most of these types of
decisions are strategic in nature, so we will not explore them in
depth. However, many decisions of this type will need in depth
analysis of data from the information system.
While we will not discuss this aspect of business in detail, a
few examples may be useful to understand the complexity of the
decision making process. There are various strategies to
maximize profit. One strategy may be to have the lowest prices
and to attempt to sell a high volume of goods. Another
approach may be to provide a high quality product and provide
quality service, but have higher prices. Other options are to
concentrate on only a limited segment of the market and
develop a customer base just in that market segment or to
service a limit geographical area and provide customer
convenience.
However, there are some strategies that may appear good, but
are not. First of all trying to maximize profits in the short term
may lead to decisions that jeopardize future profits and may
threaten the very existence of the company. For example, failing
to invest in research and development may reduce expenses and
increase profits in the present, but may destroy the company in
the long term. In addition, achieving customer satisfaction in
many cases leads to a loyal customer base and may result in
increased revenues in the future. This may be an incentive to
12. keep prices relatively low and product and service quality high.
Again, this will not maximize profits in the short term, but
could result in substantially more profit in the longer term.
Determining the appropriate price and assuring and even
measuring the quality of service are not easy tasks.
Of course, what a company does is greatly influenced by the
actions of their competitors. Intense data gathering and data
analysis is usually necessary in making all of these types of
decisions. This means that not only must the information
system have detailed data about the operations of our company,
but must also retrieve and store data on events occurring outside
of the company. More than likely, your responsibility in a
company will be to gather and analyze the data and suggest the
best options, but you probably, at least early in your career, will
not make these strategic decisions.
Business Organization 1.3
There are many different ways businesses can be organized.
From a legal point of view businesses can be sole
proprietorships, partnerships and corporations. A sole
proprietorship is where essentially one person owns and runs
the company. Generally these are very small companies. A
partnership is where a fixed group of owners are involved in the
business and share the control and the profit and losses of the
business. Generally, these are smaller to medium size
companies. Corporations, on the other hand, are companies that
issue stock and the owners are the holders of the stock.
Corporations can actually be of various legal forms, but we will
be primarily concentrating on large corporations (also referred
to as C Corporations) whose stock is traded in the stock market.
The reason for this orientation in this text is that we don’t want
to spend too much time discussing various forms of
organization, which will be done in other courses and larger
organizations usually have more well defined business
processes.
We will first look at the organizational structure of a business
from the top down. Remember that what details are presented
13. are just broad generalizations and that almost all companies will
have unique organizational structures.
Your typical C Corporation will be controlled by a Board of
Directors. These are people elected by the stockholders and
they oversee the activities of the company. The board will
appoint the executives of the company and will set the high-
level policies. They do not participate in the day-to-day control
of the company. The execute officers control the company on a
day-to-day basis. The Chief Executive Officer (CEO) is the
highest-ranking executive. Underneath the CEO are other C-
level executives. This may include the Chief Operations Officer
(COO), the Chief Financial Officer (CFO) and the Chief
Information Officer (CIO) to name a few. These people would
report directly to the CEO and they would run their respective
parts of the organization. Looking at the organization chart in
Figure 1.1 below you can see that the CEO reports to the Board
of Directors and the other C-level officers report to the CEO.
Figure 1.1 Corporation Organization Chart
The CIO is the technology leader in the above organization
structure. This person is responsible for the operation of the
information systems (IS) area. Since the information system is
so important to all of the other parts of the company, the CIO
must also coordinate the activities of the IS area with all of the
other areas in the company.
Companies can be organizationally structured in many different
ways. As you look further down the organization structure, the
most traditional way is by functional units. That means that
each lower level unit is based on what work they do. However,
some companies will be structured by geographical locations,
for example North American operations, European operations,
and Pacific Rim operations. Other companies may organize by
line of business or product lines. Larger corporations can be
combinations of all of these organizational structures. These
14. structures can have a significant influence on how the company
conducts business and how successful a company will be.
While the high-level organizational structure of a company has
strategic significance, in the early years of your professional
career it will have little impact on your career.
Figures 1.2 and 1.3 show the high-level organizational
structures of the CSU System and CSU Chico respectively.
Even though these are not-for-profit organizations, they have
similar organizational structures to that of for-profit companies.
One thing to note in Figure 1.2 is that some positions (such as
University Auditor) have a solid line, meaning direct reporting
responsibilities and also a dashed line, meaning an indirect
reporting responsibility.
Figure 1.2 California State University Organization Chart
Figure 1.3 Section of CSU, Chico Organization Chart
Business Processes 1.4
The preceding was just a very high level view of how
companies can be organized. We now take a closer look at how
companies operate by briefly discussing business processes.
There are two distinctly different activities in any company.
There are primary activities that are directly related to making a
profit for a company and there are support activities that enable
the primary activities to operate efficiently and effectively.
Many people think of the primary activities as being a chain of
events whose end result is generating a profit for the company.
As the old saying goes “a chain is only as strong as its weakest
link” is a useful way of also thinking about the chain of events
in a business. Each primary activity must be executed well in
order for the company to be successful. The possible primary
activities include:
15. Inbound logistics – This is where goods are ordered, received
and stored for either further processing or for sale to customers.
Operations – This is the processing of raw materials and turning
them into finished goods ready for sale to customers.
Marketing – This is the direct interface with the customer and
this is the activity that generates the company’s revenue.
Outbound logistics – This is how goods get delivered to the
customer.
You should note that not all companies have each of these
activities and many companies have primary activities that
don’t quite fit into these categories. An example of a company
that has all of these activities is any company that manufactures
goods, such an automotive manufacturer like Ford Motor
Company, a computer manufacturer like Hewlett Packard, and a
food producer like Foster Farms. Some companies, such as
retailers, don’t manufacture anything, so they don’t have
operations activities. Some companies are service-oriented
companies, such as a consulting firm, who don’t use inbound or
outbound logistical activities or manufacturing operations. So
you can just think of this as a framework that you can use to
think about how a business operates.
Pepsi Co.
Inbound logistics: PepsiCo. obtains beverage ingredients and
packaging materials from outside suppliers.
Operations: PepsiCo. combines proper amounts of ingredients
together to form different soft drinks. Once the final product is
created, it will be packaged in cans or bottles.
Marketing: Creating promotions and advertising campaigns
designed to bring customers to stores which sell Pepsi products.
Outbound logistics: PepsiCo. ships finished products to stores
all over the world, where the consumer will make the purchase.
Foster Farms
Inbound logistics: Foster Farms receives top quality breeding
chickens from farms.
Operations: These chickens lay eggs, which will then be brought
to incubators. Once hatched, they will be sent to chicken coops.
16. Grown chickens are then sent to processing plants to be
butchered and packed for the consumer.
Marketing: The marketing team at Foster Farms builds the brand
name through packaging and advertisement.
Outbound logistics: Foster Farms owns their fleet of
refrigerated trucks, which deliver fresh chicken to
supermarkets.
Target
Inbound logistics: Target receives all retail goods from outside
manufacturers.
Operations: Target is a retailer which does not create goods
from raw materials.
Marketing: Target’s marketing team creates advisements
through many different media forms (television commercials,
newspaper ads, etc). They also collaborated with celebrities to
brand some products.
Outbound logistics: Target sends goods to their Target store
locations from their distribution centers.
The support activities would include the service areas of the
company. They would be:
Corporate management – This includes the corporate leadership
and their support staff which includes corporate planning, legal,
and financial management.
Human capital management – This includes all of the
employment and personnel activities within the firm.
Accounting – This includes all of the financial record keeping
activities within a company.
Information systems – This includes the processing and storage
of all of the data within the company.
You may want to picture these activities as shown in Figure 1.4
below. As is shown, the primary activities are a chain of events
with one feeding the next and the support activities are
underneath them lending assistance to the primary activities.
17. Figure 1.4 Primary activities with supporting activities
So we have taken a very high level look at the primary activities
of a company. Within these activities we can separate the
activities into business processes. A business process is a set of
related activities that has a definite beginning and a definite
end. For example the sales to cash business process is all of the
business activities that are involved in selling goods to a
customer and subsequently collecting payment from that
customer. The main point of breaking a business’s activities
into individual business processes is to simplify their analysis.
For most businesses there are a vast number of activities that
can be occurring at one time. Trying to understand and analyze
all of these activities as a whole would be extremely difficult.
So instead we can break all of these activities into smaller
groups of activities that are all related. That is the objective of
defining business processes.
In this text we will only look at three major business processes:
sales to cash, purchase to pay and raw materials to finished
goods. The next three chapters will cover each of these
business processes in more detail. As you will see, each of
these business processes can have many different variants.
One of the common ways to analyze business processes is to
produce diagrams that explain the process. Besides discussing
the business process we will use flowcharts to describe each
business process. The flowcharts we use in this course will be
quite simple. However, in future courses in the curriculum you
will be using much more detailed and sophisticated methods.
For example, in the database class (MINS 235) you will develop
entity-relationship diagrams and in the analysis and design class
(MINS 350) you will be using the Unified Modeling Language
(UML).
Using a very simplified process model, the sales to cash
business process is presented in Figure 1.5below.
18. First we must explain the diagram methodology. The symbol
represents an external entity. In this case the customer. The
symbol represents a document. The symbol represents a
business processing activity. The symbol represents a physical
item. The connecting lines represent activity flows where the
arrowhead denotes the direction of the flow.
Now let’s explain the flowchart. The customer triggers the
beginning of the process by initiating an order for goods. This
is usually termed the triggering event. The order is received by
the company, the goods are picked from the available inventory
and shipped to the customer. Upon shipping, the customer is
sent a bill for payment. When the customer pays the bill, the
company receives the cash. As we stated a couple of times, this
is an overly simplified model. For example, we ignore the fact
that we may not have the goods presently in inventory. How
would we handle that situation? In addition, what if the
customer doesn’t pay us? Also how do we record all of this
activity? We discuss these considerations in the next chapter,
which deals with the sales to cash business process in more
detail.
In this text we consider three very important business processes,
but in most businesses there are many times hundreds of
different business processes. The information systems
professional must understand many of these processes, since
ultimately they will be involved in the automation of these
processes. While it is almost impossible for one person to
understand all of the processes in a company, there will be
teams of information system specialists who will deal with
groups of these processes. For example, there may be a team of
I.S. professionals that deal with accounting issues, there will be
19. a team to deal with human capital management issues, another
team to deal with logistics, there may be a team to deal with
marketing and sales, etc. The important thing in the BIS
curriculum is not to understand in depth all of the processes of a
business, but how to go about analyzing and understanding a
business process.
Exhibit 1.6 below lists a few of the possible business processes
involved in most businesses that are not part of the primary
business activities that we will discuss in more detail in later
chapters.
In the human capital management area: Hiring an employee.
Firing an employee. Promoting an employee. Determining
employee compensation.
In the accounting area: Determining the cost to manufacture a
product. Paying employees. Producing the financial
statements. Closing the books for a period.
In the finance area: Borrowing money to finance the company’s
operations. Declaring dividends on stock. Issuing new shares
of stock.
In the marketing area: Conducting industry research. Designing
products. Communicating with customers. Updating social
networking sites.
In the sales area: Finding leads. Contacting potential clients.
Communicating products/services to prospects. Follow up with
current customers.
In the information systems area: Researching user needs.
Translating needs to technical requirements. Implementing and
monitoring technical solutions. Supporting business needs.
Figure 1.6 Possible Business Processes
Technical Section – Visio 1.5
In each chapter we will end the chapter by examining a
technical topic. In this chapter we discuss the Microsoft Visio
documentation and charting tool. This is a tool that is free to
students at CSU Chico and is a powerful and easy way of
20. generating different types of diagrams that can be used to
analyze business situations. In fact Figure 1.5in this chapter
was produced in just a few minutes using this tool.
Visio is part of the Microsoft Office suite. When Visio is first
opened, it allows the user to select the template they would like
to use. This is just a way of helping to organize the symbols
that are available. Each template will use a specific set of
symbols and shapes. However, the user is not restricted to use
just these items. There is a vast array of symbols and shapes
that can be employed with respect to any type of diagram.
Figure 1.7 shows how the beginning screen appears.
Figure 1.7 Visio Template Selections
If you select the Basic Flowchart, it appears as follows in
Figure 1.8below.
Figure 1.8 New Basic Flowchart
The middle section is like a blank sheet of paper. The symbols
that can be selected are on the left and can be simply dragged
onto the sheet of paper. The three items at the top of the screen
circled in red are important functions. The top most circle is
the pointer tool icon. This is the normal state that the system is
in when it first starts. In this state you can drag and drop
symbols, move them around, and resize them. The middle
circled icon is the connector tool. This is used to draw the flow
lines from one object on the drawing to another object. The
bottom most circled icon is the text tool that allows you to place
text anywhere on the sheet. All of these functions will be
demonstrated in class.
In addition, there is a video available that introduces the Visio
product. That video discusses how to use the tools, but also
talks about developing a little more complex flowchart called a
document flowchart. This type of flowchart will be used later
in the course. For now we will be developing simple business
process flowcharts like the one in Figure 1.5.
The video can be viewed at:
21. http://www.youtube.com/watch?v=PbBOSK1l17A&feature=yout
u.be
Information: The Currency of Modern BusinessChapter 2 –
Sales to Cash Business Process
2.1 Introduction
This chapter starts a more detailed analysis of the primary
business processes. We took a brief peek at the sales to cash
business process in the previous chapter. Now we will go into
more depth. First, the name of the business process may be
different in other textbooks. Some people refer to it as the
revenue business process since it is the main source of revenue
for most companies. Whatever you want to call it, the process
includes the same elements.
Before we begin to analyze the process we must explain how we
will approach each of the business processes. The perspective
that we take will be from a business to business (referred to as
B to B or B2B) point of view as opposed to a business to
consumer (B to C or B2C) point of view. The reason for this
approach is that the B to B situation is usually more formal and
provides greater documentation and audit trail. While you will
no doubt be much more familiar with the B to C environment
which you encounter on a daily basis, that will not be the
environment you will find in your professional career.
For most major business processes it is easiest to break them
into sub-processes and then analyze each of the sub-processes.
Figure 2.1 shows the sub-processes for the sales to cash
process.
Figure 2.1 Sales to Cash Sub-Processes
We will look at each of these sub-processes separately and in
more detail.
22. 2.2 Pre-Sales
The pre-sales sub-process is the point in which a company
captures the interest of potential customers and attempts to
retain their existing customers. This is usually part of the
marketing operation of the company. This is a complex and
very competitive area for most companies and the way it is done
is changing rapidly for many companies. The process is so
complex that an entire independent computer system is usually
devoted to just these activities. These are Customer
Relationship Management (CRM) systems. They trace all of the
activity for each customer of a company and all sales contacts
with these customers. For example, all contact information and
professional information will be stored so that a close
relationship can be established between the sales representative
and the customer. Determined by the situation this could
include some personal data such as the names of the family
members of the customer and important dates in their lives.
Social media is now starting to play an important role in the
CRM space. You should cover this activity in more detail in
your marketing class. So we will not go into this in any more
detail.
Before we discuss the next sub-process it is a good time to
discuss the two major categories of data for which you will be
dealing. They are master data and transactional data. Master
data is the data we will store that describes the attributes of a
person, place or thing. For example, there will be master data
records with respect to customers, employees, warehouses,
departments, products, etc. Transaction data is the data that is
recorded whenever a transaction occurs. That data contains the
time and date of the transaction and the units or dollar amounts
involved in the transaction. The main differences between the
two types of data are that the master data is rather stable data
that does not change very frequently while transaction data is
very volatile (i.e. it changes quite a bit and very quickly).
Master data when compared to transaction data is quite small in
volume.
23. So master data describes the objects involved in transactions,
but the transaction data describes the actual transaction. So for
every sale to every customer for each product sold by each
employee would be recorded as a transaction, but the data on
the customer, the product and the employee would only be
recorded once. This is an important distinction which you will
explore in more detail when you take the database course.
Referring back to the pre-sales discussion, much of the
information in a CRM system is focused on master data.
2.3 Sales
The sales sub-process is the point at which the customer gives
an order to the company. The order will normally come in the
form of a purchase order. This is a formal document that
specifies who the customer is, what they want to order, when
they want the goods and where the goods should be delivered.
While the information on the form will be the same, each
customer will have their own purchase order form. For that
reason our company would want to put all of this information
onto a standard form so that as the transaction is processed, it is
easy for everyone in the company to know where on the form
the pertinent information is placed. This internal form is called
a sales order. So the customer’s purchase order is transcribed
to the sales order. Figure 2.2 shows an example of a purchase
order. Note that a typical purchase order has information about
the company making the order, the vendor accepting the order,
the location to which the goods are to be sent and a listing of
the requested goods.
Figure 2.2 Sample Purchase Order
However, before we usually accept and process the order it is
necessary to verify that the order can be filled. This is done by
checking inventory levels of the desired goods. In addition, if
this is a credit sale, that is the customer will pay us a little time
after receiving the goods, then we must check the customer’s
24. credit rating. Figure 2.3 presents a logic flowchart outlining a
possible process for checking available inventory. Note that
there are many other ways that this situation could be handled.
However, examining this diagram should start to show you that
while on the surface the process of just selling a customer some
goods sounds rather simple, it can be much more complex.
The two major decisions that have to made in this situation is
whether the customer will accept a partial order when all of the
goods are not in stock and whether the customer is willing to
wait for out of stock goods to be delivered later (i.e. accept
backorders). Looking at the logic flowchart for checking
inventory may bring to mind some questions. For example, why
would a customer not want to accept a partial shipment? Why
would a customer not want to accept backorders? We will
discuss these and other questions in class.
Figure 2.3 Checking Inventory Availability
Figure 2.4 shows a possible process for handling an established
customer’s request for credit. However, if this was a new
customer for which we have no credit history that would be a
much more complex business process that we will not address in
this text. Even this situation could be more complex if the
customer that doesn’t have sufficient credit requests a credit
extension which again would necessitate the use of a different
process to determine whether or not to grant that extension.
The flowchart does not specify a procedure for actually
checking the credit. In actual practice that would have to be
documented. In most situations, that procedure is quite straight
forward. It would involve a person looking at the customer’s
record to see the customer’s available credit and see if that
amount would cover the amount of the purchase. For a good
integrated computer system, this would be programmed into the
25. system and would happen automatically.
Once the sales order is created, in a well designed system, the
goods in the sales order will be reserved to fill that customer’s
order. If this isn’t done, then it would be possible to promise
the same goods to another customer before the goods are pulled
from inventory to satisfy the first customer’s order. This could
result in a very dissatisfied customer when notified that the
goods aren’t actually available.
Figure 2.4 Checking Customer Credit
At this point we will discuss how automation affects the
processes. If this was an entirely manual system, then all of the
documents involved in the process would be paper documents.
Determined by the amount of automation involved, some or all
of the documents would be electronic. If the customer and the
vendor computer systems are linked electronically, all of this
activity can be done by the computer systems with little or no
human intervention. In a manual system the procedures to be
followed are supposed to be documented and the employees
should be thoroughly trained in how the process should be done.
In reality this is a real weakness in manual systems. Different
employees can adopt different procedures and a given employee
may not even use a uniform procedure all of the time.
Computerized systems are much more precise. The procedures
are programmed into the system and the system will perform
exactly the same procedure each time. The major problem with
computerized systems is that all variations that may occur have
to be programmed into the system. As you may be getting the
sense already that the number of different ways business can be
done can be quite prolific. That is one of the reasons why there
is such a high demand for people with the skills you will have
when you graduate because you will have the skills needed to
design and implement complex systems.
From now on we will be looking at what is considered only the
26. “mainstream” situations and not the exceptions. For example,
in the sales sub-process we will assume that the inventory is
available and that the customer has sufficient credit.
2.4 Picking and Shipping
The next step in the process is to pick the items from inventory
and prepare them for shipping. A picking list is first generated
and sent to the warehouse for fulfilling the sales order. The
picking list will usually list the items to be picked and the
number of items to be picked without the prices of the goods.
The price is usually not included since this is something the
warehouse people don’t need to know to do their job. An
example of a picking list is shown in Figure 2.5.
Account No.
Purchase Order No.
Picking List No.
55555555555
1
28. Chicago, IL 54321
555-280-5555
Item #
Description
Unit
Location
P.O. Qty
On Hand Qty
Qty Picked
Picker
12343245
Color Copies
EA.
Shelf E12
1000.00
5000.00
1000.00
Sue Smith
30. Figure 2.5 Sample Picking List
There is the possibility that even though the records say that the
goods are in inventory, they may in fact not be there. This can
happen in many ways. For example the inventory records may
not have been properly updated, the goods may be stored in the
wrong location or there may have been pilferage of the goods
(i.e. theft). Of course, if this is the case then the order cannot
be properly filled. This obviously would be a problem that has
to be resolved. Since in a well designed system, this is a very
infrequent occurrence, we will not consider what actions should
be taken.
Once the goods have been picked, they must be packaged for
delivery. Immediately upon picking, a packing slip should be
generated and placed inside of the package. Also at the same
time the inventory will be decremented by the goods to be
shipped. Since the goods were previously reserved for the
customer, we are just removing the reserved goods from the
inventory.
The packing slip is a document for use by the customer. The
customer will use the packing slip upon opening the package to
confirm that the goods shipped were indeed the goods they
ordered. Figure 2.6 shows an example packing slip.
Figure 2.6 Sample Packing Slip
The goods are now ready for shipping. There are different
documents that could possibly be used when the goods are
shipped, determined by the shipping method. There are various
legal considerations with respect to shipping (such as who has
legal title to the goods) which we will not address and these
issues will determine the necessary shipping documents. We
31. will state that a bill of lading is the document that will
accompany the goods. This is like a more robust form of a
packing slip that is not sealed in the package with the goods.
Instead, it can be presented as evidence to anyone requesting
formal documentation on what is being shipped.
2.5 Billing
Billing is the first step in the process of collecting payment
from the customer. For most businesses the billing process
happens after the goods ship. However, there are some markets
where it is not normal to extend credit and billing is done
before shipping. We will not consider those situations and will
deal only with the post shipping billing process. There are two
primary ways in which billing can be done. The first is called
invoice billing. This is where the invoice sent to the customer
appears very similar to the sales order used to process the sale.
That is, the amount the customer is billed is for the amount of
the goods for that specific shipment. Of course tax and
shipping costs would also be included on the invoice.
The second method of billing is termed balance-forward billing.
It is also termed cycle billing since usually every month on a
certain date a given customer will be billed for all transactions
during that month. This is the way credit card transactions are
billed. Since different customers are billed on different days,
the work of the billing staff can be divided over the entire
month.
Invoice billing is usually done when the purchases are large and
infrequent. Balance-forward billing is done when there are
many transactions and the dollar amounts of the transactions are
not that significant.
2.6 Cash Collection
The final step of the sales to cash business process is to receive
the payment from the customer. This step is primarily involved
with recording the payment transaction. However, it should be
noted that the payment may actually come in various forms. It
may be in cash, by check, by bank transfer or via a credit card
transaction. Each payment method will entail slightly different
32. processing. But the central part of the transaction is to record
the payment in the customer’s account. As you will learn in
your beginning financial accounting class, the customer account
is termed an account receivable. The payment by the customer
reduces that account receivable on the company books.
Since in this step we are dealing with cash, a very liquid asset,
care must be exercised to make sure that it is protected from
being mishandled and stolen. The usual method of protection is
to be sure that two people are involved in the transaction where
one person handles the cash and the other person deals with
recording the transaction. In that way the cash balance can
always be reconciled against the recorded amount.
2.7 Organizational Considerations
So far we have discussed what has to be done, but we haven’t
yet addressed who should be doing each of the tasks. With a
business this means that we have to determine what department
does each of the tasks. First let’s discuss the situation in a
manual environment.
In a manual sales environment everything is done using paper
documents. While most companies no longer operate this way,
it is still useful to see how the information flows through the
company and the documents that are used. Even though a
computerized system eliminates most of the paper documents,
the same document information is stored in electronic form and
appears on screen in much the same format as the paper
documents. Computerized systems also reduce the number of
people involved in the transaction and empower those involved
with more information that is real time.
On the following page, Figure 2.7 shows a document flowchart
of a typical sales to cash process. This is a simplified version
that ignores the finer points such as partial shipments,
backorders, insufficient credit, etc. As you may imagine, the
analysis of a real business process would contain much more
detail.
Information: The Currency of Modern Business Page 25
33. As you can see from the flowchart, in a manual system there are
many people and lots of paper involved in the transaction. As
the system gets more computerized, the primary tasks done by
people boils down to convincing the customer to buy our
products and the physical handling of the goods. Even then,
some material handling systems are now robotized and even
much of the picking, packing and shipping activity has limited
employee involvement. In addition, with Internet shopping as a
customer contact point, the sales staff may also not be necessary
for many transactions.
2.8 Technical Section – SAP ERP System
SAP is the dominant Enterprise Resource Planning (ERP)
vendor in the world. A very large majority of the Fortune 500
companies rely on the SAP ERP system to run their businesses.
As you will see, it is a massive software system that
encompasses almost all of the business processes that most
businesses have. While the system is very complex and
expansive, don’t be intimidated. We will slowly walk you
through the system and guide you through each of the assigned
tasks. The first SAP assignment deals with the sales to cash
cycle. However, the amount of work you will have to do will be
very limited. As you progress through the BIS program you
will deal with the SAP system in much more depth. The
objective is not for you to strictly learn the SAP system, but we
will be using this system to illustrate the practical application
of the theory we discuss in class. Also, the knowledge that you
gain by using the SAP system is transferable to other vendor’s
ERP products. You will find that the job market for graduates
with this type of background is extremely good, even in the
present depressed economy.
The main objective of this section is to introduce you to the
SAP system and to show you the important features you will
need to know in order to navigate around within the system.
34. The assignments will provide the detailed instructions on what
to do in order to execute specific transactions. So that will not
be shown here. Let’s get started with the system.
The first thing you need to do is to get logged into the system.
Each student has their own system logon. This is made
available in the grades section of the Blackboard system.
You start logging onto the SAP by first access the SAP GUI
application which is titled SAP Logon as shown in Figure 2.8
below.
Figure 2.8 Accessing SAP GUI
You will then see the screen shown below in Figure 2.9.
Figure 2.9 SAP Logon Screen
You then need to select the system you will be using to do your
work. For this class we have been assigned the Warsaw system.
In SAP terminology this is called the Riga instance. Just double
click on this instance and you will be routed to the screen
shown in Figure 2.10.
Figure 2.10 Riga Logon Screen
You need to enter the correct logon information into this screen.
First you must enter the assigned client, which for our class is
client 515. In addition, you need to enter your user ID which is
AIS-0XX where the XX is your assigned number. You can
determine what your number is by going to the grades section of
the Blackboard system and looking for your SAP Number. It is
a two digit number, where you must use both digits when
logging on. For example, if your number is 01, you must enter
01 and not just 1. The initial password the first time you log in
will be SAP4US. The password is case sensitive, so you must
use capital letters. This password will only be used the first
35. time you log into the system. When you hit the enter key, you
will be required to select a new password and then confirm that
new password. BE SURE TO REMEMBER THIS PASSWORD.
This is the password you will use for the remainder of the
semester. If you forget this password, then you will have to
contact me to reset the password.
After you have changed your password, you will see the screen
shown in Figure 2.11. This is what is termed the standard SAP
menu. This is the menu from which we will be doing our
assignments.
Figure 2.11 Standard SAP Menu
Looking at the above menu you will see that if you wish to
expand out a menu path that you can simply click on the right
facing arrow next to that item. In doing this you will see that
there are a huge number of possible transactions that you can
execute. However, this will not be a problem for you since we
will tell you exactly what transaction needs to be executed to
complete your assignments. In subsequent classes as you
become more familiar with the SAP system, you will be
navigating through the system on your own.
There are two important areas that we have circled in red. The
first is at the top of the page. This is a short cut way to execute
a transaction. You can simply enter the transaction code in this
box and hit the green arrow to the left of it or hit the enter key
on the keyboard and that transaction will start. This can save
you a good amount of time since the menu paths can expand out
to many levels of detail before you can actually execute the
transaction. In the assignments we will supply you with both
the menu path and the transaction code.
The second circled area is at the bottom of the page. This is
where the system will write messages about what is occurring as
you work. Some of these messages will be informational,
informing you that a given action was successful. Other
messages may be warnings or errors. You should make sure
that you check for messages in this area to be sure things are
36. working as you would expect.
Now we will execute a transaction in order to show you other
important features of the system that you need to know. Look
at Figure 2.12 below.
Figure 2.12 Sample Transaction
The items within the red outline are important navigation
options. The arrows on the tool bar control navigation within
the system. The left most green arrow will send the user back
to the previous screen. The middle yellow arrow allows the
user to leave the transaction and the red “X” kills the
transaction. The diskette icon is the way in which you save the
data you entered into the transaction. We have already
discussed the role of the transaction entry box and the left most
green check mark which means that you wish to execute the
next step in the transaction.
This should give you enough information to begin working on
your assignment. There are a series of videos that you can view
that discuss this material and offer some additional information.
We will spend a good amount of class time going through these
functions and showing you how to start working on your SAP
assignments.
You can watch the first video at:
http://www.youtube.com/watch?v=Q7qB3VdnlF0
Information: The Currency of Modern BusinessChapter 3 –
Purchase to Pay Business Process
3.1 Introduction
In this chapter we will look at the procedures a company uses to
purchase goods. This is termed the purchase to pay process.
Many of the terms will be familiar since they were used in the
previous chapter dealing with the sales to cash process. The
difference is that we are now assuming the role of the company
37. that was the customer in the previous chapter.
A purchase is always motivated by a need for a product or a
service. The need can come in many forms determined by the
type of company and how it does business. If we are dealing
with a manufacturing company, then one very important need is
for raw materials which are used to manufacture the finished
products. However, all companies need to acquire some type of
good or service that will be used in the normal course of
business. For example, they will need office supplies, computer
equipment, office furniture, etc.
Again we will break the process into a series of sub-processes
as shown in Figure 3.1.
Figure 3.1 Purchase to Pay Sub-Processes
3.2 Order Goods
As mentioned above, there are two major avenues of
determining that goods need to be ordered. The first involves
the eventual resale of the goods. In a production oriented
company this can be the ordering of raw materials. In a retail
situation this is the ordering of finished product from a vendor
for resale. In both cases the origination of the order comes
from the inventory control area. The process is primarily based
on a set of reorder rules that dictate at what inventory level
more goods need to be ordered. As with most things we
discuss, this isn’t as straightforward as it may first appear. The
inventory level, called the reorder point, and the reorder
quantity are based on factors such as the amount of time it takes
for the goods to be delivered, the expected demand for the good
between ordering and delivery and the penalties involved if
demand is not met due to an out of stock situation.
The penalty for an out of stock situation may be lost sales in the
case of retail sales. The penalty for out of stock in the raw
materials case may be a shutdown of the entire assembly line.
That is, in some cases the penalty is so high that risking an out
38. of stock condition may be unacceptable.
The inventory control employee responsible for ordering that
good will monitor the stock level to minimize potential
penalties for out of stock goods. When the inventory reaches the
reorder level, then the goods are ordered. As we said, the
amount of the goods to be ordered can be based on various
factors. Whatever that amount is, a purchase requisition is
written and sent to the purchasing department. This is a
document only used within the company and should be the same
for all departments in the company.
The second situation of ordering goods is for internal use by the
company. That is, the goods will not be used as raw materials
in manufacturing a finished good or for resale to customers.
There are many different types of goods that fit into this
category. They could be office supplies used by the white
collar employees such as desktop computers, printers, pens,
paper, etc. Or they may be machines used to manufacture or
package or deliver goods to customers. This would include
heavy machinery, vehicles, tools, etc.
The second situation is different in that a given department
would initiate the order, not the inventory control area. The
usual scenario is that an employee sees a need for some good to
be ordered, let’s say a new desktop computer. That employee
fills out a purchase requisition requesting the good. If the
department head approves the purchase, then the approved
purchase requisition is sent on to the purchasing department. If
the department head does not approve the purchase requisition,
then the process stops there and the employee doesn’t get their
new computer.
Determined by the situation, the purchasing department could
pool the purchase requisitions or simply order the goods
immediately. The reason for pooling the purchase requisitions
would be to get more favorable terms from the vendor. For
example, if in the case of the desktop computer each computer
was order separately, the company would not have as good
negotiating power as when they order a batch of computers all
39. at once. For a large company that may mean hundreds and
maybe even thousands of computers may be ordered at one time.
The primary function of the purchasing agent is to find the best
vendor to buy from and then write a purchase order to buy the
goods. There are many factors involved in determining the best
vendor. Price is not the only issue. The delivery schedule, the
quality of the product, the financing terms and other issues can
also influence the decision. These issues will be discussed in
your supply chain management class when you take it. The
final step in the process is to issue the purchase order to the
selected vendor. The purchase order will contain some of the
same information as the purchase requisition, but will contain
additional information about both the purchasing company and
the vendor company. Samples of a purchase requisition and a
purchase order are shown in Figures 3.2 and 3.3.
No. 93043
Purchase Requisition
40. Date Prepared:
1/04/2013
Prepared by:
David Peterson
Suggested Vendor:
Jane Dough
Sample Vendor
Deliver To:
Break Room
Date Needed:
2/25/2013
Item No.
Quantity
Description
Unit Price
Total
1029
25
Table
$200.00
$5,000.00
2434
100
Chair
$40.00
43. To
Ship To
Jane Dough
John Doe
Sample Vendor
Sample Client
5555 Vendor Drive
4564 West First St
Vendor City, CA 90909
Chicago, IL 54321
555-555-5555
555-280-5555
48. 3.3 Receive Goods
The next event will be the goods arriving at the purchasing
company. Generally this will happen in the receiving
department. Their job is to inspect the goods and make sure
that the goods that arrived are the goods that were ordered. One
way to do this is to open the package, remove the packing slip
and count the goods. The usual method of recording this action
is by creating a receiving report. This is a document that lists
each good and the number of items received. While the packing
slip could be used to verify the receipt, there are a couple of
problems using it instead of creating a receiving report. One
problem is that each vendor will have their own form of packing
slip. Having a uniform receiving report eliminates any
confusion since no matter the vendor; all of the information will
be in the same place on the report.
Another problem with using just the vendor’s packing slip is
that there is a tendency by many employees not to actually
count the goods, but to do a cursory inspection and accept the
packing slip as being correct. If there was an error when the
vendor pulled the goods for shipping, then chances are it will
not be caught and the error will be entered into the records.
Figure 3.4 is an example of a receiving report.
Receiving Report
57. Figure 3.4 Receiving Report
Before the goods are placed into inventory it may be necessary
for them to be inspected and tested. This is more likely when
dealing with raw materials that must meet specific quality
control standards. The final step in receiving is to put the
goods into inventory and to update the inventory records.
Many of the steps in the receiving process can now be
automated if radio frequency identification (RFID) technology
is used. This is where RFID tags are placed on the goods and
the shipment can be scanned without even opening the original
box and when goods are placed in inventory, the inventory
records are automatically updated.
3.4 Receive Invoice
The usual procedure is that once the goods ship the vendor will
then send the invoice. No matter if the vendor does open order
billing or cycle billing, the invoice is needed by the customer in
order to confirm that the goods that were shipped were actually
ordered. The vendor will usually be directed to send the
invoice to the accounting department. Upon receipt of the
invoice, an accounting employee (usually someone from
accounts payable) will compare the purchase order with the
receiving report and the invoice to make sure that they are being
billed for something the company ordered and received. This
important procedure is called the three way match. The end
result of this matching process is a voucher package. This is a
document verifying the debt owed to the vendor. Payment
should only be made when a voucher package confirms the debt.
58. Figure 3.5 Voucher Package
A common fraud is for a person to send a bill for goods that
were never ordered or received. If the bill is for a low dollar
amount, a company with a poor accounts payable procedure will
pay the bill without verifying the debt. This type of problem
can also occur if a vendor company sends goods that were never
ordered. This is another common occurrence especially when a
sales person has to meet a monthly quota and randomly has
goods shipped to customers with poor accounting practices.
Many times these companies pay for the goods even though they
didn’t order them.
Once the authenticity of the invoice is verified, then the
documentation will be sent to the cashier for payment. That
means that the voucher package is sent to the treasurer’s
department.
3.5 Pay Invoice
The matched documents verify that the bill is valid and must be
paid. However, the timing of the payment can be an important
business decision. In order to maintain a good credit rating the
company must pay their bills by the due date. That is obvious.
But many companies offer their customers discounts if they pay
their bills early. This helps the cash flow of the company
receiving the early payments and it usually is a financial
advantage for the company paying early. One of the standard
payment terms is called 2/10 net/30. This means if you pay the
bill before ten days after invoice date, then you will receive a
two percent discount from the total amount of the bill. If you
pay within 30 days, the entire amount is due at payment.
Anything after 30 days would be considered late and could
possibly have penalties associated with late payment.
The available cash is normally the determinant of whether or
not a company can take advantage of an early payment discount.
If the cash is available, then it is a wise choice to pay early.
59. The lack of taking advantage of early payment discounts is
many times the sign of either financial difficulty of a company
or it shows that the company’s accounting and payment system
is poorly designed and organized.
When the payment is made, there can be many methods of
payment. The standard method is by a check drawn on the
company’s bank. The check will usually be signed by an
executive who will verify that the payment is valid by
inspecting the voucher package. If the amount of the payment
is substantial, most companies have a policy that two executives
must sign the check in order for it to be valid. This is a control
to prevent fraud.
Within a computerized environment, the payment will most
likely be done electronically. The computer software does the
comparison of the documents prior to making the payment to
make sure the payment is valid.
3.6 Organizational Considerations
As we discussed in the previous chapter, the employees that
handle the transactions and the departments involved will be
different determined by the degree of automation. The creation
of the purchase requisition and the subsequent purchase order
may be done by the computer. Since the inventory level can be
tracked by the computer, when the level dips below the reorder
point, the computer can automatically begin the purchasing
process.
In a similar way, an individual can request items by submitting
a purchase requisition online and the request is electronically
routed to the department head. The department head can then
approve the request and it will be automatically sent to
purchasing. This is all programmed into the computer using a
procedure termed workflow. This allows many types of
transactions to be done with little or no paperwork and with a
minimum of human intervention.
The manual procedures are summarized in Figure 3.6. Again,
60. we have discussed only the commonly occurring situations that
are involved in purchasing. Situations such as the wrong goods
are delivered or the count of goods delivered does not match the
packing slip or that the goods we ordered are not presently
available, etc. are not discussed in detail here. However, if you
are designing a computer system to handle purchasing, all of
these situations would have to be considered and designed into
the system.
Information: The Currency of Modern Business Page 45
Figure 3.6 Purchase to Pay Document Flowchart
3.7 Technical Section – Examination of possible BIS Jobs
Since one of your assignments is to talk to possible employers
at the career fair, it is an appropriate time to discuss some of
the jobs that may be available when you graduate.
Even during these recessionary times there is still a strong
demand for people in the I.T. area. The reason for this
continuing and to some extent increasing demand for people
with I.T. skills is that the technology revolution is in full swing
with all types of organizations updating their computer systems.
In many areas of business the competition is intense and
application of technology can make a substantial difference in a
company either being successful or falling behind the
competition.
While there are many different types of jobs involving I.T., we
will divide them into two major categories: technical positions
and business oriented positions. We will first discuss the
various technical positions. You will get a better idea of what
these involve as you go through the curriculum since there are
specific courses that deal with the activities done by the people
61. in these positions.
Technical Positions
The technical positions in I.T. are the jobs that keep the
computing infrastructure functioning. These are the behind the
scenes people that make sure that the end users are able to do
their jobs. These positions include network administrators – the
people who keep the organization’s network functioning. You
can take a networking course that will give you a much better
idea of the complexity of this type of job. There are database
administrators (DBAs) – an organization’s data is probably the
single most valuable asset a company has and the DBA manages
the data making sure it is secure and the system is delivering
the required performance. You will discuss some of this in the
database course that you take. System administrators are the
people responsible for the operating systems and application
systems of an organization. These are generally the people who
respond to problems users encounter. All of these positions
involve a deep knowledge of specific technical areas.
Employers find BIS majors attractive for these positions
because not only do they have the technical skills, they also
understand the business environment.
Business Oriented Positions
These are the primary positions for which BIS majors are
recruited. While some of these positions have a heavy technical
component, they also demand that the person has a good
knowledge of business and can interact with other business
people. There are so many different positions that it is truly
impossible to describe all of them. However, we can describe
in general what these positions involve.
A business analyst is a person who investigates the
requirements of a business problem and helps design the
computerized solution to solve that problem. Determined by the
scope of the position, it could also involve writing the code to
solve the problem or assist in configuring existing software.
The analysis and design course and the programming courses in
the BIS curriculum are focused on these skills.
62. These skills are also important in positions of application
specialists or I.T. liaison employees. These are individuals who
have a deeper background in a business specialty and deal
directly with the users in that area. For example, the BIS
supply chain management major would be a great candidate to
fill one of these positions and in fact these students are
aggressively recruited by our industry partners.
The last major area of opportunity for BIS majors is probably
the fastest growing of all areas in I.T. and maybe even in
business. It is the position of data analyst. In this job the
employee must have a deep understanding of business processes
and also a very good knowledge of how data is stored in the
computer systems and then be able to do statistical analysis that
can be used to make strategic business decisions. While there
are courses in the BIS curriculum where this topic is discussed,
there is an elective course that specializes in this area. This
area has a series of different names: business intelligence, big
data analysis, data mining and data warehousing are all in some
way involved. We will do a little work in this area toward the
end of this course.
Information: The Currency of Modern Business
Chapter 4 – Production Business Process
4.1 Introduction
The production process is one of the most complex processes
within a business. Unlike sales and purchasing processes that
almost all companies have, not all companies produce things.
Because the production process is more complex, computer
63. technology has been used extensively to streamline and improve
the process. In this chapter we will take a quick look at some of
the major steps in the production process. When you take your
supply chain management course, you will cover these topics in
much more detail.
The production process can be broken into two sub processes as
shown in Figure 4.1. And each of these can be broken down
into their own sub processes.
Figure 4.1 Production Sub Processes
4.2 Pre-production Process
The pre-production phase of the business process is dominated
by engineers. In this sub process the product is planned and
developed. The initial part of the process stems from research
and development activities. Research scientists and engineers
develop an idea into a product with assistance and advice from
production engineers. The production engineers determine the
best way of producing the product. In order to minimize cost
and increase production efficiency there may be changes
suggested by the production engineers to the original
engineering design. Accountants also get involved to determine
the cost of producing the product. When the design is finalized,
engineering drawings are produced and also two important
planning documents are produced- the bill of materials and the
routings.
The bill of materials (sometimes termed a material BOM) is a
structured list of all of the components needed to make a
product. The list looks like an inverted tree structure with the
finished product at the top and then all of the subassemblies
needed to build the finished product and the subassemblies
needed to build those subassemblies and so on until the tree
terminates with the needed raw materials. Figure 4.2 illustrates
a bill of materials.
64. Figure 4.2 Example Bill of Materials
The bill of materials is used in ordering the raw materials for
production and also as a guide to the assembly sequence of the
product.
The other important planning document is the routings (also
called the operations list). This is a detailed listing of all of the
work stations with specific machinery and operators that are
needed to produce and assemble the product and the amount of
time that is needed at that station. The routing for a
subassembly would state the first operation necessary to
produce that subassembly, the work center necessary to build it,
and the amount of time needed at that work center. The same
information would be provided for the second operation and all
remaining operations. This information would be provided for
each subassembly and the finished good. Figure 4.3 illustrates
a routing.
Table Routings
Workstation
Machine #
Operation
Setup Time
Machine Time
Labor
B
1
Cut table top
00.05
00:08
00:15
B
3
Cut leg
00:05
00:10
65. 00:30
D
2
Turn leg on lathe
00:10
00:05
00:25
A
5
Assembly
00:05
00:10
00:25
E
1
Painting
00:15
00:10
00:40
Total:
02:15
Figure 4.3 Example Routing
The material BOM and the routing can then be used to begin
planning the production schedule. One critical piece of
information is missing before we can do production scheduling.
We need to know how many units of finished goods we need to
manufacture. This is a function of inventory levels, the number
of finished goods presently in inventory, and the anticipated
demand for the good. This is termed the master production
schedule (MPS). There are various methods to determine the
demand and we will not go into them here, but with this
66. information about all of the different goods we manufacture we
can schedule the shop floor and also determine the number of
units of raw materials needed.
(
Boeing invested in CAD/CAM
(computer aided design/computer
aided manufacturing) in the mid-1980s.
They believed th
is
investment would cut down on the cost and time associated
with creating physical mock-ups of airplanes.
In 1990, the Boeing 777 twinjet was created using CAD and
other new engineering technologies.
These new technologies helped Boeing:
Improve accuracy in part design and assembly
Instantaneous communicate capability
Improve the quality of airplane design
Reduce of the time required to introduce new airplanes into the
marketplace
Figure 4.4 CAD
/CAM
Example
http://www.boeing.com/commercial/777family/compute/comput
e2.html
)As you may imagine, for companies that produce multiple
products the number of calculations are phenomenal. That’s
why computers have become an essential part of the entire
production process including almost all the pre-production
activities. This starts with the initial design of the product
which is now done on computer-aided design (CAD) software
and then these designs are transferred over to the computer-
aided manufacturing (CAM) software which feeds instructions
to computer numerically controller machines.
The planning of the ordering and use of raw materials and
67. scheduling of the work floor part of the pre-production process
is also very much a computer-aided situation. Manufacturing
resource planning (MRP II) systems are essential for this
activity. Only extremely small manufacturing operations can be
successful without these computerized tools.
4.3 Production
Before the actual production can begin, the raw materials have
to be ready to go into production. This is part of the MRP II
process that involves estimated sales, the present inventory
level and the lead time for delivery of raw materials. We
discussed this briefly in the previous chapter, but didn’t go into
very much detail since there are different approaches to
handling this problem. Again, you will cover this in much more
detail in you supply chain management course.
The trigger that starts actual production is the production work
order. This is a document that states what finished good is to
be produced, the number of units needed, and the time the units
are needed. Figure 4.5 show an example of a production work
order.
Production Work Order
No. 596067
Order No.
100349
Product No.
1029
Description:
Table
Production Quantity:
25
Approved by:
JD
Release Date:
01/24/2013
Issue Date:
01/25/2013
Completion Date:
68. 01/30/2013
Deliver to:
Shipping
Workstation No.
Machine No.
Quantity
Operation
Start Date & Time
Finish Date & Time
B
1
30
Cut table top
1/28
7:00
1/28
10:15
B
3
110
Cut legs
1/28
10:15
1/29
20:45
D
2
105
Turn legs on lathe
1/29
20:45
1/29
2:30
A
5
28
69. Assembly
1/29
2:30
1/29
11:00
E
1
26
Painting
1/29
11:00
1/30
21:45
E
5
20
Transfer to shipping
1/30
22:00
1/30
23:30
Figure 4.5 Production Work Order
The production work order is an important document since it
allows for the tracking of the work being done and also
accumulates the costs incurred at each point of the production
operation. One common example of this type of document is
the bill you get when you have your car repaired. When you
first bring the car in, the mechanic will record information on
you and your car such as your name, address, etc. and the
details about the car including make, model, mileage, etc. In
addition, the production work order for your car would include
the work that needs to be done. As the work is done, the labor
and materials are accumulated on the production work order.
That is the way the final bill is produced.
70. Figure 4.6 Production Floor
Source:
http://www.quality-assembly-logistics.com/about_us.php
The actual production starts with the raw materials being
requested to be delivered to the shop floor to a specific work
station. As we stated in the pre-production section above,
where the materials go is dictated by the routing and the amount
of the materials needed is directed by the BOM. The request for
raw materials is initiated by a material requisition. Figure 4.7
shows an example of a material requisition form. The form
shows what raw materials are needed, where the materials are
going and the responsible person. The material requisition is
not to be confused with the purchase requisition. The material
requisition is an internal document used to track the flow of
materials within the company. As discussed in the previous
chapter, the purchase requisition is a document sent from
inventory control to purchasing to request that additional raw
materials be purchased from a supplier.
Materials Requisition
No. 93043
Issued To: Store Room
Issue Date: 1/25/2013
Production Order Number: 100349
Part Number
Description
Quantity
Unit Cost $
Total Cost $
857
5' x 8' Plywood Board
30
2.00
60.00
124
72. Figure 4.7 Material Requisition
The idea of the material requisition and the production order is
to track all activity involved in the manufacture so that at any
time it is possible to both see the progress of the work and also
be able to determine the amount of accumulated costs involved
in the manufacture. So the material requisition is a record of
the raw materials going into production and will be traced to a
specific production order. Besides the materials, the production
work order will also track the labor and overhead expended in
producing the good. That means that every time the shop floor
initiates a material requisition, the information from the
material requisition is transferred to the production work order.
With a computerized system, all of this is done automatically by
the system.
As the work is moved from one workstation to another, there is
usually a move ticket that tracks the flow to the next
workstation. Again this is a way to keep track of where the
work that is being processed is located and how much of the
work has been completed. Figure 4.8 shows an example of a
move ticket.
Move Ticket
No.39485
Production Order Number: 100349
Date Transferred: 01/29/2013
From: Assembly
Workstation: A
Machine: 5
To: Painting
Workstation E
Machine: 1
Operation to Perform
Completed
Date
Time
73. Prepare
X
1/29
12:00
Paint
Package
Comments:
Figure 4.8 Move Ticket
The information on each move ticket is recorded on the
production order. When the product completes its final
operation, it is ready to be transferred off of the shop floor and
into finished goods inventory control. Again, a move ticket
documents this activity and the production order is then closed
(i.e. completed). This completes the production cycle.
However, this process has to be completed for each subassembly
before the finished good can be completed. Like we stated in
the beginning, this is not a simple process.
4.4 The Role of Information Technology
We have already discussed some of the ways computer
technology is involved in the pre-production process, but it will
usually be heavily involved in the production process also. As
materials and subassemblies move into, around and out of the
74. shop, it is very time consuming to be filling out material
requisition forms and move tickets. Instead of using these
documents, scanner technology is employed to track all of the
movements.
The scanning could be bar code based or RFID tag based. For
bar codes it would be necessary for the operator to physically
scan the items as they enter and leave the work station. For
RFID the scanning is passive, so as the item enters or leaves a
work area the system can automatically scan the item. This
information is then relayed to the information system. If an
ERP system is used such as SAP ERP, then all of the
information would be instantaneously available in all parts of
the system. For example, if a customer calls to determine the
status of a production order, any employee with the access and
authorization to query that part of the system can tell the
customer exactly where the order is on the shop floor, how
many more operations are left to do to complete the order and
even estimate when the order will be completed.
Figure 4.9 Barcode
Source: http://en.wikipe dia.org/wiki/Barcode
Figure 4.10 RFID Tag
Source: http://www.hive76.org/tag/rfid
4.5 Technical Section – Intermediate Level Excel
By this time in your academic career you should be familiar
with the rudimentary functions of using spreadsheets. In this
section of the chapter we will be looking at some of what are
classified as intermediate level Excel functions.
There are four different functions we will examine. They
include:
· Static and dynamic references
· Linking of spreadsheets
· IF statements
75. · VLOOKUP function
Static and Dynamic References
When you reference a cell, that cell reference can be fully
dynamic, partially dynamic or static. The usual reference is
fully dynamic. For example, if you reference cell A1 in the
spreadsheet, that is you want some other cell, say cell C7, to
use the value in cell A1, the dynamic version of that reference
is simply A1. Being dynamic means that if you copy cell C7 to
cell D9, then the reference will no longer be to cell A1, but to
B3 since the system added one to the letter sequence (going
from C to D) and two to the number sequence (going from 7 to
9). However, there are times when you don’t want the reference
to change. In this case if you preface the part of the reference
you don’t want to change with a dollar sign ($), then that part of
the reference will be static. Using the example above, if the
reference in cell C7 was $A1, then copying C7 to D9 would
result in a reference of A3 in cell D9. If the reference in C7
was A$1, then D9 would reference B1. The value $A$1 in cell
C7 remains referencing A1 in cell D9. This is demonstrated in
a YouTube video you can view.
Click here to view the video on Static and Dynamic References.
Linking Spreadsheets
Above we discussed referencing cells in the same spreadsheet.
You can also reference cells in other spreadsheets. While it is
possible to reference spreadsheets in a workbook other than the
one in which you are working, this generally is not a good idea
since that file must be available on a specific device and not be
moved or open when the reference activity is occurring. So we
will only discuss referencing different spreadsheets in the same
workbook (that is, it is in a different tab in the same workbook).
The reference to another tab is the following format ‘tabname’!
with the cell reference appended behind it. So if you are in a
tab called tab2 and you wish to reference cell B5 in the tab
named tab1, then the reference would be ‘tab1’!B5. This is
illustrated in a YouTube video and you will find that actual
mechanics of doing it are quite simple.
76. Click here to view the video on Linking Spreadsheets.
IF Statements
If multiple actions can be taken determined by the value stored
in a cell, then Excel IF statements can be used to determine the
appropriate action to take. For example, if when cell B3 is
greater than cell B4, you want the value stored in cell C5 to be
100, otherwise the value in cell C5 is 0. This is accomplished
by having the IF statement in cell C5 of
=IF(B3 > B4, 100,0)
The general form is IF(logical_test, value_if_true,
value_if_false). The logical test is a statement that results in a
logical conclusion of either TRUE or FALSE. The form of the
logical statement is VALUE Operator VALUE where the
operator can be greater than (>), less than (<), equal to (=),
greater than or equal to (>=), less than or equal to (<=) and
lastly not equal to (<>).
For complex relationships it may be necessary to nest IF
statements where either the value_if_true or the value_if_false
or both are IF statements. Extreme care must be taken with
nested IF statements, since if they are nested too deeply, the
logic becomes quite complex.
Again, there is a YouTube video dealing with IF statements.
Click here to view the video on IF Statements.
VLOOKUP Function
The VLOOKUP function is a table referencing tool within
Excel. The V in the name stands for vertical. In a vertical table
the computer scans the table starting at the top and goes down.
There is also a HLOOKUP function in which the computer scans
from left to right. Other than the scanning method, the two
functions are identical. So we will only discuss VLOOKUP.
VLOOKUP allows us to substitute one value in a table for
another value. For example, if we had three different values a
cell could have, such as high, medium and low, we could
substitute the values 9, 6 and 3 for the respective value. That is
the substitution table would look as follows:
77. Cell Value
New Value
High
9
Medium
6
Low
3
We can do the same operation using a series of deeply nested IF
statement, but the VLOOKUP function is much more direct and
easier to understand. The form of the function is:
VLOOKUP(lookup_value, table_array, col_index_num,
[range_lookup])
The lookup_value is the cell that you want to convert. In the
example above, it would be the cell that contains the value of
either High, Medium or Low. The table_array is the area in the
spreadsheet that holds the lookup table. For the example above
it would be the six cells that hold the High, Medium, Low, 9, 6
and 3. This would be referenced starting with the cell of the
upper left hand corner and the cell of the lower right hand
corner of the table with a colon between them. If in our
example the cell containing High was A1 and the cell containing
3 is B3, then the table_array would be A1:B3. The
col_index_num is the column of the table where you want to
find the search result. In this case it would be column 2. It
should be noted that the first column of the table must always
be the column where the lookup value is searched. The
[range_lookup] value determines if the table must be sorted. It
is optional, but I suggest that you use a value of FALSE, since
that means the table does not have to be sorted. For our example
the function would be:
VLOOKUP(F5,A1:B3,2,FALSE)
Where F5 is the cell that contains the value of either High,
Medium or Low, the table is located in cells A1, A2, A3, B1,
B2, and B3 and the second column in the table is the value that
78. is returned by the function.
This sounds a little complicated, but after you use it a while you
will get comfortable with it. Again, there is a YouTube video
dealing with this.
Click here to view the video on VLOOKUP.
Information: The Currency of Modern BusinessChapter 5 –
Decision Making
5.1 Introduction
Data is the life blood of any business organization. The
company data is one of the most important assets of a company.
Just having data is not good enough if it can’t be used properly
or if some of it is in error. The way in which a company stores
its data will many times determine the ultimate usefulness of
that data.
Some of the aspects of good data management are as follows:
· Accuracy
· Timeliness
· Relevance
· Accessibility
· Usability
· Integrity
· Completeness
What these attributes imply is that the data represents reality, is
data that is useful to the company and is available when needed.
One of the most important data aspects is that of data integrity.
This means that first of all the data is initially correct when
entered into the system and then remains accurate throughout its
useful life. An important concept of data integrity is the lack of
data redundancy. If the same data item is stored multiple times,
79. then there is a good chance that this data item will have
inconsistent values. For example, when multiple systems in a
company store a person’s address, almost always when an
address is changed in one system it will not be correctly
changed in the other systems. So even though the data was
correct when initially entered, it lost integrity because of
inconsistent handling of the data. Consequently, the same
person will have at least two different addresses with at least
one of them wrong. Of course, for data fields that are
frequently changed this will be an even more serious problem.
5.2 Data Uses
The data is used for record keeping and reporting purposes and
to make decisions. The record keeping and reporting data is
primarily used to measure a company’s performance. Some of
this measurement and reporting is mandated by government
laws and regulations. For example, for a corporation there are
reports that must be filed with the Internal Revenue Service, the
Securities and Exchange Commission, state and local taxing
agencies, etc. In addition, there are reports that are only used
internally to monitor, control and govern the company. For
example, determining the profit margins on the products a
company sells is an important measure of whether the company
will be successful. This type of data is only used internally and
its disclosure outside of the company would actually be harmful
to the company because it would allow competitors access to
information they could use to better compete against them.
Much of this same data that is used in reporting can also be
used in decision making. With respect to decision making there
are different types of decisions that will use different types of
data. The standard classification of decision types is usually
represented as a pyramid structure with the operational
decisions on the bottom of the pyramid, the tactical decisions in
the middle and the strategic decisions at the top. Figure 5.1
shows the decision pyramid.