1. Tutorial solutions week 4
Exercise 2.4
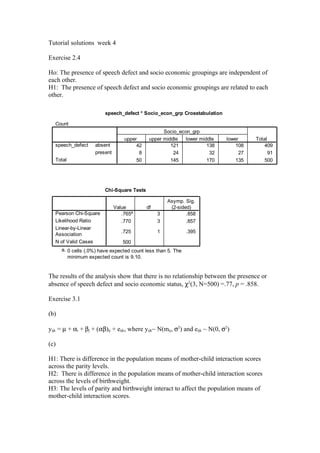
Ho: The presence of speech defect and socio economic groupings are independent of
each other.
H1: The presence of speech defect and socio economic groupings are related to each
other.
speech_defect * Socio_econ_grp Crosstabulation
Count
Socio_econ_grp
upper upper middle lower middle lower Total
speech_defect absent 42 121 138 108 409
present 8 24 32 27 91
Total 50 145 170 135 500
Chi-Square Tests
Asymp. Sig.
Value df (2-sided)
Pearson Chi-Square .765a 3 .858
Likelihood Ratio .770 3 .857
Linear-by-Linear
.725 1 .395
Association
N of Valid Cases 500
a. 0 cells (.0%) have expected count less than 5. The
minimum expected count is 9.10.
The results of the analysis show that there is no relationship between the presence or
absence of speech defect and socio economic status, χ2(3, N=500) =.77, p = .858.
Exercise 3.1
(b)
yijk = µ + αi + βj + (αβ)ij + eijk, where yijk~ N(mij, σ2) and eijk ~ N(0, σ2)
(c)
H1: There is difference in the population means of mother-child interaction scores
across the parity levels.
H2: There is difference in the population means of mother-child interaction scores
across the levels of birthweight.
H3: The levels of parity and birthweight interact to affect the population means of
mother-child interaction scores.
2. (d) and (e)
Tests of Between-Subjects Effects
Dependent Variable: interact
Type III Sum
Source of Squares df Mean Square F Sig.
Corrected Model 128.533a 5 25.707 6.598 .000
Intercept 2065.067 1 2065.067 530.008 .000
child 13.067 1 13.067 3.354 .073
birthwgt 97.733 2 48.867 12.542 .000
child * birthwgt 17.733 2 8.867 2.276 .112
Error 210.400 54 3.896
Total 2404.000 60
Corrected Total 338.933 59
a. R Squared = .379 (Adjusted R Squared = .322)
3. Estimated Marginal Means of interact
9.00 birthwgt
lbw<18
lbw >=18
nbw
8.00
Estimated Marginal Means
7.00
6.00
5.00
4.00
3.00
primi multi
child
The plot suggests a possible interaction between parity and birthweight. There is an
increase in the mean interaction scores for multiparious mothers compared to
primiparous mothers if their babies are normal body weight or the babies are low
birthweight but the mothers are older than 18 years. Mean interaction scores
decreases for multiparous mothers compared to primiparous mothers if the babies
have low birthweights and the mothers are less than 18 years.
However, the ANOVA results do not support an interaction effect between the
explanatory variables, F(2,54) = 2.28, p = .112. The results indicate a significant
difference between the levels of birthweight, F(2,54) = 12.54, p = .000, but no
difference in the levels of parity, F(1,54) = 3.35, p = .073.
Exercise 3.2
4. ANOVA
interact
Sum of
child Squares df Mean Square F Sig.
primi Between Groups 18.200 2 9.100 3.461 .046
Within Groups 71.000 27 2.630
Total 89.200 29
multi Between Groups 97.267 2 48.633 9.420 .001
Within Groups 139.400 27 5.163
Total 236.667 29
The between SSs add up to 115.467 (71 + 97.267). The SSs for birthweight (97.733)
and the interaction (17.733) add up to 116.466.
Adjusted F-value for primiparous is 9.1/3.896 = 2.336
Adjusted F-value for multiparous is 48.633/3.896 = 12.483
You then compare these values to F(2, 54) = 3.17. So we retain the Ho that there is a
no difference in mean mother child interaction scores across the levels of birthweight
for the primiparous mothers, but we reject the Ho that there is a no difference in mean
mother child interaction scores across the levels of birthweight for the multiparous
mothers.