Task content and wage dispersion: beyond polarization
•
1 like•259 views

Jobs can be thought of as a series of tasks, some of them levaing less space for autonomy and worker creativity. Such tasks have been termed ``routine'', as it is possible to write routines for machines to run them. We explore whether the importance of routine tasks is correlated to wage dispersion within occupations.
Recommended

Recommended
More Related Content
Similar to Task content and wage dispersion: beyond polarization
Similar to Task content and wage dispersion: beyond polarization (19)
More from GRAPE
More from GRAPE (20)
Recently uploaded
Recently uploaded (20)
Task content and wage dispersion: beyond polarization
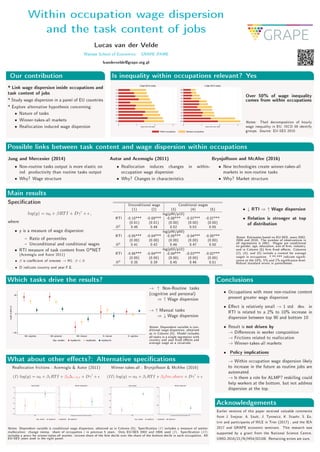
- 1. Within occupation wage dispersion and the task content of jobs Lucas van der Velde Warsaw School of Economics GRAPE |FAME lvandervelde@grape.org.pl Our contribution * Link wage dispersion inside occupations and task content of jobs * Study wage dispersion in a panel of EU countries * Explore alternative hypothesis concerning: • Nature of tasks • Winner-takes-all markets • Reallocation induced wage dispersion Is inequality within occupations relevant? Yes 0 .1 .2 .3 Value of the Theil index BGR LVA GBR LTU EST POL CYP FRA SVK CZE LUX 3 digit ISCO codes 0 .1 .2 .3 Value of the Theil index ROM PRT DEU ESP ITA HUN NLD GRC BEL FIN NOR SWE 2 digit ISCO codes Within occupations Between occupations Over 50% of wage inequality comes from within occupations Notes: Theil decomposition of hourly wage inequality in EU. ISCO 08 identify groups. Source: EU-SES 2010 Possible links between task content and wage dispersion within occupations Jung and Mercenier (2014) • Non-routine tasks output is more elastic on ind. productivity than routine tasks output • Why? Wage structure Autor and Acemoglu (2011) • Reallocation induces changes in within- occupation wage dispersion • Why? Changes in characteristics Brynjolfsson and McAfee (2016) • New technologies create winner-takes-all markets in non-routine tasks • Why? Market structure Main results Specication log(y) = α0 + βRTI + Dγ + , where • y is a measure of wage dispersion: Ratio of percentiles Unconditional and conditional wages • RTI measure of task content from O*NET (Acemoglu and Autor 2011) • β is coecient of interest → H1: β 0 • D indicate country and year F.E. Unconditional wage Conditional wages (1) (2) (3) (4) (5) log(p90/p10) RTI -0.10*** -0.09*** -0.08*** -0.07*** -0.07*** (0.01) (0.01) (0.00) (0.00) (0.00) R2 0.45 0.48 0.52 0.53 0.55 log(p90/p50) RTI -0.05*** -0.04*** -0.05*** -0.04*** -0.05*** (0.00) (0.00) (0.00) (0.00) (0.00) R2 0.41 0.42 0.46 0.47 0.50 log(p50/p10) RTI -0.06*** -0.04*** -0.04*** -0.03*** -0.02*** (0.00) (0.00) (0.00) (0.00) (0.00) R2 0.35 0.39 0.45 0.46 0.51 • ↓ RTI ⇒ ↑ Wage dispersion • Relation is stronger at top of distribution Notes: Estimates based on EU-SES, years 2002, 2006 and 2010. The number of observations in all regressions is 1862. Wages are conditional on gender, age, education, size of rm, industry, and in Column (5) rm xed eects. Columns (2), (4), and (5) include a control for average wages in occupation. *,**,*** indicate signi- cance at the 10%, 5% and 1% signicance level. Robust standard errors in parentheses. Which tasks drive the results? −.05 0 .05 Coeff.95%CI. NR. cognitive NR. personal NR. manual R. manual R. cognitive Dep. variable: ln(p90/p10) ln(p90/p50) ln(p50/p10) → ↑ Non-Routine tasks (cognitive and personal) ⇒ ↑ Wage dispersion → ↑ Manual tasks ⇒ ↓ Wage dispersion Notes: Dependent variable is con- ditional wage dispersion, obtained as in Column (5). Model includes all tasks in a single regression with country and year xed eects and average wage as a covariate. What about other eects?: Alternative specications Reallocation frictions - Acemoglu Autor (2011) (I) log(y) = α0 + β1RTI + β2∆t−5,t + Dγ + −.04 −.03 −.02 −.01 0 .01 RTI Task content −1 0 1 2 3 Change in emp. share of occupation (5 years) Worker reallocation Dep. variable: ln(p90/p10) ln(p90/p50) ln(p50/p10) Winner-takes-all - Brynjolfsson McAfee (2016) (II) log(y) = α0 + β1RTI + β2Inc.share + Dγ + −.08 −.06 −.04 −.02 0 RTI Task content 0 .005 .01 .015 Inc. share of top 10% / share of bottom 10% Winner−takes−all Dep. variable: ln(p90/p10) ln(p90/p50) ln(p50/p10) Notes: Dependent variable is conditional wage dispersion, obtained as in Column (5). Specication (I) includes a measure of worker reallocation: change inemp. share of occupation i in previous 5 years. Only EU-SES 2002 and 2006 used (I). Specication (II) includes a proxy for winner-takes-all market: income share of the rst decile over the share of the bottom decile in each occupation. All EU-SES years used in the right panel. Conclusions • Occupations with more non-routine content present greater wage dispersion • Eect is relatively small → 1 std. dev. in RTI is related to a 2% to 10% increase in dispersion between top 90 and bottom 10 • Result is not driven by → Dierences in worker composition → Frictions related to reallocation → Winner-takes-all markets • Policy implications → Within occupation wage dispersion likely to increase in the future as routine jobs are automated. → Is there a role for ALMP? reskilling could help workers at the bottom, but not address dispersion at the top. Acknowledgements Earlier versions of this paper received valuable comments from J. Svejnar, A. Szulc, J. Tyrowicz, K. Staehr, S. Es- trin and participants of WLE in Trier (2017) , and the IEA 2017 and GRAPE economic seminars. This research was supported by a grant from the National Science Centre, UMO-2016/21/N/HS4/02108. Remaining errors are ours.