1. UTI Focussed Equity Fund – Series I
(1100 Days)
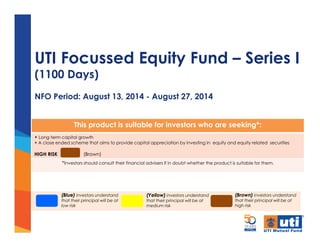
NFO Period: August 13, 2014 - August 27, 2014
This product is suitable for investors who are seeking*:
• Long term capital growth
• A close ended scheme that aims to provide capital appreciation by investing in equity and equity related securities
HIGH RISK (Brown)
*Investors should consult their financial advisers if in doubt whether the product is suitable for them.
(Brown) investors understand
that their principal will be at
high risk
(Yellow) investors understand
that their principal will be at
medium risk
(Blue) investors understand
that their principal will be at
low risk
2. Agenda
Equity Markets: Report Card
Stock Selection @ UTI Mutual Fund
UTI Focussed Equity Fund – Series I (1100 days)
Bull-market Investing - Myth buster
3. Equity Markets: Report Card
Stock Selection @ UTI Mutual Fund
UTI Focussed Equity Fund – Series I (1100 days)
Bull-market Investing - Myth buster
5. Lower inflation essential to growth in equity markets
Data Source: CMIE & MOSPI; YoY: Year on Year
3
4
5
6
7
8
9
10
11
12
13
2002-03
2003-04
2004-05
2005-06
2006-07
2007-08
2008-09
2009-10
2010-11
2011-12
2012-13
2013-14
Real GDP CPI
Market returns
above average
YoY
Movement
(%)
Market
returns
below
average
YoY YoY
Fiscal Year timeline
6. Inflation expected to fall steadily…
Data Source : Morgan Stanley Research
16%
14%
12%
10%
8%
6%
4%
2%
0%
Jan-99
Mar-00
May-01
Jul-02
Sep-03
Nov-04
Jan-06
Mar-07
May-08
Jul-09
Sep-10
Nov-11
Jan-13
Mar-14
CPI (IW) WPI
YoY, 6 Month Moving Average (MMA)
1999
2000
2001
2002
2003
2004
2005
2006
2007
2008
2009
2010
2011
2012
2013
2014
Timeline
Inflation
Rate
YoY
Movement
%
7. …Leading to lower interest rates…
Data Source : Morgan Stanley Research, E=Morgan Stanley Estimates
Note: Liquidity Adjustment Facility using repo and reverse repo started from 2001
0.00
2.00
4.00
6.00
8.00
10.00
12.00
14.00
Apr-90 Apr-93 Apr-96 Apr-99 Apr-02 Apr-05 Apr-08 Apr-11 Apr-14
Bank Rate Repo Reverse
Interest
Rate
Movement
%
Key Policy and Money Market Rates
4
Timeline
8. Data Source : Phillip Capital
…Fuelling credit growth going forward….
Timeline
YoY
Growth
%
9. Headroom for EBITDA margins improvement…
Data Source: Bank of America-Merrill Lynch Global Research
Timeline
EBITDA
Margin
%
13. Equity Markets: Report Card
Stock Selection @ UTI Mutual Fund
UTI Focussed Equity Fund – Series I (1100 days)
Bull-market Investing - Myth buster
14. “A great business at a fair price is superior to a fair
business at a great price” Charlie Munger
• Focus on quality is the cornerstone of our investment process
• 95% of our AUM is in the Evergreens and Potential
Positive OCF*
PAT 50 Crs
Potential
- 4 out of 5 years
-Companies: 108
Evergreen
- 5 out of 5 years
- Companies: 167
Fairweather
-2 to 3 out of 5 years
- Companies: 209
Hope-“less”
- Less than 2 out of 5 years
- Companies: 50
*OCF: Operating Cash Flow = Profit After Tax (PAT)+Depreciation + Changes in working capital
Universe of Companies: CNX 500 and Companies that UTI Mutual Fund is currently invested in.
15. Framework for investing in a stock
* Key differentiators for UTI Mutual Fund
Growth
•Market/Industry
•Sales
Positive
OCF*
•Trend
•Through-cycle
Earnings
Quality*
•OCF/EBITDA
•FCF/PAT
Valuation
•Generic metrics
•Sector metrics
•Historic Cross-
sectional
Business
Cycle
Management
Quality
16. Equity Markets: Report Card
Stock Selection @ UTI Mutual Fund
UTI Focussed Equity Fund – Series I (1100 days)
Bull-market Investing - Myth buster
17. Bull-market Investing - Myth* buster
Data Source: Bloomberg,
Methodology: The weighted average absolute returns of the stocks in the respective quadrants have been
taken after removing the top two and bottom two outliers in each quadrant. * Lehman Crisis of Sep 2008
*Inferior quality companies underperform even in a bull market
327%
241%
213%
181%
June 04 to Sep 08
Evergreens Potential Fairweather Hopeless
Weighted
average
absolute
Return
%
Timeline
*
18. 81%
250%
77%
(31)%
136%
216%
117%
(45)%
113%
186%
105%
(45)%
117%
172%
89%
(43)%
“ Investment is the discipline of relative selection”
Howard Marks
Sensex
Jan 03 – Jun 04 Jun 04 – Dec 06 Dec 06 – Dec 07 Dec 07 – Sep 08*
Evergreen
Potential
Fairweather
Hope-”less”
Data Source: Bloomberg,
Methodology: The weighted average absolute returns of the stocks in the respective quadrants have been taken
after removing the top two and bottom two outliers in each quadrant. * Lehman Crisis of Sep 2008
Weighted
average
absolute
Return
%
0
5000
10000
15000
20000
25000
19. Equity Markets: Report Card
Stock Selection @ UTI Mutual Fund
Bull-market Investing - Myth buster
UTI Focussed Equity Fund – Series I (1100 days)
21. UTI Focussed Equity Fund – Series I
Name of the scheme UTI Focussed Equity Fund – Series I (1100Days)
Type of Scheme A Close ended equity scheme
Scheme Objective The primary objective of the scheme is to generate long term capital
appreciation by investing predominantly in equity and equity related
securities of listed companies. The scheme will without any capitalization
bias endeavor to invest in either growth stocks or value stocks or both.
The Scheme will normally hold upto 30 stocks in the portfolio. The Scheme
does not guarantee/indicate any returns. There can be no assurance
that the Scheme’s objectives will be achieved.
Fund Manager Anoop Bhaskar Lalit Nambiar
Benchmark SP BSE200
NFO Period August 13, 2014 to August 27, 2014
Tenure 1100 days
Minimum Application Amount Rs. 5000/-
Plans Available Regular Direct
Load Structure Entry Load: Not Applicable
Exit Load: For Redemptions made on the Maturity Date / Final
Redemption Date, the AMC will not charge any Exit Load.
Options Available Growth Dividend option with payout facility
22. • No. of stocks (Maximum): 30 (UTI MF’s best stock ideas)
• No capitalization bias
• No style bias
• No theme bias
• Single-Stock limit: 8%
• Sector limit: 30%
UTI Focussed Equity Fund – Portfolio Construction
24. Evolving specialty-chemical story
• Leading specialty chemical player with niche expertise in new chemistry
• Company is on verge of exponential growth in speciality chemicals business
• Stable cash generation in base business, enabling investments in higher RoCE businesses
• Leading player in refrigerant gas business with 40% domestic market share
• Recent capex phase to bear fruit over next 5 years
-
200
400
600
800
1,000
1,200
1,400
FY04 FY05 FY06 FY07 FY08 FY09 FY10 FY11 FY12 FY13 FY14
Growth trend
Sales(Normalised Scale) PAT
Evergreen
0
5
10
15
20
25
30
35
40
45
FY02 FY03 FY04 FY05 FY06 FY07 FY08 FY09 FY10 FY11 FY12 FY13 FY14
Return Ratios set to improve
RoE (%) RoCE (%)
(%)
Data Source: Bloomberg. The chart above is for illustrative purposes only and should not be construed as advise. The above is to illustrate the concept of identifying stocks in the market. There is also a
possibility of the expected event not happening or some other unforeseen event that may affect performance of the company. The performance of stocks would ultimately depend on various factors such
as prevailing market conditions, global political scenario, exchange rate etc. Investors are requested to note that there are various factors (both local and international) that can have impact on the future
performance and expectations of any company. Information given is available in public domain. There is no assurance or guarantee of any company being able to sustain its performance in future. There is
no assurance or guarantee that the scheme would invest in this stock.
Base Year(FY04 = 100)
(Rebased
Scale)
Sales in Rs. Cr (rebased scale) in Rs. Cr (rebased scale)
25. Regional bank going national
• Strong regional franchise rolling out pan-India under a new management
• Large NRI deposit franchise complemented by CASA deposits
• Consolidation and investment phase over, ripe for rise in returns on investments
• 6 quarters of improving asset quality in an environment of severe asset stress
• Capital efficient with no dilution for last 5 years, despite doubling the asset.
Evergreen
-
0.2
0.4
0.6
0.8
1.0
1.2
1.4
1.6
0
10
20
30
40
50
60
FY04 FY05 FY06 FY07 FY08 FY09 FY10 FY11 FY12 FY13 FY14
Cost/Income to decline, RoA booster
RoA Cost-to-Income
-
1.0
2.0
3.0
4.0
5.0
6.0
7.0
8.0
FY04 FY05 FY06 FY07 FY08 FY09 FY10 FY11 FY12 FY13 FY14
Improving Asset Quality
GNPA(%) NNPA(%)
(%)
(%)
(%)
Data Source: Bloomberg. The chart above is for illustrative purposes only and should not be construed as advise. The above is to illustrate the concept of identifying stocks in the market. There is also a
possibility of the expected event not happening or some other unforeseen event that may affect performance of the company. The performance of stocks would ultimately depend on various factors such
as prevailing market conditions, global political scenario, exchange rate etc. Investors are requested to note that there are various factors (both local and international) that can have impact on the future
performance and expectations of any company. Information given is available in public domain. There is no assurance or guarantee of any company being able to sustain its performance in future. There is
no assurance or guarantee that the scheme would invest in this stock.
(%)
26. Global Engineering Model
• A leading player in global heavy commercial vehicles’ forging space
• Has developed comprehensive product range for the Non-auto segment
• Emerged stronger post the global financial crisis
• FCF generation to accelerate, as the recent capex phase is now over
• Entry into new areas : including passenger cars and energy
(200)
(100)
-
100
200
300
400
500
600
700
800
900
FY04 FY05 FY06 FY07 FY08 FY09 FY10 FY11 FY12 FY13 FY14
Growth trend
Sales PAT(Normalised Scale)
Evergreen
82%
85%
68%
69%
80%
46%
43%
61%
69%
51%
47%
29%
27%
25% 25%
24%
17%
22%
24%
25%
23%
25%
0%
10%
20%
30%
40%
50%
60%
70%
80%
90%
15%
17%
19%
21%
23%
25%
27%
29%
FY04 FY05 FY06 FY07 FY08 FY09 FY10 FY11 FY12 FY13 FY14
Capacity utilization rise to drive margins up
Capacity utilization EBITDA Margin
Data Source: Bloomberg. The chart above is for illustrative purposes only and should not be construed as advise. The above is to illustrate the concept of identifying stocks in the market. There is also a
possibility of the expected event not happening or some other unforeseen event that may affect performance of the company. The performance of stocks would ultimately depend on various factors such
as prevailing market conditions, global political scenario, exchange rate etc. Investors are requested to note that there are various factors (both local and international) that can have impact on the future
performance and expectations of any company. Information given is available in public domain. There is no assurance or guarantee of any company being able to sustain its performance in future. There is
no assurance or guarantee that the scheme would invest in this stock.
Base Year(FY04 = 100)
(Rebased
Scale)
Sales in Rs. Cr (rebased scale) PAT in Rs. Cr (rebased scale)
27. 'Cool' India franchise
• Market leader in room air conditioner(RAC) segment in India
• 23% Industry CAGR in prior growth phase(FY04-11); ~17% CAGR expected in FY14-17
• Change in product mix brand salience to support margin expansion
• Well placed to capitalise on cyclical recovery in MEP* business in India and Middle East
• Well managed MEP business with limited working cap. and high potential ROCE
-
100
200
300
400
500
600
700
800
900
1,000
FY04 FY05 FY06 FY07 FY08 FY09 FY10 FY11 FY12 FY13 FY14
Growth Trend
Sales PAT(Normalised Scale)
*MEP-Mechanical Engineering Plumbing
Potential
-4%
-2%
0%
2%
4%
6%
8%
10%
12%
FY04 FY05 FY06 FY07 FY08 FY09 FY10 FY11 FY12 FY13 FY14
MEP Margins bottomed out
MEP EBIT%
(Rebased
Scale)
Data Source: Bloomberg. The chart above is for illustrative purposes only and should not be construed as advise. The above is to illustrate the concept of identifying stocks in the market. There is also a
possibility of the expected event not happening or some other unforeseen event that may affect performance of the company. The performance of stocks would ultimately depend on various factors such
as prevailing market conditions, global political scenario, exchange rate etc. Investors are requested to note that there are various factors (both local and international) that can have impact on the future
performance and expectations of any company. Information given is available in public domain. There is no assurance or guarantee of any company being able to sustain its performance in future. There is
no assurance or guarantee that the scheme would invest in this stock.
Base Year(FY04 = 100)
Sales in Rs. Mn (rebased scale) PAT in Rs. Mn (rebased scale)
28. An MNC Transformation
• Top play on ‘premiumisation’ theme in the consumer discretionary segment
• Poised to be the biggest beneficiary of increasing discretionary spend
• Industry leadership and MNC management provide the best of both worlds
• Value un-locking from tighter working capital, and price-led margin expansion
• Investments in back end ensures an un-parallel competitive advantage
(2,000)
(1,500)
(1,000)
(500)
-
500
1,000
1,500
2,000
2,500
FY04 FY05 FY06 FY07 FY08 FY09 FY10 FY11 FY12 FY13 FY14*
Growth Trend
Fairweather
0
5
10
15
20
25
FY04 FY05 FY06 FY07 FY08 FY09 FY10 FY11 FY12 FY13 FY14*
Profitability to improve
EBIDTA Margin %
Data Source: Bloomberg. The chart above is for illustrative purposes only and should not be construed as advise. The above is to illustrate the concept of identifying stocks in the market. There is also a
possibility of the expected event not happening or some other unforeseen event that may affect performance of the company. The performance of stocks would ultimately depend on various factors such
as prevailing market conditions, global political scenario, exchange rate etc. Investors are requested to note that there are various factors (both local and international) that can have impact on the future
performance and expectations of any company. Information given is available in public domain. There is no assurance or guarantee of any company being able to sustain its performance in future. There is
no assurance or guarantee that the scheme would invest in this stock.
(%)
(Rebased
Scale)
Base Year(FY04 = 100)
Sales in Rs. Mn (rebased scale) PAT in Rs. Mn (rebased scale)
29. In short….
• Equity markets poised for growth
• Focus on quality
• Gain from concentration
• Time-in over timing
Strategy
Focus
Patience
Accelerate your wealth creation
Now, Invest in a fixed period concentrated equity portfolio
31. Disclaimers
Mutual Fund Investments are subject to market risks, read all scheme related
documents carefully
All figures and other data given in this document are as on 30th June 2014 unless stated otherwise. The same may or
may not be relevant at a future date. The AMC takes no responsibility of updating any data/information in this
material from time to time. The information shall not be altered in any way, transmitted to, copied or distributed, in
part or in whole, to any other person or to the media or reproduced in any form, without prior written consent of UTI
Asset Management Company Ltd.
Furthermore prospective investors are advised to consult their own legal, tax and financial advisors to determine
possible tax, legal and other financial implication or consequence of subscribing to the units of UTI Asset
Management Company Ltd.
The information on this document is provided for information purposes only. It does not constitute any offer,
recommendation or solicitation to any person to enter into any transaction or adopt any hedging, trading or
investment strategy, nor does it constitute any prediction of likely future movements in rates or prices or any
representation that any such future movements will not exceed those shown in any illustration. Users of this document
should seek advice regarding the appropriateness of investing in any securities, financial instruments or investment
strategies referred to on this document and should understand that statements regarding future prospects may not
be realized. The recipient of this material is solely responsible for any action taken based on this material. Opinions,
projections and estimates are subject to change without notice.
UTI AMC Ltd is not an investment adviser, and is not purporting to provide you with investment, legal or tax advice. UTI
AMC Ltd or UTI Mutual Fund (acting through UTI Trustee Company Pvt. Ltd) accepts no liability and will not be liable for
any loss or damage arising directly or indirectly (including special, incidental or consequential loss or damage) from
your use of this document, howsoever arising, and including any loss, damage or expense arising from, but not limited
to, any defect, error, imperfection, fault, mistake or inaccuracy with this document, its contents or associated services,
or due to any unavailability of the document or any part thereof or any contents or associated services.
32. Glossary
GDP: Gross Domestic Product
CPI (IW): Consumer Price Index for Industrial Workers
WPI: Wholesale Price Index
EBITDA: Earnings before interest, taxes, depreciation and amortization
EPS: Earnings Per Share
CAGR: Compound Annualized Growth Rate
Std. Dev: Standard Deviation
AuM: Assets under management
RoA: Return on Assets
PAT: Profit after tax
Lev: Leverage
FCF: Free Cash Flow
ROE: Return on Equity
ROCE: Return on capital employed
GNPA: Gross Non Performing Assets
NNPA: Net Non Performing Assets
+/-1 Std Dev: 68% of the values are within 1 standard deviation of the mean
Sensex EPS: Aggregated for 30 companies in the Sensex
A = ∑ (Absolute Adjusted PAT * Free Float Factor) =∑ Free Float PAT
For 30 companies,
B = ∑ Free Float Mkt Cap
P/E = Free Float Mkt Cap / Free Float PAT
Sensex EPS = Sensex Value/ (P/E)
NRI: Non Resident Indian
CASA: Current Account Savings Account
CMIE: Centre of Monitoring Indian Economy
MOSPI: Ministry of Statistics and Programme Implementations
MNC: Multi National Company
NFO: New Fund Offer
Charlie Munger : He is an American business magnate, lawyer, investor, and philanthropist. He is Vice-
Chairman of Berkshire Hathaway Corporation, the diversified investment corporation
chaired by Warren Buffett
Howard Marks : He is an American investor and writer. In 1995, he co-founded Oaktree Capital
Management