
Recommended
Recommended
More Related Content
Similar to Invest In Value Opportunities Fund - UTI Mutual Fund
Similar to Invest In Value Opportunities Fund - UTI Mutual Fund (20)
Recently uploaded
Recently uploaded (20)
Invest In Value Opportunities Fund - UTI Mutual Fund
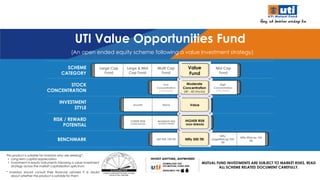
- 1. Information Classification: UTI AMC - Confidential Information Classification: UTI AMC - Confidential This product is suitable for investors who are seeking*: • Long term capital appreciation • Investment in equity instruments following a value investment strategy across the market capitalization spectrum * Investors should consult their financial advisers if in doubt about whether the product is suitable for them SCHEME CATEGORY STOCK CONCENTRATION INVESTMENT STYLE RISK / REWARD POTENTIAL BENCHMARK Low Concentration (> 60 stocks) Moderate Concentration (40 - 60 stocks) High Concentration (<40 stocks) Large Cap Fund Large & Mid Cap Fund Multi Cap Fund Value Fund Mid Cap Fund Growth Blend Value UTI Value Opportunities Fund (An open ended equity scheme following a value investment strategy) S&P BSE 100 TRI Nifty 500 TRI Nifty LargeMidcap 250 TRI Nifty Midcap 150 TRI MUTUAL FUND INVESTMENTS ARE SUBJECT TO MARKET RISKS, READ ALL SCHEME RELATED DOCUMENT CAREFULLY. LOWER RISK LOWER REWARD MODERATE RISK MODERATE REWARD HIGHER RISK HIGH REWARD
- 2. Information Classification: UTI AMC - Confidential Information Classification: UTI AMC - Confidential POWERED BY TEAM PROCESS STRATEGIES MUTUAL FUND INVESTMENTS ARE SUBJECT TO MARKET RISKS, READ ALL SCHEME RELATED DOCUMENTS CAREFULLY Team driven approach Discussion & Review Standardized research methodology Identifying good stocks, avoiding poor stocks Consistency over time Support diverse strategies Style discipline – mandate & style drive the choice of stocks across the OCF & RoCE tiers Companies get Operating Cash Flow (OCF) & Return on Capital Employed (RoCE) ratings based on their previous 5 years financials 3 Tier Rating System C1 C2 C3 OCF Rating LOW HIGH CONSISTENCY R1 R2 R3 RoCE Rating LOW HIGH CONSISTENCY Operating Cash Flow (OCF) Tiers - 3 Tiers (C1/ C2/ C3) based on the number of years in which they have generated positive operating cash flows in the previous 5 years (for manufacturing companies). Return on Capital Employed (RoCE) / Implied Return on Equity (RoE) Tiers - 3 Tiers (R1/ R2/ R3) based on the previous 5-year average return on capital (for manufacturing companies & non-lending nonbanking finance companies (NBFCs)) & based on the previous 5-year average return on asset for banks & NBFCs (including housing finance companies).
- 3. Information Classification: UTI AMC - Confidential Information Classification: UTI AMC - Confidential Product Spectrum on Risk v/s Return Grid (Active Funds) 3 UTI LTEF (Tax Saving) – UTI Long Term Equity Fund (Tax Saving); UTI B&FS Fund – UTI Banking & Financial Services Fund; UTI T&L Fund – UTI Transportation & Logistics Fund The above representation is only for understanding purpose, one should not constitute portfolio only based on the above and advised to approach their financial advisors based on the investors respective risk profile before making investment decisions. UTI Value Opportunities Fund UTI Mastershare Unit Scheme UTI LTEF (Tax Saving) UTI Flexi Cap Fund UTI Mid Cap Fund UTI Dividend Yield Fund UTI MNC Fund UTI Small Cap Fund UTI India Consumer Fund UTI T&L Fund UTI Healthcare Fund UTI B&FS Fund UTI Infrastructure Fund CORE ALLOCATION CORE SATELLITE ALLOCATION TACTICAL ALLOCATION RISK / STANDARD DEVIATION RETURN POTENTIAL UTI Core Equity Fund UTI Focused Equity Fund
- 4. Information Classification: UTI AMC - Confidential Information Classification: UTI AMC - Confidential “Value”: is what you get The essence is to find a balance between the two to maximize the return Value & Price “Price”: is what you pay - Warren Buffet 4
- 5. Information Classification: UTI AMC - Confidential Information Classification: UTI AMC - Confidential Market price of a Stock Time Intrinsic Value of the stock Market price of the stock Margin of Safety Greed (overvalued) Fear (undervalued) For each asset you’re considering, you must have a strongly held view of its intrinsic value. When its price is below that value, it’s generally a buy. When its price is higher, it’s a sell. In a nutshell, that’s value investing. – Howard Marks Margin of Safety: is the cushion that is created when the stock is trading below its intrinsic value. Buying a stock at a discount to its intrinsic value would limit the downside The key to margin of safety is identifying the “intrinsic value” of a stock Margin of Safety 5
- 6. Information Classification: UTI AMC - Confidential Information Classification: UTI AMC - Confidential Discounted cash flow ― Present value of future cash flows Free cash flow yield ― Cash flow after working capital changes and capital investment Earnings yield ― Inverse of Price Earnings ratio (100 / P/E) Replacement value ― Current cost to build/replace an asset Book value ― Net worth of the company adjusted for intangibles/amortization Determining Intrinsic Value 6
- 7. Information Classification: UTI AMC - Confidential Information Classification: UTI AMC - Confidential What we prefer Intrinsic Value in Practice 7 What we avoid Businesses which demonstrate high/consistent conversion of EBITDA into Operating Cash Flow (OCF) Healthy Return on Capital Employed (ROCE) over the cycle Businesses with weak operating profitability can be considered if they have operating leverage and the ability to self fund growth Businesses with potential option value in adjacencies Valuation to be considered in conjunction with critical issues such as ROCE, Leverage and governance FCF yields at stock level and price to book multiple at portfolio level over other valuation metrics Businesses with poor/inconsistent cash flow and low ROCE Businesses with limited re-investment opportunity, low terminal value Companies with stressed balance sheets Companies with track record of poor /value eroding capital allocation Companies with history of weak corporate governance, agency problems such as unrelated diversification and misalignment of incentives Buying businesses solely based on cheap multiples if the businesses does not have potential for intrinsic value compounding Please refer to the following blogs by Fund Manager, Mr. Amit Premchandani for more details on value investing: What is Value? ; What is Value? – Part 2
- 8. Information Classification: UTI AMC - Confidential Information Classification: UTI AMC - Confidential Sector selection – Focus on valuations Stock selection – A Barbell approach Flexibility – To position across the market cap spectrum, based on valuations Blend of top-down (sector concentration) & bottom-up (for stock picking) Investment Strategy Market may under appreciate the sustainability of competitive advantages and/ or the length of the growth runway for the company Companies that may be experiencing challenges due to cyclical factors, changes in the environment or their own past actions 8 These companies defy typical expectations of cyclicality. In these companies the market ignores the existence of cycles. BUYING WHAT THE MARKET UNDERESTIMATES
- 9. Information Classification: UTI AMC - Confidential Information Classification: UTI AMC - Confidential Market Cap Internal Limits Portfolio Turnover Agnostic to Market Cap Preferred Allocation: Biased to Large caps; flexible to Mid/ Small caps exposure Single Sector – Lower of 35% or Benchmark plus 12% Single Stock – Maximum of 10% Top 10 Stocks – Maximum of 55% 05 Investment Style 01 Value Tilt Follows barbell approach – buying what market underestimates Stock/Sector Selection 02 03 04 Blend Approach Top-down for Sector selection & Bottom-up for Stock selection Low to Moderate Churn Mid/ Small cap exposure could vary, widely based on valuation differentials Investment Framework
- 10. Information Classification: UTI AMC - Confidential Information Classification: UTI AMC - Confidential UTI Value Opportunities Fund – Fund Facts An open ended equity scheme following a value investment strategy Type of scheme 20th July, 2005 Fund Inception Mr. Amit Premchandani, CFA, CA, PGDM (Managing since Feb 2018) Fund Manager Nifty 500 TRI Benchmark ` 5,000/- and in multiples of ` 1/- Subsequent min. investment, ` 1,000/- and in multiples of ` 1/- Minimum Investment Investment Objective The primary objective of the scheme is to generate long term capital appreciation by investing predominantly in equity and equity related securities of companies across market capitalization spectrum. However, there can be no assurance or guarantee that the investment objective of the scheme would be achieved. Asset Allocation Instruments Indicative Allocation (% of total assets) Risk Profile Minimum Allocation (%) Maximum Allocation (%) Equity and equity related instruments 65 100 Medium to High Debt and Money Market instruments including securitized debt# 0 35 Low to Medium Units issued by REITs & InvITs 0 10 Medium to High #The fund may invest up to 50% of its debt portfolio in securitized debt. 10
- 11. Information Classification: UTI AMC - Confidential Information Classification: UTI AMC - Confidential Fund Size: Monthly Avg. AuM : ` 6,080 Crores Last Day AuM : ` 6,055 Crores No. of Unit Folios : 4,73,004 Fund Snapshot Market Capitalisation (%) Quantitative Indicators 59 No. of Stocks 33.52% / 46.54% Top 5 / Top10 Stocks Fund Facts (contd.) OCF C1 : 93% C2 : 6% C3 : 1% ROCE R1 : 54% R2 : 25% R3 : 21% Portfolio Composition# Fund BM Beta : 0.94 1.00 SD (3 Years) : 20.87% 21.74% PTR (Annual) : 23.00% - Sharpe Ratio : 0.41 - Fund BM Large : 69 78 Mid : 17 15 Small : 14 7 Nifty 500 TRI UTI Value Opportunities Fund Return on Equity Price to Earnings Price to Book Active Share : 65.25% 11 Avg. AuM – Average Asset under Management, BM – Benchmark, SD – Standard Deviation, PTR – Portfolio Turnover Ratio, Market cap – Market Capitalisation, ROCE – Return on Capital Employed. # Operating Cash Flow Tiers (C)- 3 Tiers based on the number of years in which they have generated positive operating cash flows in the previous 5 years (for manufacturing companies). RoCE/ Implied RoE Tiers (R) - 3 Tiers based on the previous 5 year average return on capital (for manufacturing companies & non-lending non banking finance companies (NBFCs)) & based on the previous 5 year average return on asset for banks & NBFCs (including housing finance companies). All data are as of June 30, 2022 6.98 4.76 31.39 30.57 16.94 14.58
- 12. Information Classification: UTI AMC - Confidential Information Classification: UTI AMC - Confidential Long-term trend of portfolio composition 12 Data as of June 30, 2022, Benchmark – Nifty 500 TRI RoCE Tier OCF Tier High preference for companies with consistent generation of positive operating cash flows (C1 rated) over the longer period Biased towards R1 rated companies along with reasonable allocation to R2 and R3 rated businesses which indicates the barbell approach of investing with value tilt 0% 20% 40% 60% 80% 100% Jun-19 Dec-19 Jun-20 Dec-20 Jun-21 Dec-21 Jun-22 C1 C2 C3 0% 20% 40% 60% 80% 100% Jun-19 Dec-19 Jun-20 Dec-20 Jun-21 Dec-21 Jun-22 R1 R2 R3
- 13. Information Classification: UTI AMC - Confidential Information Classification: UTI AMC - Confidential Long-term trend of portfolio composition (contd.) 13 P/E Multiple (x) P/B Multiple (x) Data as of June 30, 2022, Benchmark – Nifty 500 TRI RoE Market Cap Break-up (%) Active Share (%) 20 24 28 32 36 40 Jun-19 Dec-19 Jun-20 Dec-20 Jun-21 Dec-21 Jun-22 Multiple (x) UTI Value Opp Fund Benchmark UTI Value Opp Fund (Average) Benchmark (Average) 3 4 5 6 7 8 9 10 Jun-19 Dec-19 Jun-20 Dec-20 Jun-21 Dec-21 Jun-22 Multiple (x) UTI Value Opp Fund Benchmark UTI Value Opp Fund (Average) Benchmark (Average) 12 13 14 15 16 17 18 19 20 Jun-19 Dec-19 Jun-20 Dec-20 Jun-21 Dec-21 Jun-22 Multiple (x) UTI Value Opp Fund Benchmark UTI Value Opp Fund (Average) Benchmark (Average) 0% 20% 40% 60% 80% 100% Jun-19 Dec-19 Jun-20 Dec-20 Jun-21 Dec-21 Jun-22 Active Share 0 20 40 60 80 100 Jun-19 Dec-19 Jun-20 Dec-20 Jun-21 Dec-21 Jun-22 Large Cap Mid Cap Small Cap
- 14. Information Classification: UTI AMC - Confidential Information Classification: UTI AMC - Confidential Sector-wise Portfolio Composition OCF (%) RoCE (%) C1 C2 C3 R1 R2 R3 Sector Level Auto & Auto Components 100 - - 78 11 11 Capital Goods 100 - - 74 26 - Chemicals 100 - - 100 - - Construction - - 100 100 - - Construction Materials 100 - - - 100 - Consumer Durables 78 22 - 100 - - Consumer Services 94 - 6 35 - 65 Fast Moving Consumer Goods 100 - - 91 9 - Financial Services - - - 46 29 25 Healthcare 87 13 - 26 61 13 Information Technology 100 - - 100 - - Metals & Mining 100 - - - 51 49 Oil, Gas & Consumable Fuels 100 - - 100 - - Power 100 - - - 100 - Realty 72 28 - - 64 36 Services - 100 - - 100 - Telecommunication 100 - - - - 100 Fund Level Portfolio 93 6 1 54 25 21 Data as of June 30, 2022. OCF – Operating Cash Flow, ROCE – Return on Capital Employed 14
- 15. Information Classification: UTI AMC - Confidential Information Classification: UTI AMC - Confidential Barbell Approach: Reflected in stock valuations Data as of June 30, 2022. PE – Price to Earnings, PB – Price to Book 15 Construction Materials (2) Consumer Durables (4) Consumer Services (4) FMCG (4) Information Technology (3) Metals & Mining (2) Oil, Gas & Consumable Fuels (2) 12.66 16.96 5.62 23.17 36.93 50.31 30.29 22.40 1.87 3.26 1.27 7.11 18.41 8.14 5.12 Low High Low High 17.40 89.52 1.00 6.06 P/E P/B Auto & Auto Components (5) Capital Goods (5) Sector (Stock Count) 0.00 4.81 Chemicals (1) 21.16 1.53 Healthcare (7) 18.30 4.40 Financial Services (12) 2.61 0.93 22.32 2.93 Realty (3) Power (1) 25.61 8.01 2.58 1.08 62.27 8.13 5.30 0.96 88.93 3.52 51.11 15.84 54.66 2.78 10.79 29.41 3.93 32.18 24.39 11.75 92.60 7.67 1.28 Services (1) - 7.98 Telecommunication (1) 89.51 5.75
- 16. Information Classification: UTI AMC - Confidential Information Classification: UTI AMC - Confidential Portfolio STOCK NAME SECTOR % to NAV Act. Wt % HDFC BANK LIMITED FINANCIAL SERVICES 9.46 3.76 ICICI BANK LTD FINANCIAL SERVICES 7.83 3.09 INFOSYS LTD. IT 7.49 2.33 BHARTI AIRTEL LTD. TELECOMMUNICATION 4.53 2.93 AXIS BANK LTD. FINANCIAL SERVICES 4.21 2.59 STATE BANK OF INDIA FINANCIAL SERVICES 3.69 1.97 ITC LTD. FMCG 2.71 0.40 BAJAJ AUTO LTD. AUTO & AUTO COMPONENTS 2.63 2.16 EICHER MOTORS LTD AUTO & AUTO COMPONENTS 2.03 1.65 CIPLA LTD. HEALTHCARE 1.96 1.48 A B FASHION & RETAIL CONSUMER SERVICES 1.96 1.88 MARUTI SUZUKI INDIA LTD. AUTO & AUTO COMPONENTS 1.95 0.86 AIA ENGINEERING LTD. CAPITAL GOODS 1.84 1.76 SUN PHARMACEUTICALS HEALTHCARE 1.65 0.79 TECH MAHINDRA LTD. INFORMATION TECHNOLOGY 1.65 1.04 AJANTA PHARMA LTD. HEALTHCARE 1.53 1.48 INDUSIND BANK FINANCIAL SERVICES 1.51 1.01 BHARAT FORGE LTD. CAPITAL GOODS 1.51 1.35 KEC INTERNATIONAL LTD. CAPITAL GOODS 1.49 1.44 COROMANDEL INTER. CHEMICALS 1.46 1.35 Equity Top 20 Holdings Portfolio above shows Top 20 equity holdings under the scheme, for detailed portfolio visit www.utimf.com Act. Wt % - Active Weight % (as compared to the Benchmark Index – Nifty 500 TRI) Data as of June 30, 2022 Small Cap Holdings STOCK NAME SECTOR % to NAV AJANTA PHARMA LTD. HEALTHCARE 1.53 KEC INTERNATIONAL LTD. CAPITAL GOODS 1.49 BRIGADE ENTERPRISES LTD. REALTY 1.28 CESC LTD. POWER 1.18 ERIS LIFESCIENCES LTD HEALTHCARE 0.95 V.I.P. INDUSTRIES LTD. CONSUMER DURABLES 0.93 APOLLO TYRES LTD. AUTO & AUTO COMPONENTS 0.92 SYMPHONY LTD. CONSUMER DURABLES 0.92 MULTI CMDITY EXCH OF INDIA FINANCIAL SERVICES 0.76 TEAMLEASE SERVICES LTD. . SERVICES 0.63 CANFIN HOMES LTD. FINANCIAL SERVICES 0.63 G R INFRAPROJECTS LTD CONSTRUCTION 0.60 CHALET HOTELS LTD CONSUMER SERVICES 0.54 HERITAGE FOODS LTD. FMCG 0.44 CAMS FINANCIAL SERVICES 0.28 TIMKEN INDIA LTD. CAPITAL GOODS 0.03 16
- 17. Information Classification: UTI AMC - Confidential Information Classification: UTI AMC - Confidential Portfolio Snapshot Sectoral Breakdown (%) (As compared to Benchmark) Data as of June 30, 2022. Active Weight as compared to the Benchmark Index – Nifty 500 TRI 17 Active Stock Position (As compared to Benchmark) Overweight (Top 5) Underweight (Top 5) STOCK NAME SECTOR % to NAV Act. Wt % HDFC BANK LIMITED FINANCIAL SERVICES 9.46 3.76 ICICI BANK LTD FINANCIAL SERVICES 7.83 3.09 BHARTI AIRTEL LTD. TELECOMMUNICATION 4.53 2.93 AXIS BANK LTD. FINANCIAL SERVICES 4.21 2.59 INFOSYS LTD. IT 7.49 2.33 STOCK NAME SECTOR % to NAV Act. Wt % RELIANCE INDUSTRIES LTD. OIL, GAS & CONSUMABLE FUELS - 8.63 TCS LTD. IT - 3.26 HDFC LTD. FINANCIAL SERVICES 0.90 2.89 KOTAK MAHINDRA BANK FINANCIAL SERVICES - 2.35 HINDUSTAN UNILEVER LTD FMCG - 1.92 Active Weight 0.00 0.00 0.60 0.63 1.18 1.46 1.73 2.24 2.52 3.52 4.17 4.27 4.68 5.02 5.88 8.51 9.32 10.06 32.70 -0.10 -0.45 -1.45 -0.64 -2.12 -1.24 -10.03 0.09 -0.50 2.73 2.04 0.54 2.57 -2.78 2.58 2.87 3.98 -2.46 3.39 0 10 20 30 40 50 60 70 DIVERSIFIED TEXTILES CONSTRUCTION SERVICES POWER CHEMICALS OIL, GAS & CONSUMABLE FUELS CONSTRUCTION MATERIALS METALS & MINING REALTY CONSUMER SERVICES CONSUMER DURABLES TELECOMMUNICATION FMCG CAPITAL GOODS AUTO & AUTO COMPONENTS HEALTHCARE INFORMATION TECHNOLOGY FINANCIAL SERVICES UTI - Value Opportunities Fund
- 18. Information Classification: UTI AMC - Confidential Information Classification: UTI AMC - Confidential Portfolio Commentary Financial Services: The Fund has overweight exposure in the sector along with large active weights across large well-capitalized banks, as the sector undergoes consolidation of market share in favor of limited well-run banks. Loan growth is likely to revive with pick-up in nominal GDP as well as working capital led demand from the corporate sector. Sector is well placed to participate in the cyclical recovery on account of reasonable valuations. Large banks have high capital adequacy, healthy provisioning, and a strong liability franchise. Non lending exposure is across insurance, exchanges, market intermediaries with high RoEs and long runway for growth. Consumer Goods: Relative valuation of staple space has moderated opening a window of opportunity also as FCF yields corrected to reasonable levels reduced underweight position in the sector. Commodity linked margin pressure are likely to abate going forward. Remain underweight in FMCG space on account of high implied growth. The Fund prefers companies in the discretionary space with long runway of growth over staple companies where there are high embedded growth expectations. Automobile: The sector has been under pressure with growth tapering down over the last few years with PV most impacted; however, the sector is poised for cyclical uptick in volume growth also has valuation comfort. Replacement demand as well as preference for personal mobility would be a tailwind going forward. OEMs are largely cash rich with decent balance sheet, hence have ability to survive ongoing pressure. Pharma: The Fund has maintained large overweight position in Pharma, valuations are now broadly in-line with long-term averages. The Fund continues to remain positive on growth and profitability in the domestic market and focus will shift to growth in US market from new product launches in specialty segment. 18 BFSI – Banking, Financial Services & Insurance; RoE – Return on Equity; PV – Passenger Vehicle; OEM – Original Equipment Manufacturer; OMC – Oil Marketing Company; FCF – Free Cash Flow; GRM – Gross Refining Margin; M&A: Merger & Acquisition IT: Sector was trading at decadal high valuations post run-up in late 2021, the Fund had reduced exposure largely on account of valuation as captured by implied growth, which moved into significant premium to last decade delivered growth. The Fund remain positive on business dynamics given its resilient business model, decent deal flow, healthy cash flow profile and high FCF yields. The Fund continue its underweight stance in the sector on account of expensive valuations Energy: The Fund has underweight position in the sector. However, within the sector, there is marginal overweight position in Gas & Power utility. Elevated refinery margin this quarter are largely one offs in nature. Construction: The Fund remained positive in broader construction segment as it expects revival in real estate driven by low interest rates and fiscal relief by state governments. Residential real estate sale velocity as well as pricing should inch-up while leverage is limited, and cycle seems to have bottomed-out. The Fund prefers domestic construction over domestic capital goods in the overall capex theme. Cement: Sector has gone through turbulence on account of high input cost pressure, lack of pricing power and entry of one of the largest corporate houses through M&A, as a result valuation have corrected meaningfully. The Fund has utilised this correction to add exposure to into the sector through a mid-cap name with improved balance sheet. Metals: Exposure to this sector was underweight during last 2 years, while last 2 years were used by players to improve balance sheet and reduce leverage. Recent commodity price correction and export tax on steel has led to sharp correction in valuations which has created opportunity. The Fund has added to existing exposure in steel as well as added new name in non-ferrous segment with large part of earning from relatively stable conversion business.
- 19. Information Classification: UTI AMC - Confidential Information Classification: UTI AMC - Confidential Rolling Return Analysis 19 Rolling Returns with daily frequency of UTI Value Opportunities Fund at difference time frame as mentioned above. CAGR – Compounded Annual Growth Rate. Data period: June 30, 2007 to June 30, 2022. Different plans have a different expense structure. The performance details provided herein are of regular plan. Past performance may or may not be sustained in future. Rolling Returns of UTI Value Opportunities Fund – 15 Years Probability of -ve Returns Over 8% 22.3% 1.5% 0.7% 0.0% 60.5% 75.6% 83.7% 96.8% Median Rolling Returns (CAGR) -51% -6% -3% 6% 115% 37% 26% 18% -70% -50% -30% -10% 10% 30% 50% 70% 90% 110% 1 Year 3 Years 5 Years 10 Years Lowest Highest Median 12% 12% 13% 13%
- 20. Information Classification: UTI AMC - Confidential Information Classification: UTI AMC - Confidential B - Benchmark, AB - Additional Benchmark, TRI - Total Return Index Past performance may or may not be sustained in future. Different plans shall have a different expense structure. The performance details provided herein are of regular plan (growth option). Returns greater than 1 year period are Compound Annual Growth Rate (CAGR). Inception of UTI Value Opportunities Fund: May 20, 2005. Date of allotment in the scheme/plan has been considered for inception date. The Scheme is currently managed by Mr. Amit Premchandani since Feb-2018. Period for which scheme’s performance has been provided is computed basis last day of the month-end preceding the date of advertisement. In case, the start/end date of the concerned period is a non-business day, the NAV of the previous date is considered for computation of returns. When scheme/additional benchmark returns are not available, they have been shown as N/A. Performance Track Record UTI Value Opportunities Fund Performance Vs Benchmark as of 30/06/2022 Period Fund Performance Vs Benchmark Growth of ` 10,000/- Scheme Returns (%) B: Nifty 500 TRI (%) AB: Nifty 50 TRI (%) Scheme Returns (`) B: Nifty 500 TRI (`) AB: Nifty 50 TRI (`) 1 Year -1.90 0.56 1.66 9,810 10,056 10,166 3 Years 13.44 12.79 11.57 14,603 14,353 13,892 5 Years 11.15 11.23 12.03 16,970 17,031 17,652 Since Inception 13.80 13.27 13.60 89,528 82,715 86,897 20 #Risk-o-meter for the fund is based on the portfolio ending June 30, 2022. The Risk-o-meter of the fund/s is/are evaluated on monthly basis and any changes to Risk-o-meter are disclosed vide addendum on monthly basis, to view the latest addendum on Risk-o-meter, please visit addenda section on https://utimf.com/forms-and-downloads/ Fund – UTI Value Opportunities Fund Benchmark – Nifty 500 TRI This product is suitable for investors who are seeking*: • Long term capital appreciation • Investment in equity instruments following a value investment strategy across the market capitalization spectrum * Investors should consult their financial advisers if in doubt about whether the product is suitable for them
- 21. Information Classification: UTI AMC - Confidential Information Classification: UTI AMC - Confidential Performance Track Record (contd.) 21 SIP Performance of UTI Value Opportunities Fund Vs Benchmark as of 30/06/2022 Period Investment Amount Fund Performance Vs Benchmark Growth of ` 10,000/- Scheme Returns (%) B: Nifty 500 TRI (%) AB: Nifty 50 TRI (%) Scheme Returns (`) B: Nifty 500 TRI (`) AB: Nifty 50 TRI (`) 1 Year 1,20,000 -15.34 -13.79 -11.77 1,09,884 1,10,927 1,12,286 3 Years 3,60,000 14.39 15.33 14.03 4,45,569 4,51,625 4,43,324 5 Years 6,00,000 12.06 12.34 12.25 8,11,821 8,17,407 8,15,646 7 Years 8,40,000 11.51 12.42 12.44 12,65,265 13,06,760 13,07,687 10 Years 12,00,000 11.37 12.80 12.29 21,65,911 23,36,949 22,74,618 15 Years 18,00,000 12.08 12.11 11.70 47,93,604 48,06,203 46,38,119 Since Inception 20,30,000 12.32 12.00 11.73 63,70,291 61,70,160 60,11,090 Note: Systematic Investment Plan (SIP) returns are worked out assuming investment of Rs. 10,000/- every month at NAV per unit of the scheme as on the first working day for the respective time periods. The loads have not been taken into account. *Since inception for above mentioned schemes is taken for the period December 2004 to June 2022 (Since SIP facility was introduced in November 2004.Past performance may or may not be sustained in future. Performance of other open-ended schemes managed by the Fund Manager Mr. Amit Premchandani Scheme Inception Date Managing the Fund Since Benchmark 1 Year (%) 3 Years (%) 5 Years (%) Fund Benchmark Fund Benchmark Fund Benchmark UTI Banking and Financial Services Fund 07-Apr-04 Jun-14 Nifty Financial Services TRI -7.50 -5.12 -0.08 5.13 2.45 10.93 UTI Regular Savings Fund 16-Dec-03 Dec-14 Nifty 50 Hybrid Composite Debt 15:85 Index 5.23 1.50 7.38 7.73 6.18 7.58 a. Mr. Amit Premchandani manages 3 open-ended schemes of UTI Mutual Fund. He manages the equity portion of UTI Regular Savings Fund b. Period for which scheme’s performance has been provided is computed basis last day of the month-end preceding the date of advertisement. c. Different plans shall have a different expense structure. The performance details provided herein are of Growth Option (Regular Plan). d. Date of allotment in the scheme/plan has been considered for inception date. e. All data as of 30 June, 2022.
- 22. Information Classification: UTI AMC - Confidential Information Classification: UTI AMC - Confidential Why Invest in UTI Value Opportunities Fund? The Fund looks to take aggressive sector positions, based on valuation considerations and on medium term growth prospects The fund has the flexibility to operate across the market cap spectrum following the “Value” style of investment. While the portfolio will have a large cap bias the midcap exposure could vary more widely based on valuation differentials A high-conviction portfolio which is evident from its high active share at the portfolio level as well as its active weight position at stock level Suitable for: Investors who would like to build on their core portfolio holding Investors looking for reasonable outperformance over plain vanilla equity funds over medium to long term 22
- 23. Information Classification: UTI AMC - Confidential Information Classification: UTI AMC - Confidential Name of the Scheme This product is suitable for investors who are seeking* Riskometer UTI Mastershare Unit Scheme (Large Cap Fund- An open ended equity scheme predominantly investing in large cap stocks) • Long term capital appreciation • Investment predominantly in equity instruments of large cap companies UTI Core Equity Fund (Large & Mid Cap Fund- An open ended equity scheme investing in both large cap and mid cap stocks) • Long term capital appreciation • Investment predominantly in equity instruments of both large cap and mid cap companies UTI Mid Cap Fund (Mid Cap Fund- An open ended equity scheme predominantly investing in mid cap stocks) • Long term capital appreciation • Investment predominantly in mid cap companies UTI Value Opportunities Fund (An open ended equity scheme following a value investment strategy) • Long term capital appreciation • Investment in equity instruments following a value investment strategy across the market capitalization spectrum UTI Flexi Cap Fund (Flexi Cap Fund- An open ended dynamic equity scheme investing across large cap, mid cap, small cap stocks) • Long term capital appreciation • Investment in equity instruments of companies with good growth prospects across the market capitalization spectrum UTI Small Cap Fund Small Cap Fund - An open ended equity scheme predominantly investing in small cap stocks • Long term capital appreciation • Investment predominantly in equity and equity related securities of small cap companies UTI Dividend Yield Fund (An open ended equity scheme predominantly investing in dividend yielding stocks) • Long term capital appreciation • Investment predominantly in dividend yielding equity and equity related securities UTI Focused Equity Fund (Focused Fund- An open ended equity scheme investing in maximum 30 stocks across market caps) • Long term capital growth • Investment in equity and equity related securities across market capitalisation in maximum 30 stocks *Investors should consult their financial advisers if in doubt about whether the product is suitable for them. Product Label #Risk-o-meter for the fund is based on the portfolio ending June 30, 2022. The Risk-o-meter of the fund/s is/are evaluated on monthly basis and any changes to Risk-o-meter are disclosed vide addendum on monthly basis, to view the latest addendum on Risk-o-meter, please visit addenda section on https://utimf.com/forms-and-downloads/
- 24. Information Classification: UTI AMC - Confidential Information Classification: UTI AMC - Confidential Name of the Scheme This product is suitable for investors who are seeking* Riskometer UTI Infrastructure Fund (An open ended equity scheme following the Infrastructure theme) • Long term capital appreciation • Investment predominantly in equity and equity related securities of companies forming part of the infrastructure sector UTI MNC Fund (An open ended equity following the theme of investing predominantly in equity and equity related securities of Multi-National Companies) • Long term capital appreciation • Investment predominantly in equity and equity related securities of Multi-National companies UTI India Consumer Fund (An open ended equity scheme following the theme of changing consumer aspirations, changing lifestyle and growth of consumption) • Long term capital growth • Investment in equity instruments of companies that are expected to benefit from of the changing consumer aspirations, changing lifestyle and growth of consumption UTI Banking and Financial Services Fund (An open ended equity scheme investing in Banking and Financial Services Sector) • Long term capital appreciation • Investment predominantly in equity and equity related securities of companies engaged in banking and financial services activities. UTI Healthcare Fund (An open ended equity scheme investing in the Healthcare Services Sector) • Long term capital appreciation • Investment predominantly in equity and equity related securities in the Healthcare Services sector. UTI Transportation and Logistics Fund (An open ended equity scheme investing in transportation and logistics sector) • Long term capital appreciation • Investment predominantly in equity and equity related securities of the companies engaged in the transportation and logistics sector UTI Long Term Equity Fund (Tax Saving) (An open ended equity linked saving scheme with a statutory lock in of 3 years and tax benefit) • Long term capital growth • Investment in equity instruments of companies that are believed to have growth potential Product Label *Investors should consult their financial advisers if in doubt about whether the product is suitable for them. #Risk-o-meter for the fund is based on the portfolio ending June 30, 2022. The Risk-o-meter of the fund/s is/are evaluated on monthly basis and any changes to Risk-o-meter are disclosed vide addendum on monthly basis, to view the latest addendum on Risk-o-meter, please visit addenda section on https://utimf.com/forms-and-downloads/
- 25. Information Classification: UTI AMC - Confidential Information Classification: UTI AMC - Confidential Name of the Scheme This product is suitable for investors who are seeking* Benchmark Riskometer# UTI Children’s Career Fund – Savings Plan (An open ended fund for investment for children having a lock-in for at least 5 years or till the child attains age of majority (whichever is earlier)) • Long term capital appreciation • Investment in equity instruments (maximum-40%) and debt instruments CRISIL Short Term Debt Hybrid 60+40 Fund Index UTI Children’s Career Fund – Investment Plan (An open ended fund for investment for children having a lock-in for at least 5 years or till the child attains age of majority (whichever is earlier)) • Long term capital appreciation • Investment in equity instruments (above 70%) and debt instruments Nifty 500 TRI Index UTI Retirement Benefit Pension Fund (An open ended retirement solution oriented scheme having a lock-in of 5 years or till retirement age (whichever is earlier) • Long term capital appreciation • Investment in equity instruments (maximum - 40%) and debt/money market instruments CRISIL Short Term Debt Hybrid 60+40 Fund Index UTI Arbitrage Fund (An open ended scheme investing in arbitrage opportunities) • Capital appreciation over medium to long term • Takes advantage of arbitrage opportunities in cash and derivative market without taking any directional/ unhedged position in either equity or derivative instruments Nifty 50 Arbitrage Index Product Label 25 *Investors should consult their financial advisers if in doubt about whether the product is suitable for them. #Risk-o-meter for the fund is based on the portfolio ending June 30, 2022. The Risk-o-meter of the fund/s is/are evaluated on monthly basis and any changes to Risk-o- meter are disclosed vide addendum on monthly basis, to view the latest addendum on Risk-o-meter, please visit addenda section on https://utimf.com/forms-and- downloads/
- 26. Information Classification: UTI AMC - Confidential Information Classification: UTI AMC - Confidential Thank You The information contained in this document is for general purposes only and is not an offer to sell or a solicitation to buy/ sell any mutual fund units / securities. The information / data here in alone are not sufficient and should not be used for the development or implementation of an investment strategy. The same should not be construed as investment advice to any party. REGISTERED OFFICE: UTI Tower, ‘Gn’ Block, Bandra Kurla Complex, Bandra (E), Mumbai - 400051. Phone: 022 – 66786666. UTI Asset Management Company Ltd (Investment Manager for UTI Mutual Fund) Email: invest@uti.co.in . (CIN-L65991MH2002PLC137867). For more information, please contact the nearest UTI Financial Centre or your AMFI/NISM certified UTI Mutual Fund Distributor (MFD) for a copy of the Statement of Additional Information, Scheme Information Document and Key Information Memorandum cum Application Form. Disclaimers: The information on this document is provided for information purposes only. It does not constitute any offer, recommendation or solicitation to any person to enter into any transaction or adopt any hedging, trading or investment strategy, nor does it constitute any prediction of likely future movements in rates or prices or any representation that any such future movements will not exceed those shown in any illustration. Users of this document should seek advice regarding the appropriateness of investing in any securities, financial instruments or investment strategies referred to on this document and should understand that statements regarding future prospects may not be realized. The recipient of this material is solely responsible for any action taken based on this material. Opinions, projections and estimates are subject to change without notice. UTI AMC Ltd is not an investment adviser, and is not purporting to provide you with investment, legal or tax advice. UTI AMC Ltd or UTI Mutual Fund (acting through UTI Trustee Company Pvt. Ltd) accepts no liability and will not be liable for any loss or damage arising directly or indirectly (including special, incidental or consequential loss or damage) from your use of this document, howsoever arising, and including any loss, damage or expense arising from, but not limited to, any defect, error, imperfection, fault, mistake or inaccuracy with this document, its contents or associated services, or due to any unavailability of the document or any part thereof or any contents or associated services. Mutual Fund Investments are subject to market risks, read all scheme related documents carefully.