Download to read offline


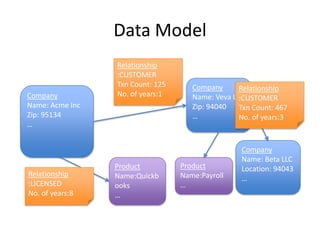

![Usecase - Vendor Recommendation
START n=node(23539)
MATCH
n-[:PAYS]-v-[:PAYS]-vov
WHERE
has(vov.IC4_DESC)
AND vov.IC4_DESC =~ 'Legal.*'
AND not (ID(vov) = ID(v))
RETURN
ID(vov),vov.ENTITY_TYPE,vov.CITY?,vov.IC4_DESC?
ORDER BY vov.loyalty;](https://image.slidesharecdn.com/neo4j-gokuldaspillai-121018170144-phpapp01-130507133638-phpapp02/85/Neo4j-gokuldaspillai-121018170144-phpapp01-16-320.jpg)
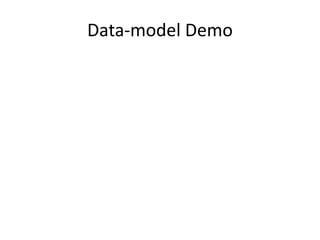
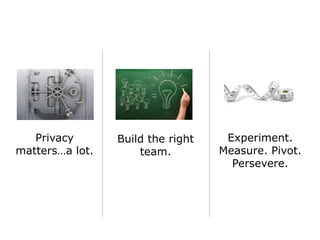
![Neo4j for real-time graph applications
18
Cypher Query Language
START biz = node(100) MATCH biz–
[TRANSACTS]- x RETURN x
Great for… Opportunity
Areas…
Real time
Cypher
Built-in Algos
Lucene search
Horizontal
scaling
Access control
Indexing](https://image.slidesharecdn.com/neo4j-gokuldaspillai-121018170144-phpapp01-130507133638-phpapp02/85/Neo4j-gokuldaspillai-121018170144-phpapp01-18-320.jpg)


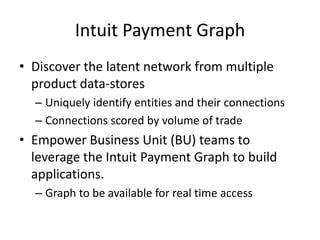
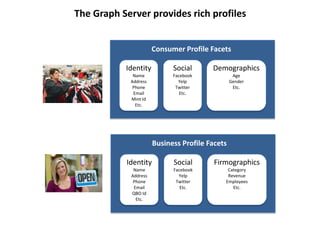
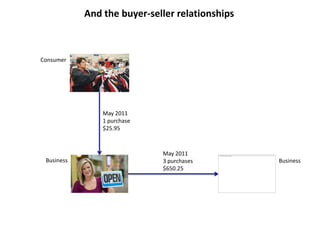
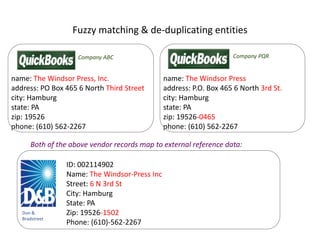
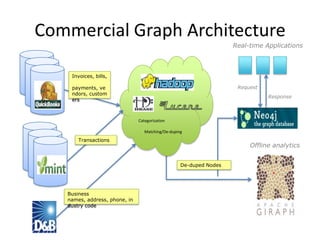
This document summarizes Intuit's commercial graph, which connects data across Intuit products to uniquely identify entities and their relationships. It describes how the graph connects 1 in 3 tax returns and 1 in 12 Americans, representing $2.6 trillion in transactions. The graph provides rich profiles of consumers and businesses, along with their buyer-seller relationships. It discusses the graph's architecture, data model, scale of over 29 million nodes and 315 million properties, and uses cases for recommendations.