1. University
of Piraeus
SPOUDAI
Journal of Economics and Business
Σπουδαί
http://spoudai.unipi.gr
The Impact of Stock Market Development on Unemployment:
Empirical Evidence from South Africa
Sheilla Nyashaa
, Nicholas M. Odhiambob
, Mercy T. Musakwac
a
Department of Economics, University of South Africa, Pretoria
South Africa. Email: sheillanyasha@gmail.com
b
Department of Economics, University of South Africa, Pretoria
South Africa. Email: odhianm@unisa.ac.za / nmbaya99@yahoo.com
c
Department of Economics, University of South Africa, Pretoria
South Africa. Email: tsile.musa@gmail.com
Abstract
In this paper, the impact of stock market development on unemployment in South Africa has been
empirically examined using time-series data from 1980 to 2019. The study was motivated by the high
level of structural unemployment facing the country, on the one hand, and a well-developed stock
market, which compares favourably with those in advanced economies, on the other hand. The study
aims to add value to the finance-unemployment literature by using a range of stock market
development proxies, namely stock market capitalisation, the total value of stocks traded, and the
turnover ratio. Based on the autoregressive distributed lag (ARDL) bounds testing approach, the
results of the study revealed that in South Africa, stock market development has a negative impact on
unemployment. These results were found to hold, irrespective of the stock market development proxy
used and whether the analysis was conducted in the long run or in the short run. Based on these
results, it can be concluded that the stock market unambiguously promotes job creation in South
Africa. The study, therefore, recommends that policymakers should continue with the implementation
of policies aimed at promoting stock market development in order to create more jobs, while at the
same time ensuring that other structural challenges facing the labour market are also addressed.
JEL Classification Code: G1, E24.
Keywords: Financial development; stock market development; market-based financial
development; unemployment; South Africa, ARDL
1. Introduction
For some time now, South Africa has been battling with the triple challenge of inequality,
poverty and unemployment (the South African Government “SAG”, 2019; Xesibe and
Nyasha, 2020). Many economists and policy analysts alike thought that the silver bullet to
cure these ills lay in boosting economic growth, leading to numerous studies being conducted
on the impact of various variables on economic growth in South Africa (see, among other
92
SPOUDAI Journal of Economics and Business, Vol. 71 (2021), Issue 1-2, pp. 92-110
2. studies, Nyasha and Odhiambo, 2020, 2015a; Nyasha et al., 2020; Xesibe and Nyasha, 2020).
Despite the overflow of such studies, the triple threat still hounds South Africa, raising the
necessity for studies investigating ways of directly fighting against inequality, poverty and
unemployment (see Magombeyi and Odhiambo, 2018, among others).
According to the SAG (2019) and Banda et al. (2016), unemployment is considered to be one
of the significant contributors to widespread levels of inequality and poverty in South Africa.
As such, the South African Government has sought not only to grow the South African
economy, but also to explicitly focus on transforming the economy, necessitated by the
country’s deep inequalities and stubborn unemployment (SAG, 2019).
Several decades of academic research highlight the benefits of well-developed financial
markets for economic growth (see, for instance, Levine, 1997, 2005; Nyasha and Odhiambo,
2014, 2015a, 2015b; Rajan and Zingales, 1998). Earlier literature not only stressed the
importance of well-developed financial markets for the real economy, but it also provided
empirical evidence of the different transmission channels, favouring market-based finance
over bank credit (Acemoglu et al. 2006; Levine and Zervos 1998). Given this established
power of financial markets to overturn real-sector misfortunes in an economy, on the one
hand, and the high levels of stock market development in South Africa, on the other hand, it
is prudent that the finance–unemployment nexus be put to empirical test.
Over the years, South Africa has invested in the reform and development of its stock market,
which is currently one of the top bourses in Africa, favourably comparable to the top world
bourses (see Asongu, 2015; Nyasha & Odhiambo, 2015c). The financial sector of the country
is also well regulated – evidenced by the minimal impact of the 2007/2008 global financial
crisis on the South African financial sector (Marrs, 2013; the South African Government
Information, 2009).
Despite the overwhelming evidence on how highly developed South Africa’s financial
system is, to our knowledge, no study has fully explored the possible benefits such a financial
system may have on unemployment levels in South Africa. This is the current gap in the
literature this study aims to bridge. The outcome of the research is expected to offer policy
guidance relating to the finance-unemployment nexus in South Africa. Looking beyond South
Africa, the impact of financial development on unemployment appears to also be an under
researched area. Only a few studies have put the finance–unemployment nexus to the test
(Aliero et al., 2013; Darrat et al., 2005; Ernst, 2019), pointing to the gaps in knowledge this
study aims to cover.
Against this backdrop, the objective of this study is to empirically investigate the impact of
stock market development on unemployment in South Africa using the ARDL bounds testing
approach.
The closest research to our study is based on the work done by Aliero et al. (2013) for the
case of Nigeria. However, as opposed to Aliero et al. (2013), which mainly focused on bank-
based financial development, our paper focuses on stock market development. In addition, in
the current study, three proxies of stock market development are used, namely stock market
capitalisation, total value of stock traded and turnover ratio, thereby leading to a system of
three multivariate equations. To our knowledge, this study may be the first of its kind to
explore in detail the finance–unemployment nexus in South Africa using three different
proxies of stock market development. The outcome of this study is expected to contribute
significantly to policy options towards diffusing the triple-threat challenge facing South
Africa, namely inequality, poverty and unemployment. The results of this study are also
93
S. Nyasha, N. M. Odhiambo, M. T. Musakwa, SPOUDAI Journal, Vol. 71 (2021), Issue 1-2, pp. 92-110
3. expected to contribute immensely towards the opening up of the finance–unemployment
nexus debate nationally and beyond.
The rest of the paper is organised as follows: In Section 2, finance-unemployment dynamics
in South Africa are discussed. In Section 3, the literature on the finance-unemployment nexus
is reviewed. Section 4 is aimed at presenting the methodology employed to examine the
impact of stock market development on unemployment in the country under study, as well as
discussing the results. In Section 5, the study is concluded.
2. Stock Market and Unemployment Dynamics in South Africa
In South Africa trading in stocks dates back to as early as the 1880s, following the discovery
of gold on the Witwatersrand in 1886, which led to many mining and financial companies
opening – and a need soon arose for a stock exchange (JSE, 2020; Nyasha and Odhiambo,
2015c). The JSE provides a market where securities can be traded freely under a regulated
procedure. It does not only channel funds into the economy, but it also provides investors
with returns on investments in the form of dividends. Thus, the exchange successfully fulfils
its main function – the raising of primary capital – by rechannelling cash resources into
productive economic activity, thus building the economy, while simultaneously enhancing
job opportunities and wealth creation (Nyasha and Odhiambo, 2015c).
To keep pace with the global economy, the South African stock market had to undergo an
extensive reform process, which saw the transformation of the stock market into the great
African bourse it is today. According to Nyasha and Odhiambo (2015c), the reforms began in
earnest in the 1990s. Among these reforms have been the restructuring of the financial
market, and the replacement of the traditional trading systems by full electronic trading
systems. Overall, the South Africa stock market has responded positively to the various stock
market initiatives implemented over the years.
South Africa’s stock market responded positively to most of the reforms implemented since
the 1990s, and has been experiencing growth over the years. It has over 400 listed companies
(JSE, 2020). The growth of South Africa’s stock market can also be explained using stock
market capitalisation of listed companies, the total value of stocks traded, and the turnover
ratio of stocks traded. Market capitalisation ratio usually equals the value of listed shares
divided by the gross domestic product (GDP) and analysts frequently use the ratio as a
measure of stock market size; while the total value of stocks traded and the turnover ratio of
stocks traded generally measure stock market liquidity – where ‘liquidity’ refers to the ability
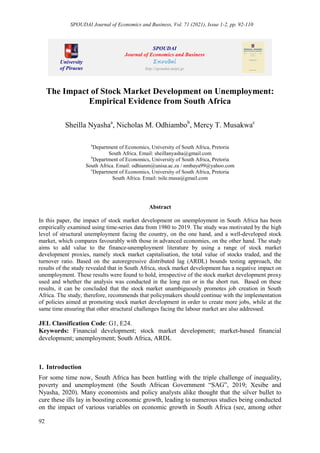
to buy and sell securities easily. Figure 1 summarises trends in stock market development in
South Africa over the period from 1980 to 2019, as measured by stock market capitalisation
of listed domestic companies as a percentage of GDP, the total value of stocks traded as a
percentage of GDP, and the turnover ratio.
As shown in Figure 1, the South African stock market growth, in terms of capitalisation and
liquidity trended upwards in the review period – with the rate of growth more pronounced
from the early 2000s (World Bank, 2020). Although the overall growth in the South Africa
stock market is confirmed, this growth was accompanied by stock market volatility as
evidenced by oscillations – though shallow. Despite the notable progress, challenges still
remain. Some of these include: i) the lack of public awareness; hence, limited public
participation in the stock market; ii) a relatively low liquidity; and iii) a slow economic pace
in South Africa (Nyasha and Odhiambo, 2015c; JSE, 2011; IMF, 2008; Misati, 2006).
94
S. Nyasha, N. M. Odhiambo, M. T. Musakwa, SPOUDAI Journal, Vol. 71 (2021), Issue 1-2, pp. 92-110
4. Figure 1: The Growth Trends in the South African Stock Market (1980 – 2019)
Source: World Bank, 2020
From the unemployment front, it can be observed that since the global financial crisis of
2007/8, South Africa’s economic growth has not yet recovered. It saw its GDP growth rate
tumble from over 5% per annum in 2007 to -1.5% in 2009. Since then, the highest GDP
growth rate recorded by South Africa was 3.3% in 2011; and the trend has been a downward
one, reaching as low as 0.4% in 2016, and 0.2% in 2019 (World Bank, 2020). A number of
macroeconomic fundamentals have received their fair share of the blame for this dismal
economic performance. Among the most blamed ones is unemployment, which has soared
over the years, from an unemployment rate of 22.5% in 2008, to 28.7% in 2019 –
representing a 6.2 percentage point increase (IMF, 2020).
Even in recent quarters, unemployment has continued soaring. The concoction of decreased
quarter-on-quarter employment, increased unemployment, increased labour force
participation rate, and decreased labour absorption left South Africa’s unemployment rate
with no option but to shoot up. While the formal unemployment rate increased to 30.1% in
the first quarter of 2020, from 29.1% in the previous quarter, the expanded unemployment
rate increased to 39.7%, from 38.7% over the same period (Statistics South Africa, 2020).
It has been widely acknowledged that unemployment has proven to be a persistent challenge
facing South Africa. Since the dawn of the post-apartheid era, a number of policies have been
implemented at a national level – ranging from the Reconstruction and Development
Programme (RDP); Growth, Employment and Redistribution (GEAR); and Accelerated and
Shared Growth Initiative for South Africa (ASGISA), to the New Growth Path (NGP); and
the more recent National Development Plan (NDP) (SAG, 2019). In recent years, as the fight
against unemployment intensifies, a number of employment creation incentives and
initiatives were also implemented, championed by various national departments. Despite the
implementation of these policies, incentives and initiatives, unemployment has remained
stubbornly high, and the trend has not yet been broken (SAG, 2019).
The New Dawn, as the current presidency is also known, has ushered in another dose of
employment-targeted national drives, with the Job Summit and investment as the most
prominent ones. A number of initiatives to create more jobs were implemented country-wide.
0
50
100
150
200
250
300
350
400
1980
1982
1984
1986
1988
1990
1992
1994
1996
1998
2000
2002
2004
2006
2008
2010
2012
2014
2016
2018
Per
cent
Stock market capitalisation
Total value of stocks traded
Turnover ratio
95
S. Nyasha, N. M. Odhiambo, M. T. Musakwa, SPOUDAI Journal, Vol. 71 (2021), Issue 1-2, pp. 92-110
5. Although the unemployment situation has not improved significantly over the review period,
these incentives and programmes managed to ease the rate at which unemployment was
increasing. The economic and social implications of such persistently high unemployment
levels in South Africa include: loss of income by individuals; depressed demand; depressed
production; capacity under-utilisation; reduced exports; loss of government revenue; service
delivery deterioration; investment loss; future loss of income; economic growth slip, social
instability; violence; crime; and further spiralling unemployment (SAG, 2019). Figure 2
presents the trends in unemployment in the study country, as measured by the official rate of
unemployment.
Figure 2: Unemployment Rate in South Africa (1980 - 2019)
Source: IMF, 2020
As attested to by Figure 2, unemployment in South Africa has been on a rising path over the
review period. Only between 2003 and 2008 did the unemployment rate significantly fall
from 27.7% to 22.5%, respectively, before resuming its ascent for the remainder of the period
(IMF, 2020).
Figure 3 attempts to interrogate the dynamics of stock market development and
unemployment trends in South Africa over the review period.
From 1980 to 2019, as reflected in Figure 3, trends in both stock market development and
unemployment have been on an upward trajectory, in the main. However, between 1995 and
2007, the trends in unemployment and stock market development, as proxied by stock market
capitalisation, exhibited a seemingly inverse relationship – where unemployment increases
with a decrease in stock market capitalisation, and vice versa (IMF, 2020; World Bank,
2020).
0
5
10
15
20
25
30
35
1980
1982
1984
1986
1988
1990
1992
1994
1996
1998
2000
2002
2004
2006
2008
2010
2012
2014
2016
2018
Per
cent
96
S. Nyasha, N. M. Odhiambo, M. T. Musakwa, SPOUDAI Journal, Vol. 71 (2021), Issue 1-2, pp. 92-110
6. Figure 3: Stock Market Development and Unemployment Trends in South Africa
(1980 - 2019)
Source: World Bank, 2020; IMF, 2020
2. Literature Review
The nexus between financial development and unemployment is an area currently little
explored. Studies that have empirically examined the impact of financial development, in
general, and stock market development, in particular, on unemployment are scant. Rather, a
significant portion of these studies is on the stability rather than pure development of the
financial system on labour dynamics.
The relevant empirical literature on the impact of financial development on unemployment
can be organised into three strata. The first stratum consists of studies that found a negative
association between the two macroeconomic variables. These studies include those conducted
by Epstein and Shapiro (2018) on developing and emerging economies; Kanberoğlu (2014)
when investigating the relationship between unemployment and major indicators of financial
development in Turkey during the 1985-2010 period; Shabbir et al. (2012) on Pakistan, both
in the short run, as well as in the long run when financial development is proxied by financial
sector activities, and by Darrat et al. (2005) in their finance-unemployment study in the
United Arab Emirates, but only in the long run.
The second group mainly consists of studies in which the relationship between the two was
found to be positive. These include a study conducted by Ogbeide et al. (2015) on the
interaction between unemployment and the level of banking sector development in Nigeria
during the 1981-2013 period; Kanberoğlu (2014) when broad money supply was used as a
measure of financial development in an investigation of the relationship between
unemployment and major indicators of financial development in Turkey during the 1985-
2010 period; Shabbir et al. (2012) on Pakistan when financial development was proxied by
M2 minus currency in circulation as a ratio of GDP; and the research conducted by Gatti and
Vaubourg (2009), but only in selected cases when credits provided by financial sector was
used as a proxy of financial development.
The third stratum is for studies in which financial development was found to have an
insignificant impact on unemployment. Such studies include those conducted by Epstein and
0
5
10
15
20
25
30
35
0
50
100
150
200
250
300
350
400
1980
1982
1984
1986
1988
1990
1992
1994
1996
1998
2000
2002
2004
2006
2008
2010
2012
2014
2016
2018
Stock market capitalisation
Total value of stocks traded
Turnover ratio
Unemployment rate
97
S. Nyasha, N. M. Odhiambo, M. T. Musakwa, SPOUDAI Journal, Vol. 71 (2021), Issue 1-2, pp. 92-110
7. Shapiro (2018) on advanced economies; Bayar (2016) on 16 emerging market economies
during the period 2001-2014; Ilo (2015) in the case of Nigeria during the period 1986-2012;
and Darrat et al. (2005) in the case of the United Arab Emirates in the short run.
The studies reviewed so far are mainly based on the direct impact of financial development
on unemployment in various countries and regions under study. There is, however, another
class of empirical literature that alludes to the relationship between financial development
and unemployment – although in an implied manner. These studies still help in shedding
more light on the finance–unemployment nexus. These studies include those conducted by
Berton et al. (2018) who found a negative relationship between financial development and
unemployment in Italy, highlighting the heterogeneous employment effect of financial
shocks; Bentolila et al. (2017), who, after using firm-level data for Spain, found that around
24% of job losses were due to firms being attached to weak banks; Pagano and Pica (2012)
who also confirmed the volatility-enhancing impact of banking crises in a panel of OECD
countries prior to the crisis, indicating that job creation is more tightly linked to falls in
output, particularly during banking-related crises, thereby amplifying the employment impact
of the recession; Han (2009) on the USA, who asserted that financial sector turmoil caused
unemployment; and Caggese and Cunat (2008) who demonstrated that in Italy, financially
constrained firms use temporary employment more than unconstrained ones, amplifying the
employment volatility of shocks.
Based on the empirical literature reviewed, it can be concluded that although each strand has
supporting evidence, it is the strand that supports the negative impact of financial
development on unemployment that appears to predominate, with more evidence than other
strands – irrespective of the methodology used.
4. Methodology and Results
4.1 ARDL Bounds Testing Approach
In this study, the empirical examination of the impact of stock market development on
unemployment in South Africa is based on a superior methodology anchored on the fairly
recently developed autoregressive distributed lag (ARDL) bounds testing approach – as
initially advanced by Pesaran and Shin (1999), and later refined by Pesaran et al. (2001).
Unlike the conventional methodologies based on Johansen (1988), Engle and Granger (1987)
and Johansen and Juselius (1990), this chosen contemporary approach is advantageous from
numerous fronts (see also Odhiambo, 2014; Nyasha and Odhiambo, 2015d). The ARDL
bounds testing approach: does not impose the restrictive assumption that all the variables
under study must be integrated of the same order; normally provides unbiased estimates of
the long-run model and valid t-statistics even when some of the regressors are endogenous
(Odhiambo, 2008; Nyasha and Odhiambo, 2020); employs only a single reduced-form
equation, unlike the conventional cointegration methods that estimate the long-run
relationships within a context of a system of equations (see also Duasa, 2007); has superior
small sample properties, when compared to the other conventional methods of testing
cointegration (Pesaran and Shin, 1999); and is appropriate even when the sample size is
small, unlike other cointegration techniques that are sensitive to the sample size. Hence, the
ARDL approach is considered to be appropriate for analysing the underlying relationship in
this study. Of late, the method has gained traction among researchers.
4.2 Variable Description and Empirical Model Specification
In this study, the dependent variable is unemployment (UE), proxied by unemployment rate,
while the independent variable of interest is stock market development (SMD). Three stock
98
S. Nyasha, N. M. Odhiambo, M. T. Musakwa, SPOUDAI Journal, Vol. 71 (2021), Issue 1-2, pp. 92-110
8. market development proxies have been identified and utilised in this study. These proxies
have been widely used in financial development studies; hence, their market-based financial
development predictive power has stood the test of time (see Levine 1997; 2005; Rajan and
Zingales, 1998; Asongu, 2012; Asongu and Nwachukwu, 2018; Nyasha and Odhiambo,
2018). They are stock market capitalisation (CA), total value of stocks traded (TV), and
turnover ratio (TO).
Seven key determinants of unemployment have also been included in the model. All the
variables utilised in this study, their descriptions, and a priori expectations, are summarised in
Table 1.
Table 1: Variable Description
Symbol Description Measure A priori
expectation
UE Unemployment Unemployment (% of total
labour force)
-
SMD Stock market development CA; TV; and TO Negative
CA Stock market capitalisation Market capitalisation of
listed domestic companies
(% of GDP)
Negative
TV Total value of stock traded Total value of stock traded
(% of GDP)
Negative
TO Turnover ratio Turnover ratio of domestic
shares (%)
Negative
y Economic growth Annual percentage growth
rate of GDP at market
prices.
Negative
FI Foreign direct investment Foreign direct investment
inflows (% of GDP)
Negative
DI Domestic investment Gross fixed capital
formation (% of GDP)
Negative
HC Household final consumption
expenditure
Household final
consumption expenditure
(% of GDP)
Negative
NE National expenditure Gross national expenditure
(% of GDP)
Negative
IN Inflation Consumer prices (annual
%)
Negative
ER Exchange rate Real effective exchange
rate index (2010 = 100)
Negative
99
S. Nyasha, N. M. Odhiambo, M. T. Musakwa, SPOUDAI Journal, Vol. 71 (2021), Issue 1-2, pp. 92-110
9. The annual time-series data from 1980 to 2019 used in this study were all obtained from the
World Bank Economic Indicators (World Bank, 2020) except for unemployment data that
were sourced from the IMF’s world economic outlook database (IMF, 2020).
The ARDL-based empirical model used in this study to examine the impact of the various
proxies of stock market development on unemployment can be expressed as follows:
∆𝑈𝐸𝑡 = 𝛾0 + � 𝛾1𝑖∆𝑈𝐸𝑡−𝑖 +
𝑛
𝑖=1
� 𝛾2𝑖∆𝑆𝑀𝐷𝑡−𝑖 +
𝑛
𝑖=0
� 𝛾3𝑖∆𝑦𝑡−𝑖 +
𝑛
𝑖=0
� 𝛾4𝑖∆𝐹𝐼𝑡−𝑖
𝑛
𝑖=0
+ � 𝛾5𝑖∆𝐷𝐼𝑡−𝑖 +
𝑛
𝑖=0
� 𝛾6𝑖∆𝐻𝐶𝑡−𝑖 +
𝑛
𝑖=0
� 𝛾7𝑖∆𝑁𝐸𝑡−𝑖
𝑛
𝑖=0
+ � 𝛾8𝑖∆𝐼𝑁𝑡−𝑖 +
𝑛
𝑖=0
� 𝛾9𝑖∆𝐸𝑅𝑡−𝑖 +
𝑛
𝑖=0
𝛾10𝑈𝐸𝑡−1 + 𝛾11𝑆𝑀𝐷𝑡−1 + 𝛾12𝑦𝑡−1
+ 𝛾13𝐹𝐼𝑡−1 + 𝛾14𝐷𝐼𝑡−1 + 𝛾15𝐻𝐶𝑡−1 + 𝛾16𝑁𝐸𝑡−1 + 𝛾17𝐼𝑁𝑡−1 + 𝛾18𝐸𝑅𝑡−1
+ 𝜇1𝑡
Where:
UE = Unemployment
SMD = Stock market development measured by three proxies, namely i) stock market
capitalisation (CA) – Model 1; ii) total value of stock traded (TV) – Model 2; iii) turnover
ratio (TO) – Model 3; where CA, TV and TO enter the equation one at a time, substituting
SMD
Y= Economic growth
FI = Foreign direct investment
DI = Domestic investment
HC = Household final consumption expenditure
NE = National expenditure
IN = Inflation
ER = Exchange rate
∆ = First difference operator
n = Lag length
μ1t = White noise-error term.
(1)
100
S. Nyasha, N. M. Odhiambo, M. T. Musakwa, SPOUDAI Journal, Vol. 71 (2021), Issue 1-2, pp. 92-110
10. Following the ARDL model specified in equations (1), the associated ARDL-based error-
correction model is specified as follows:
∆𝑈𝐸𝑡 = 𝛾0 + � 𝛾1𝑖∆𝑈𝐸𝑡−𝑖 +
𝑛
𝑖=1
� 𝛾2𝑖∆𝑆𝑀𝐷𝑡−𝑖 +
𝑛
𝑖=0
� 𝛾3𝑖∆𝑦𝑡−𝑖 +
𝑛
𝑖=0
� 𝛾4𝑖∆𝐹𝐼𝑡−𝑖
𝑛
𝑖=0
+ � 𝛾5𝑖∆𝐷𝐼𝑡−𝑖 +
𝑛
𝑖=0
� 𝛾6𝑖∆𝐻𝐶𝑡−𝑖 +
𝑛
𝑖=0
� 𝛾7𝑖∆𝑁𝐸𝑡−𝑖
𝑛
𝑖=0
+ � 𝛾8𝑖∆𝐼𝑁𝑡−𝑖 +
𝑛
𝑖=0
� 𝛾9𝑖∆𝐸𝑅𝑡−𝑖 + 𝜑𝐸𝐶𝑀𝑡−1 +
𝑛
𝑖=0
𝜇𝑡
Where all variables and characters remain as described under Equation 1, ECM is the error
correction term and 𝜑 is the coefficient of the error correction term.
4.3 Results
4.3.1 Results of Unit Root Test
To confirm the appropriateness of the use of the ARDL procedure in this study, all the
variables were tested for stationarity using the Augmented Dickey-Fuller, the Phillips-Perron
and the Dickey-Fuller generalised least squares unit root tests. The results are summarised in
Table 2.
As revealed by the results of the three unit root tests displayed in Table 2, all the variables are
stationary in either levels or after differenced once – thereby validating the use of the ARDL
procedure in empirically examining the finance-unemployment nexus in this study.
(2)
101
S. Nyasha, N. M. Odhiambo, M. T. Musakwa, SPOUDAI Journal, Vol. 71 (2021), Issue 1-2, pp. 92-110
11. Table 2: Results of Unit Root Test
Panel A: Augmented Dickey-Fuller (ADF)
Variable Stationarity of all Variables in Levels Stationarity of all Variables in
First Difference
Without Trend With Trend Without Trend With Trend
UE -2.008 -2.670 -6.674*** -6.726***
CA -2.116711 -5.275*** -8.967*** -8.828***
TV -1.249767 -3.530*** -6.254*** -6.166
TO -1.307734 -3.224* -7.927*** -7.806***
y -4.418*** -4.392*** - -
FI -4.633*** -5.465*** - -
DI -3.171** -2.804 -4.117*** -4.323***
HC -4.847*** -3.593** - -
NE -4.017*** -3.605** - -
IN -1.217 -2.064 -5.810*** -4.428***
ER -1.723 -3.845** -5.501*** -5.532***
Panel B: Phillips-Perron (PP)
Variable Stationarity of all Variables in Levels Stationarity of all Variables in
First Difference
Without Trend With Trend Without Trend With Trend
UE -2.596 -2.391 -8.194*** -9.973***
CA -1.815 -5.254*** -12.026*** -11.784***
TV -1.169 -3.217* -8.089*** -7.979***
TO -1.147 -3.194 -7.834*** -7.719***
y -4.429*** -4.397*** - -
FI -4.017*** -5.477*** - -
DI -2.115 -1.702 -4.101*** -4.150**
HC -4.169*** -3.498** - -
NE -4.167*** -4.190** - -
IR -1.922 -2.107 -6.82*** -7.517***
ER -1.670 -2.267 -5.994*** -7.580***
Panel C: Dickey-Fuller Generalised Least Squares (DF-GLS)
Variable Stationarity of all Variables in Levels Stationarity of all Variables in
First Difference
Without Trend With Trend Without Trend With Trend
UE -0.434 -2.284 -6.738*** -6.850***
CA 0.320 -5.380*** -6.893*** -7.891***
TV -1.015 -3.369** -6.217*** -6.315***
TO -1.183 -3.038* -6.419*** -7.571***
y -3.138*** -3.785*** - -
FI -4.398*** -5.609*** - -
DI -1.627 -2.258 -3.580*** -3.995***
HC -1.122 -1.718 -4.686*** -4.502***
NE -2.820*** -3.712** - -
IR -0.850 -1.973 -4.325*** 4.642***
ER -0.740 -3.682** -4.888*** -5.322***
Note: *, ** and *** denote stationarity at 10%, 5% and 1% significance level
102
S. Nyasha, N. M. Odhiambo, M. T. Musakwa, SPOUDAI Journal, Vol. 71 (2021), Issue 1-2, pp. 92-110
12. 4.3.2 Results of Cointegration Test
The long-run equilibrium relationship between the variables is examined using the ARDL
bounds testing procedure; and the results are displayed in Table 3.
Table 3: Bounds FTtest for Cointegration
Dependent
variable
Function F-statistic Cointegration
status
Model 1 F(UE| CA, y, FI, DI, HC, NE, IN, ER) 5.251*** Cointegrated
Model 2 F(UE| TV, y, FI, DI, HC, NE, IN, ER) 4.163*** Cointegrated
Model 3 F(UE| TO, y, FI, DI, HC, NE, IN, ER) 4.240*** Cointegrated
Asymptotic critical value
Pesaran et al.
(2001), p. 300,
Table CI(iii),
Case III
1% 5% 10%
I(0) I(1) I(0) I(1) I(0) I(1)
2.79 4.10 2.22 3.39 1.95 3.06
Note: ** and *** denotes significance at 5% and 1% levels.
The results confirm the presence of a stable long-run equilibrium relationship between
unemployment and the independent variables, irrespective of the measure of stock market
development under consideration. With the confirmation of cointegration, the study proceeds
to the estimation of both the long-run and the short-run coefficients.
4.3.3 Results of Long-Run and Short-Run Coefficients Estimation
In this study, a combination of Akaike Information Criterion and individually determined
lags were used to determine the optimal lag length per variable per function. These criteria
were favoured over the other criteria because it produced parsimonious models with robust
results. The optimal model selected culminated into ARDL(2,1,0,1,0,0,1,0,0);
ARDL(2,0,0,1,1,0,1,0,2); and ARDL(1,0,0,1,1,0,0,0,0) in the functions where stock market
development was proxied by stock market capitalisation (CA); total value of stocks traded
(TV); and turnover ratio (TO), respectively. The results of the long-run and short-run
coefficient estimations are summarised in Panels A and B in Table 4, respectively.
103
S. Nyasha, N. M. Odhiambo, M. T. Musakwa, SPOUDAI Journal, Vol. 71 (2021), Issue 1-2, pp. 92-110
13. Table 4: The Long-Run and Short-Run Results of the Selected Models
Model 1
(SMD = Stock market
capitalisation)
Model 2
(SMD = Total value of stocks
traded)
Model 3
(SMD = Turnover ratio)
Regressor Coefficient t-ratio Coefficient t-ratio Coefficient t-ratio
Panel A: Long-Run Coefficients; Dependent Variable is UE
CA -0.019** -3.333 - -
TV - - -0.032** -3.488 -
TO - - - -0.112** -3.147
y -0.036** -3.195 -0.051*** -3.268 -0.596*** -3.216
FI -0.056** -3.183 -0.366*** -3.936 -0.624** -2.912
DI -0308** -2.965 -0.765*** -4.702 -0.750* -2.580
HC -0.037* -2.790 -0.621** -2.852 -0.421** -3.048
NE -0.639** -3.084 -0.560** -3.166 -0.141*** -3.558
IN -0.247** -3.186 -5.600*** -4.455 -0.856*** -3.158
ER -0.111*** -3.667 -0.097*** -4.160 -0.134** -2.920
INPT 69.509* 2.526 37.458** 3.966 61.438*** 4.478
Panel B: Short-Run Coefficients; Dependent Variable is ∆UE
∆UE1 0.258*** 3.951 0.848*** 3.738 - -
∆CA -0.072** -3.164 - - - -
∆TV - - -0.052* -2.109 - -
∆TO - - - - -0.140** -3.148
∆y -0.127*** -4.283 -0.220*** -3.235 -0.911* -2.069
∆FI -0.131* -2.251 -0.778* -2.109 -0.825* -2.074
∆DI -0.054* -2.164 -0.428*** -3.251 -0.665 -1.303
∆HC -0.387** -3.174 -0.787*** -3.129 -0.889** -2.988
∆NE 0.331 0.856 -0.339 -0.890 -0.564** -2.317
∆IN -0.498* -2.828 -0.117* -2.724 -0.682** -2.473
∆ER -0.236* -2.221 -0.065* -2.614 -0.156*** -3.384
∆ER1 - - -0.333*** -3.714 - -
ECM (-1) -0.564*** -4.744 -0.640*** -4.071 -0.761*** -4.740
R-Squared 0.985 0.985 0.970
R-Bar-Squared 0.919 0.869 0.730
S.E. of Regression 0.580 0.652 0.937
F-Stat[prob] 3.706[0.000] 6.306[0.000] 5.389[0.002]
Res Sum of Sq 7.032 9.699 3.508
AIC -41.620 -28.502 -41.918
SBC -62.236 -55.082 -68.498
DW statistic 2.241 2.104 2.030
Notes: *, ** and *** denote 10%, 5% and 1% significant levels, respectively; Δ = first-difference operator; dFI1
= dUE1 = UE(-1)-UE(-2); dER1 = ER(-1)-ER(-2).
104
S. Nyasha, N. M. Odhiambo, M. T. Musakwa, SPOUDAI Journal, Vol. 71 (2021), Issue 1-2, pp. 92-110
14. As reported in both panels in Table 4, the impact of stock market development on
unemployment in South Africa has been found to be time- and proxy-invariant. Irrespective
of the stock market development proxy used – stock market capitalisation; total value of
stocks traded; or the turnover ratio – and regardless of whether estimation is in the long run
or in the short run, the results of the study show that stock market development has a negative
and statistically significant impact on unemployment in South Africa. These results are as
expected and are also consistent with previous studies (see Epstein and Shapiro, 2018;
Kanberoğlu, 2014).
The finding of this study implies that stock market development reduces unemployment.
However, the unemployment statistics in the country under study reveal the consistently
stubbornly high unemployment in the country even though its stock market is well developed
and ranks among the most developed stock markets in the world. The problem could emanate
from the structural challenges facing the labour market (SAG, 2019; Statistics South Africa,
2020).
The other results of the study show that, in the short run, unemployment in the previous
period has a positive impact on unemployment in the current period. This is confirmed by the
coefficient of ∆UE1 in Panel B of Table 4, but only when stock market development is
measured in terms of stock market capitalisation and total value of stocks traded.
Furthermore, consistent with the expectations, economic growth, foreign direct investment,
household final consumption expenditure, inflation and exchange rate were found to have a
negative and significant impact on unemployment in South Africa – in the long run and in the
short run – irrespective of the stock market development proxy used.
However, the results of the impact of domestic investment and national expenditure on
unemployment, though negative across all models in the long run, were inconsistent in the
short run. In the short run, domestic investment was found to have a negative and statistically
significant impact on unemployment only when stock market development is proxied by
stock market capitalisation and total value of stocks traded, while it was found to be
statistically insignificant when turnover ratio is considered as a measure of stock market
development. On the same note, national expenditure was found to have a negative impact
when turnover ratio was used to proxy stock market development, while it was found to have
an insignificant impact on unemployment in the other two models.
The coefficient of ECM (-1) is also found to be negative and statistically significant, as
expected, across all measures of stock market development. The regression for the underlying
ARDL model fits well across all the three functions, as indicated by an R-squared of at least
97%.
To check the robustness of the results, four diagnostic tests were carried out – serial
correlation, functional form, normality, and heteroscedasticity – and the results, showing that
the model passes all the diagnostic tests, irrespective of the proxy used for stock market
development, are presented in Table 5.
105
S. Nyasha, N. M. Odhiambo, M. T. Musakwa, SPOUDAI Journal, Vol. 71 (2021), Issue 1-2, pp. 92-110
15. Table 5: Results of Diagnostic Tests
LM Test Statistic Statistic [Probability]
Model 1
SMD = CA
Model 2
SMD = TV
Model 3
SMD = TO
Serial Correlation: CHSQ(1 1.728 [0.189] 0.823 [0.364] 1.647 [0.199]
Functional Form: CHSQ(1) 0.611 [0.434] 0.079 [0.929] 0.004 [0.953]
Normality: CHSQ (2) 0.070 [0.715] 1.521 [0.571] 2.594 [0.273]
Heteroscedasticity: CHSQ (1) 0.137 [0.711] 0.037 [0.848] 1.480 [0.224]
The Cumulative Sum of Recursive Residuals (CUSUM) and the Cumulative Sum of Squares
of Recursive Residuals (CUSUMSQ) graphs of the estimated model, irrespective of the
measure of stock market development, also confirm the stability of the model over the study
period. These graphs are displayed in Figure 4.
5. Conclusion
In this paper, the impact of stock market development on unemployment in South Africa has
been put to an empirical test using time-series data from 1980 to 2019. The study was
motivated by the high level of structural unemployment facing the country, on the one hand,
and a well-developed stock market, which compares favourably with those in advanced
economies, on the other hand. In addition, there appears to be a dearth of studies on the
impact of financial development, especially market-based financial development, on
unemployment – which this study aimed to resolve. The study also aimed to add value to the
finance–unemployment literature by using a range of stock market development proxies,
namely stock market capitalisation, the total value of stocks traded and the turnover ratio.
Using the ARDL bounds testing method, the results of the study were found to be consistent,
irrespective of the stock market development proxy used and the time frame considered. A
negative relationship was confirmed between unemployment and all the three proxies of
stock market development, implying that in South Africa, stock market development reduces
unemployment in the long run and in the short run. Since all the three stock market
development proxies – stock market capitalisation, the total value of stocks traded, and the
turnover ratio – support a negative and significant relationship between the stock market
development and unemployment, we can conclude that the stock market unambiguously
promotes job creation in South Africa. The study, therefore, recommends that policymakers
should continue to implement policies aimed at promoting stock market development in order
to create more jobs, while at the same time ensuring that other structural challenges facing the
labour market are also addressed.
106
S. Nyasha, N. M. Odhiambo, M. T. Musakwa, SPOUDAI Journal, Vol. 71 (2021), Issue 1-2, pp. 92-110
17. References
Acemoglu, D., Aghion, P. and Zilibotti, F. 2006. Distance to frontier, selection and economic
growth. Journal of the European Economic Association 4: 37-74.
Aliero, H., Saifullahi, SI. and Shuaibu, M. (2013). An empirical investigation into the
relationship between financial sector development and unemployment in Nigeria. Asian
Economic and Financial Review, 3, 1361-1370.
Asongu, SA. 2015. Financial development in Africa - A critical examination. PhD, Oxford
Brookes University.
Asongu, SA. and Nwachukwu, JC. 2018. Political regimes and stock market performance in Africa.
Political Studies Review 16 (3).
Asongu, SA. 2012. Government Quality Determinants of Stock Market Performance in
African Countries. Journal of African Business 13 (3): 183-199
Banda, H., Ngirande, H. and Hogwe, F. (2016) The impact of economic growth on
unemployment in South Africa: 1994-2012, Investment Management and Financial
Innovations, 13(2-1), 246-255.
Bayar, Y. 2016. Financial development and unemployment in emerging market economies.
Scientific Annals of Economics and Business, 63(2), 237-245, DOI:10.1515/saeb-2016-
0119
Bentolila, S., Jansen, M., and Jiménez, G. 2017. When credit dries up: Job losses in the great
recession. Journal of the European Economic Association 16: 650-695.
Berton, F., Mocetti, S., Presbitero, AF. and Richiardi, M. 2018. Banks, firms and jobs.
Review of Financial Studies 31: 2113-56.
Caggese, A., and Cunat, V. 2008. Financing constraints and fixed-term employment
contracts. The Economic Journal, 118: 2013-46.
Darrat AF., Abosedra, SS. and Aly, HY. 2005. Assessing the Role of Financial Deepening in
Business Cycles: The Experience of the United Arab Emirates. Applied Financial
Economics, 15(7), 1-17.
Duasa, J. 2007. Determinants of Malaysian trade balance: An ARDL bounds testing
approach. Journal of Economic Cooperation, 28(3), 21-40.
Engle, RF. and Granger, CJ. 1987. Cointegration and error-correction - representation,
estimation and testing. Econometrica, 55 (2), 251-278.
Epstein, B. and Shapiro, AF. 2018. Financial Development, Unemployment Volatility, and
Sectoral Dynamics. Munich Personal RePEc Archive, MPRA Paper No. 88693.
Ernst, E. 2019. Finance and Jobs: how financial markets and prudential regulation shape
unemployment dynamics. Journal of Risk and Financial Management, 12, 1-30,
doi:10.3390/jrfm12010020
Gatti, D. and Vaubourg, A. 2009. Unemployment and finance: How do financial and labour
market factors interact? No 4075, IZA Discussion Papers, Institute of Labor Economics
(IZA).
Han, KC. 2009. Unemployment, financial hardship, and savings in individual development
accounts. Journal of Poverty, 13,4-95.. http://dx.doi.org/10.1080/10875540802623484
Ilo, BM., 2015. Capital market and unemployment in Nigeria. Oeconomica, 11(5), 129-140.
International Monetary Fund. 2008. South Africa: Financial System Stability Assessment,
Including Report on the Observance of Standards and Codes on the following topic:
Securities Regulation. IMF Country Report No. 08/349.
International Monetary Fund. 2020. World Economic Outlook Database. [Online] Available
from <https://www.imf.org/external/pubs/ft/weo/2020/01/weodata/index.aspx>
[Accessed 15 June 2020].
108
S. Nyasha, N. M. Odhiambo, M. T. Musakwa, SPOUDAI Journal, Vol. 71 (2021), Issue 1-2, pp. 92-110
18. Johansen, S. 1988. Statistical analysis of cointegration vectors. Journal of Economic
Dynamics and Control, 12, 231-254.
Johansen, S. and Juselius, K. 1990. Maximum likelihood estimation and inference on
cointegration with applications to the demand for money. Oxford Bulletin of Economics
and Statistics, 52,169-210.
Johannesburg Stock Exchange. 2011. JSE Annual Report 2011. [Online] Available from
<http://financialresults.co.za/2012/jse_ar2011/jse-overview.php> [Accessed 29 July
2020].
Johannesburg Stock Exchange. 2020. Listed Companies. Online] Available from <
https://www.african-markets.com/en/stock-markets/jse/listed-companies> [Accessed 29
July 2020].
Kanberoğlu, Z., 2014. Finansal sektör gelişimi ve işsizlik: Turkiye örneği. Ekonomik ve
Sosyal Araştırmalar Dergisi, 10(1), 83-93.
Levine, R. 1997. Financial development and economic growth: Views and agenda. Journal of
Economic Literature, 35: 688-726.
Levine, R. 2005. Finance and Growth: Theory and Evidence. London: Elsevier B. V, 865–
934.
Levine, R. and Zervos, S. 1998. Stock markets, banks, and economic growth. American
Economic Review, 88: 537–58.
Magombeyi, MT. and Odhiambo, NM. 2018. Dynamic impact of FDI inflows on poverty
reduction: Empirical evidence from South Africa. Sustainable Cities and Society, 39,
519-526
Marrs, D. 2013. The Global Financial Crisis and Emerging Economies: Role Model South
Africa. Available from <http://www.za.boell.org/web/publications-258.html> [Accessed
18 July 2020].
Misati, RNA. 2006. Liberalization, stock market development and investment efficiency in
Africa. A paper submitted to Centre for the Study of African Economies (CSAE) for
presentation at a conference to be held at St. Catherine’s College, Oxford, December,
2006
Nyasha, S. and Odhiambo, NM. 2014. Bank-based financial development and economic
growth: A review of international literature. Journal of Financial Economic Policy, 6(2),
112-132.
Nyasha, S. and Odhiambo, NM. 2015a. Financial development and economic growth in
South Africa: An ARDL-Bounds testing approach to impact analysis. Contemporary
Economics, 9(1), 93-108.
Nyasha, S. and Odhiambo, NM. 2015b. Economic Growth and market-based financial
systems: A review. Studies in Economics and Finance, 32(2), 235-255.
Nyasha, S. and Odhiambo, NM. 2015c. The origin and development of the South African
stock market. Interdisciplinary Journal of Economics and Business Law, 4(3), 48-69.
Nyasha, S. and Odhiambo, N.M. 2015d. Do banks and stock markets spur economic growth?
Kenya's experience. International Journal of Sustainable Economy, 7 (1), 54-65.
Nyasha, S. and Odhiambo, NM. 2018. Finance-growth nexus revisited: Empirical evidence
from six countries. Scientific Annals of Economics and Business, 65(3), 247-268.
Nyasha, S. and Odhiambo, NM. 2020. Does remittance inflow granger-cause economic
growth in South Africa? A dynamic multivariate causality test. Review of Black Political
Economy, 47(1) 86-103.
Nyasha, S., Odhiambo, NM. and Asongu, SA. 2020. The impact of tourism development on
economic growth in sub-Saharan Africa. The European Journal of Development
Research, Forthcoming.
109
S. Nyasha, N. M. Odhiambo, M. T. Musakwa, SPOUDAI Journal, Vol. 71 (2021), Issue 1-2, pp. 92-110
19. Odhiambo, NM. 2008. Financial depth, savings and economic growth in Kenya: A dynamic
causal linkage. Economic Modelling, 25, 704-713.
Odhiambo, NM (2014). Energy dependence in developing countries: Does the level of
income matter? Atlantic Economic Journal, 42 (1), 65-77
Ogbeide, F. I., Kanwanye, H., and Kadiri, S., 2015. The determinants of unemployment and
the question of inclusive growth in Nigeria: Do resource dependence, government
expenditure and financial development matter? Montenegrin Journal of Economics,
11(2), 49-64. DOI:http://dx.doi.org/10.14254/1800-5845.2015/11-2/3
Pagano, M. and Pica, G. 2012. Finance and employment. Economic Policy, 27: 5-55.
Pesaran, MH. and Shin, Y. (1999). An autoregressive distributed lag modelling approach to
cointegration analysis, in Econometrics and Economic Theory in the 20th Century: The
Ragnar Frisch Centennial Symposium, eds. Storm, S., Cambridge University Press,
Chapter 11, pp.1-31.
Pesaran, MH., Shin, Y. and Smith, R. (2001). Bound testing approaches to the analysis of
level relationship. Journal of Applied Econometrics, 16, 174-189.
Rajan, Raghuram G., and Luigi Zingales. 1998. Financial dependence and growth. American
Economic Review, 88: 559-86.
Shabbir, G., Anwar, S., Hussain, Z. and Imran, M., 2012. Contribution of financial sector
development in reducing unemployment in Pakistan. International Journal of Economics
and Finance, 4(1), 260-268. DOI: http://dx.doi.org/10.5539/ijef.v4n1p260
South African Government. 2019. Towards a 25-year review. . [Online] Available from
<https://www.gov.za/documents/towards-25-year-review-8-nov-2019-0000> [Accessed
29 July 2020].
South African Government Information, 2009. Framework for South Africa's response to the
international economic crisis. [Online] Available from
<http://www.info.gov.za/view/DownloadFileAction?id=96381> [Accessed 29 July
2020]
Statistics South Africa. 2020. Quarterly Labour Force Survey, 1st Quarter 2020. [Online]
Available from < http://www.statssa.gov.za/?page_id=1854&PPN=P0211&SCH=7889>
[Accessed 25 July 2020]
World Bank, 2020. World Bank DataBank. [Online] Available from
<https://databank.worldbank.org/home.aspx> [Accessed 5 June 2020].
Xesibe, Z. and Nyasha, S. 2020. Unemployment and economic growth in South Africa: A re-
examination. International Journal of Sustainable Economy, Forthcoming.
110
S. Nyasha, N. M. Odhiambo, M. T. Musakwa, SPOUDAI Journal, Vol. 71 (2021), Issue 1-2, pp. 92-110