Download to read offline
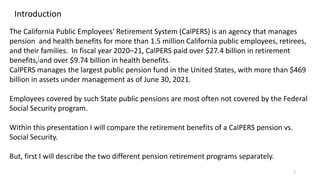
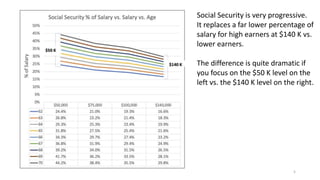
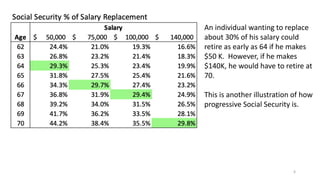

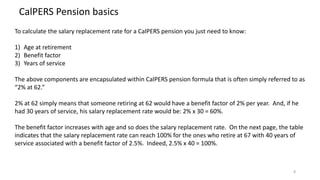
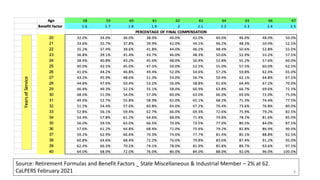

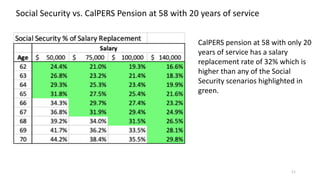
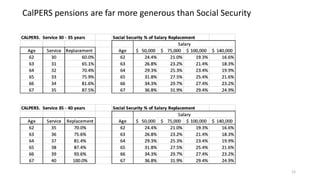
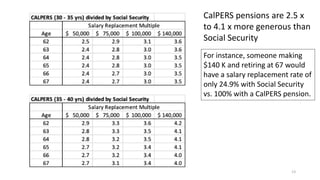
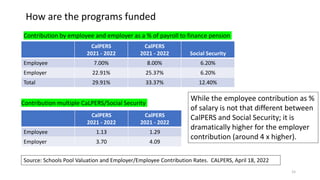
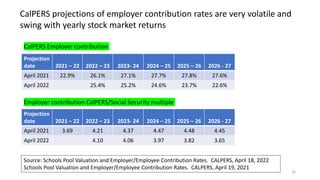
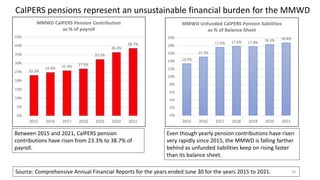
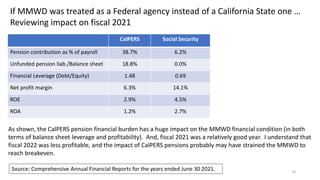

The document compares the California Public Employees' Retirement System (CalPERS) and Social Security, highlighting that CalPERS offers significantly higher retirement benefits, with replacement rates up to 100% versus only 24.9% for higher earners under Social Security. It discusses the funding mechanisms, noting that employer contributions to CalPERS are substantially higher and that financial burdens associated with CalPERS pensions are impacting agencies like the Marin Municipal Water District. Overall, the document suggests that the financial strain from public pensions is a broader issue affecting local and state agencies across the country.


