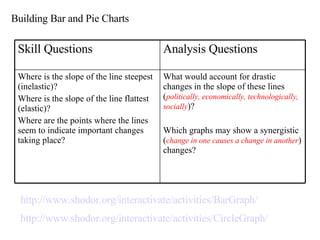
This document provides links to online activities for building bar and pie charts, and poses analysis questions about interpreting graphs showing changes over time in political, economic, technological and social areas. The questions ask about identifying points of steep or flat slope on the graphs indicating inelastic or elastic changes, and points where important changes seem to be taking place as revealed by the data.
1. Building Bar and Pie Charts http://www.shodor.org/interactivate/activities/BarGraph/ http://www.shodor.org/interactivate/activities/CircleGraph/ What would account for drastic changes in the slope of these lines ( politically, economically, technologically, socially )? Which graphs may show a synergistic ( change in one causes a change in another ) changes? Where is the slope of the line steepest (inelastic)? Where is the slope of the line flattest (elastic)? Where are the points where the lines seem to indicate important changes taking place? Analysis Questions Skill Questions