How Automation is Driving Efficiency Through the Last Mile of Reporting
freddie mac January 23, 2009
1. Monthly Volume Summary: December 2008
(unaudited & subject to change)
(dollars in millions)
December 2008 Highlights:
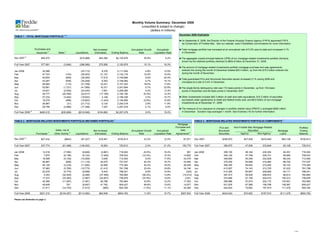
TABLE 1 - TOTAL MORTGAGE PORTFOLIO 1, 2
November 2008 Highlights:
►On September 6, 2008, the Director of the Federal Housing Finance Agency (FHFA) appointed FHFA
as Conservator of Freddie Mac. See our website, www.FreddieMac.com/investors for more information.
►The aggregate unpaid principal balance (UPB) of our Retained portfolio declined to $xxx.x
►Total mortgage portfolio has increased at an annualized rate of 5.0% year-to-date and increased 4.1%
Purchases and Net Increase/ Annualized Growth Annualized billion at mmm dd, yyyy.
Issuances 3 4
in December.
Sales Liquidations (Decrease) Ending Balance Rate Liquidation Rate
►Total mortgage portfolio has increased at an annualized rate of xx.x% year-to-date and
Dec 2007 5 ►The aggregate unpaid principal balance (UPB) of our mortgage-related investments portfolio (formerly
$55,072 - ($10,688) $44,384 $2,102,676 25.9% 6.2%
known as themmm. portfolio) declined to $804.8 billion at December 31, 2008.
xx.x% in retained
Full-Year 2007 577,691 (3,646) (298,089) 275,956 2,102,676 15.1% 16.3%
►The amount of retained portfolio mortgage purchase and sales agreements entered
►The amount of mortgage-related investments portfolio mortgage purchase and sale agreements into
entered into during the month oftotaled $x.x billion, down from the $xx.x billion
during the month of mmm December totaled $25.4 billion, up from the $15.0 billion entered into
Jan 2008 32,089 - (23,713) 8,376 2,111,052 4.8% 13.5%
during the month of November.
entered into during the month of ppp.
Feb 47,723 (143) (26,453) 21,127 2,132,179 12.0% 15.0%
Mar 54,604 (829) (36,265) 17,510 2,149,689 9.9% 20.4%
►Total guaranteed PCs and Structured Securities issued increased 5.1% during 2008 and
►Total guaranteed0.4% in December.
Apr 43,287 (636) (34,258) 8,393 2,158,082 4.7% 19.1%
increased at a rate of PCs and Structured Securities issued have increased at an annualized rate
May 65,064 (115) (31,708) 33,241 2,191,323 18.5% 17.6% of xx.x% year-to-date and xx.x% in mmm.
Jun 53,661 (1,721) (41,569) 10,371 2,201,694 5.7% 22.8% ►The single-family delinquency rate was 172 basis points in December, up from 152 basis
►Thein November and 65 basis points in for all loans was xx basis points in mmm,
Jul 34,631 (2,500) (24,440) 7,691 2,209,385 4.2% 13.3% points single-family delinquency rate December 2007.
Aug 25,777 (20,355) (22,617) (17,195) 2,192,190 (9.3%) 12.3% down from xx basis points in ppp.
►Other Investments includes $45.3 billion of cash and cash equivalents, $10.2 billion of securities
Sep 27,234 (3,454) (19,632) 4,148 2,196,338 2.3% 10.7%
purchased under agreements to resell and federal funds sold, and $8.8 billion of non-mortgage
Oct 19,279 (899) (19,823) (1,443) 2,194,895 (0.8%) 10.8% ►The measure December 31, 2008. changes in portfolio market value averaged $xxx million for
of our exposure to
investments as of
Nov 26,867 (31) (21,712) 5,124 2,200,019 2.8% 11.9%
PMVS-L in mmm. Duration Gap averaged z months. See Endnote (14) for further information.
Dec 29,799 (4,986) (17,356) 7,457 2,207,476 4.1% 9.5%
►The measure of our exposure to changes in portfolio market value (PMVS-L) averaged $260 million
6 in December. Duration Gap averaged 1 month. See Endnote (15) for further information.
Full-Year 2008 $460,015 ($35,669) ($319,546) $104,800 $2,207,476 5.0% 15.2%
TABLE 2 - MORTGAGE-RELATED INVESTMENTS PORTFOLIO (RETAINED PORTFOLIO) 1 TABLE 3 - MORTGAGE-RELATED INVESTMENTS PORTFOLIO COMPONENTS 1
Mortgage
Purchase and Non-Freddie Mac Mortgage-Related
PCs and Portfolio
Sales, net of Sale Securities
Net Increase/ Annualized Growth Annualized Structured Mortgage Ending
7
Other Activity 8 Agreements 9 Agency Non-Agency
Purchases Liquidations (Decrease) Ending Balance Rate Liquidation Rate Securities Loans Balance
Dec 2007 5 $27,432 ($644) ($7,327) $19,461 $720,813 33.3% 12.5% $7,871 Dec 2007 $356,970 $47,836 $233,849 $82,158 $720,813
Full-Year 2007 247,774 (81,468) (149,452) 16,854 720,813 2.4% 21.2% 150,770 Full-Year 2007 356,970 47,836 233,849 82,158 720,813
Jan 2008 13,518 (7,550) (9,849) (3,881) 716,932 (6.5%) 16.4% 581 Jan 2008 356,105 48,182 230,354 82,291 716,932
Feb 7,870 (6,156) (9,123) (7,409) 709,523 (12.4%) 15.3% 14,802 Feb 349,129 47,798 226,701 85,895 709,523
Mar 18,598 (5,150) (10,509) 2,939 712,462 5.0% 17.8% 43,479 Mar 346,850 54,349 222,929 88,334 712,462
Apr 36,887 (696) (11,116) 25,075 737,537 42.2% 18.7% 43,485 Apr 375,200 54,668 218,964 88,705 737,537
May 46,126 (2,218) (11,062) 32,846 770,383 53.4% 18.0% 26,249 May 395,355 69,642 215,283 90,103 770,383
Jun 37,983 (5,795) (10,773) 21,415 791,798 33.4% 16.8% 34,746 Jun 413,907 74,143 212,725 91,023 791,798
Jul 22,076 (5,775) (9,858) 6,443 798,241 9.8% 14.9% (324) Jul 414,365 80,857 209,848 93,171 798,241
Aug 4,353 (32,505) (9,206) (37,358) 760,883 (56.2%) 13.8% (15,410) Aug 397,573 59,526 206,972 96,812 760,883
Sep 17,373 (33,383) (7,997) (24,007) 736,876 (37.9%) 12.6% 2,521 Sep 374,946 57,108 204,510 100,312 736,876
Oct 45,366 (11,097) (7,481) 26,788 763,664 43.6% 12.2% 17,363 Oct 399,986 57,815 202,172 103,691 763,664
Nov 49,649 761 (8,647) 41,763 805,427 65.6% 13.6% 14,977 Nov 431,976 67,586 199,798 106,067 805,427
Dec 21,511 (14,703) (7,473) (665) 804,762 (1.0%) 11.1% 25,365 Dec 424,524 70,852 197,910 111,476 804,762
Full-Year 2008 $321,310 ($124,267) ($113,094) $83,949 $804,762 11.6% 15.7% $207,834 Full-Year 2008 $424,524 $70,852 $197,910 $111,476 $804,762
Please see Endnotes on page 3.
1 of 3
2. TABLE 5 - DEBT ACTIVITIES 12
TABLE 4 - TOTAL GUARANTEED PCs AND STRUCTURED SECURITIES ISSUED 1, 10
Original Maturity
< 1 Year Original Maturity > 1 Year
Foreign
Maturities and Exchange Total Debt
Net Increase/ Ending Annualized Annualized
11
Ending Balance Issuances Redemptions Repurchases Translation Ending Balance Outstanding
Issuances Liquidations (Decrease) Balance Growth Rate Liquidation Rate
Dec 2007 5 $48,210 ($4,720) $43,490 $1,738,833 30.8% 3.3% Dec 2007 $ 199,498 $ 16,255 $ (19,520) $ (3,156) $ (82) $ 581,763 $ 781,261
581,763 781,261
Full-Year 2007 470,976 (209,166) 261,810 1,738,833 17.7% 14.2% Full-Year 2007 199,498 188,548 (209,592) (15,096) 2,284
573,986 776,284
Jan 2008 29,480 (18,088) 11,392 1,750,225 7.9% 12.5% Jan 2008 202,298 20,459 (28,415) (58) 237
568,694 769,235
Feb 42,968 (21,408) 21,560 1,771,785 14.8% 14.7% Feb 200,541 27,343 (32,944) (21) 330
599,393 801,354
Mar 43,526 (31,234) 12,292 1,784,077 8.3% 21.2% Mar 201,961 46,916 (16,864) - 647
595,716 828,306
Apr 40,779 (29,111) 11,668 1,795,745 7.8% 19.6% Apr 232,590 29,507 (31,194) (1,721) (269)
609,256 848,482
May 47,310 (26,760) 20,550 1,816,295 13.7% 17.9% May 239,226 33,322 (17,768) (1,986) (28)
625,959 869,516
Jun 43,981 (36,473) 7,508 1,823,803 5.0% 24.1% Jun 243,557 36,603 (19,330) (779) 209
627,995 874,311
Jul 21,712 (20,006) 1,706 1,825,509 1.1% 13.2% Jul 246,316 13,944 (6,657) (5,103) (148)
624,405 853,040
Aug 22,072 (18,701) 3,371 1,828,880 2.2% 12.3% Aug 228,635 7,164 (7,312) (2,584) (858)
590,710 814,940
Sep 21,994 (16,466) 5,528 1,834,408 3.6% 10.8% Sep 224,230 5,037 (37,278) (796) (658)
585,865 868,466
Oct 13,803 (16,994) (3,191) 1,831,217 (2.1%) 11.1% Oct 282,601 10,432 (12,903) (1,068) (1,306)
580,544 886,025
Nov 14,514 (19,163) (4,649) 1,826,568 (3.0%) 12.6% Nov 305,481 2,809 (8,108) (30) 8
539,374 870,276
Dec 15,722 (15,052) 670 1,827,238 0.4% 9.9% Dec 330,902 10,777 (49,265) (3,808) 1,126
6
Full-Year 2008 $357,861 ($269,456) $88,405 $1,827,238 5.1% 15.5% Full-Year 2008 $330,902 $244,313 ($268,038) ($17,954) ($710) $539,374 $870,276
TABLE 6 - DELINQUENCIES 13 TABLE 8 - INTEREST-RATE RISK SENSITIVITY DISCLOSURES 15
TABLE 7 - OTHER INVESTMENTS
Portfolio Market Value- Portfolio Market Value-
Level Yield Curve
Single-Family Multifamily (PMVS-L) (50bp) (PMVS-YC) (25bp) Duration Gap
(dollars in millions) (dollars in millions) (Rounded to Nearest Month)
Ending
Non-Credit Credit Monthly Quarterly Quarterly Monthly Quarterly
Balance 14
Enhanced Enhanced Total Total Average Average Monthly Average Average Average Average
Dec 2007 0.45% 1.62% 0.65% 0.02% Dec 2007 50,237 Dec 2007 $385 $361 $50 $37 0 0
Full-Year 2007 50,237 Full-Year 2007 261 -- 31 -- 0 --
Jan 2008 0.49% 1.73% 0.71% 0.01% Jan 2008 47,312 Jan 2008 438 -- 55 -- 0 --
Feb 0.52% 1.78% 0.74% 0.01% Feb 48,838 Feb 331 -- 55 -- 0 --
Mar 0.54% 1.81% 0.77% 0.01% Mar 73,804 Mar 437 403 41 50 1 0
Apr 0.57% 1.88% 0.81% 0.03% Apr 78,320 Apr 571 -- 20 -- 1 --
May 0.61% 1.98% 0.86% 0.03% May 70,846 May 576 -- 202 -- 0 --
Jun 0.67% 2.10% 0.93% 0.04% Jun 71,687 Jun 390 513 49 90 0 0
Jul 0.72% 2.30% 1.01% 0.03% Jul 68,697 Jul 348 -- 42 -- 0 --
Aug 0.79% 2.50% 1.11% 0.02% Aug 84,064 Aug 271 -- 81 -- 0 --
Sep 0.87% 2.75% 1.22% 0.01% Sep 68,590 Sep 395 338 87 70 0 0
Oct 0.96% 3.04% 1.34% 0.01% Oct 94,793 Oct 354 -- 34 -- 0 --
Nov 1.09% 3.41% 1.52% 0.01% Nov 79,119 Nov 394 -- 65 -- 0 --
Dec 1.26% 3.79% 1.72% 0.01% Dec 64,270 Dec 260 332 149 84 1 0
Full-Year 2008 $64,270 Full-Year 2008 $397 -- $73 -- 0 --
Please see Endnotes on page 3.
2 of 3
3. ENDNOTES
(1) The activity and balances set forth in this table represent contractual amounts of unpaid principal balances, which are measures that differ from the balance of the mortgage-related investments portfolio (formerly known as the retained portfolio) as calculated in
conformity with GAAP, and exclude mortgage loans and mortgage-related securities traded, but not yet settled. The mortgage-related investments portfolio amounts set forth in this report exclude premiums, discounts, deferred fees and other basis adjustments, the
allowance for loan losses on mortgage loans held-for-investment, and unrealized gains or losses on mortgage-related securities that are reflected in our mortgage-related investments portfolio under GAAP.
(2) Total mortgage portfolio (Table 1) is defined as total guaranteed PCs and Structured Securities issued (Table 4) plus the sum of mortgage loans (Table 3) and non-Freddie Mac mortgage-related securities (agency and non-agency) (Table 3).
(3) Total mortgage portfolio Purchases and Issuances (Table 1) is defined as mortgage-related investments portfolio purchases (Table 2) plus total guaranteed PCs and Structured Securities issued (Table 4) less purchases into the mortgage-related investments portfolio.
Purchases of Freddie Mac PCs and Structured Securities into the mortgage-related investments portfolio totaled $7,434 million (based on unpaid principal balances) during the month of December 2008.
(4) Includes: sales of non-Freddie Mac mortgage-related securities and multifamily mortgage loans from our mortgage-related investments portfolio. Excludes the transfer of single-family mortgage loans through transactions that qualify as sales and all transfers through
swap-based exchanges.
(5) Effective December 2007, we established securitization trusts for the underlying assets of our guaranteed PCs and Structured Securities issued. As a result, we adjusted the reported balance of our mortgage portfolio to reflect the publicly-available security balances of
guaranteed PCs and Structured Securities. Previously we reported these balances based on the unpaid principal balance of the underlying mortgage loans. Our reported annualized growth rate and annualized liquidation rate for the month of December 2007 and full-
year 2007 presented in Tables 1, 2, and 4 are affected by this reporting change.
(6) Issuances and liquidations for the year ended December 31, 2008 include approximately $19.9 billion of conversions of previously issued long-term standby commitments into either PCs or Structured Transactions. These conversion amounts, based on the unpaid
principal balance of the single-family mortgage loans, are included in liquidations, representing the termination of the original agreement and, in the same month, are included in issuances, representing the new securities issued. Excluding these conversions, the
amount of our issuances for the year ended December 31, 2008 would have been $338.0 billion in Table 4 and the liquidation rates for the year ended December 31, 2008 in Tables 1 and 4 would have been 14.2% and 14.4%, respectively. As of December 31,
2008, the ending balance of our PCs and Structured Securities, excluding outstanding long-term standby commitments, would have been $1,817 billion in Table 4.
(7) Single-family mortgage loans purchased for cash are reported net of transfers of such mortgage loans through transactions that qualify as sales under GAAP as well as all transfers through swap-based exchanges.
(8) See Endnote 4. Also includes: (a) net additions to our mortgage-related investments portfolio for delinquent mortgage loans purchased out of PC pools, (b) balloon reset mortgages purchased out of PC pools and (c) transfers of PCs and Structured Securities from our
mortgage-related investments portfolio reported as sales.
(9) Mortgage purchase and sale agreements reflects trades entered into during the month and includes: (a) monthly commitments to purchase mortgage-related securities for our mortgage-related investments portfolio offset by monthly commitments to sell mortgage-
related securities out of our mortgage-related investments portfolio during the month and (b) the net amount of monthly mortgage loan purchases and sales agreements entered into during the month. Substantially all of these commitments are settled by delivery of
a mortgage-related security or mortgage loan; the rest are net settled for cash. Mortgage purchase and sale agreements also includes the net amount of mortgage-related securities that we expect to purchase or sell pursuant to written and purchased options
entered into during the month for which we expect to take or make delivery of the securities. In some instances, commitments may settle during the same period in which we have entered into the related commitment.
(10) Includes PCs, Structured Securities and tax-exempt multifamily housing revenue bonds for which we provide a guarantee, as well as credit-related commitments with respect to single-family mortgage loans held by third parties. Excludes Structured Securities where we
have resecuritized our PCs and Structured Securities. These resecuritized securities do not increase our credit-related exposure and consist of single-class Structured Securities backed by PCs, Real Estate Mortgage Investment Conduits (REMICs) and principal-only
strips. Notional balances of interest-only strips are excluded because this table is based on unpaid principal balance. Some of the excluded REMICs are modifiable and combinable REMIC tranches, where the holder has the option to exchange the security tranches
for other pre-defined security tranches. Additional information concerning our guarantees issued through resecuritization can be found in our Registration Statement on Form 10, dated July 18, 2008.
(11) Represents principal repayments relating to PCs and Structured Securities including those backed by non-Freddie Mac mortgage-related securities and relating to securities issued by others and single-family mortgage loans held by third parties that we guarantee. Also
includes our purchases of delinquent mortgage loans and balloon reset mortgage loans out of PC pools.
(12) Represents the combined balance and activity of our senior and subordinated debt based on the par values of these liabilities.
(13) Single-family delinquencies are based on the number of mortgages 90 days or more delinquent or in foreclosure as of period end while multifamily delinquencies are based on net carrying value of mortgages 90 days or more delinquent or in foreclosure as of period
end. Delinquency rates presented in Table 6 exclude mortgage loans underlying Structured Transactions and PCs backed by Ginnie Mae Certificates as well as mortgage loans whose original contractual terms have been modified under an agreement with the
borrower as long as the borrower is less than 90 days delinquent under the modified contractual terms. Structured Transactions typically have underlying mortgage loans with a variety of risk characteristics. Many of these Structured Transactions have security-
level credit protections from losses in addition to loan-level credit protection that may also exist. Additional information concerning Structured Transactions can be found in our Registration Statement on Form 10, dated July 18, 2008.
The unpaid principal balance of our single-family Structured Transactions at December 31, 2008 was $23.6 billion, representing approximately 1% of our total mortgage portfolio. Included in this balance is $5.3 billion that are backed by subordinated securities, including
$1.9 billion of these that are secured by FHA/VA loans, for which those agencies provide recourse for 100% of the qualifying losses associated with the loan. Structured Transactions backed by subordinated securities benefit from credit protection from the related
subordinated tranches, which we do not purchase. The remaining $18.3 billion of our Structured Transactions as of December 31, 2008 are single-class, or pass-through securities, including $10.8 billion of option ARMs, which do not benefit from structural or other
credit enhancement protections. The delinquency rate for our single-family Structured Transactions was 7.23% at December 31, 2008. The total single-family delinquency rate including our Structured Transactions was 1.83% at December 31, 2008. Below are the
delinquency rates of our Structured Transactions:
Structured Transactions securitized by: subordinated securities, including FHA/VA guarantees 17.2%; option ARM pass-through securities 9.0%; Other pass-through securities 0.3%.
Previously reported delinquency data is subject to change to reflect currently available information. Revisions to previously reported delinquency rates have not been significant nor have they significantly affected the overall trend of our single-family quot;credit enhancedquot;
and quot;totalquot; delinquency rates.
(14) Other Investments ending balance consists of our cash and investments portfolio, which as of December 31, 2008 includes; $45.3 billion of cash and cash equivalents; $10.2 billion of securities purchased under agreements to resell and federal funds sold; and $8.8
billion of non-mortgage investments. Non-mortgage investments within this balance are presented at fair value.
(15) Our PMVS and duration gap measures provide useful estimates of key interest-rate risk and include the impact of our purchases and sales of derivative instruments, which we use to limit our exposure to changes in interest rates. Our PMVS measures are
estimates of the amount of average potential pre-tax loss in the market value of our net assets due to parallel (PMVS-L) and non-parallel (PMVS-YC) changes in London Interbank Offered Rates (LIBOR). While we believe that our PMVS and duration gap metrics
are useful risk management tools, they should be understood as estimates rather than precise measurements. Methodologies employed to calculate interest-rate risk sensitivity disclosures are periodically changed on a prospective basis to reflect improvements in
the underlying estimation processes.
A glossary of selected Monthly Volume Summary terms is available on the Investor Relations page of our website, www.FreddieMac.com/investors.
The Monthly Volume Summary includes volume and statistical data pertaining to our portfolios. Inquiries should be addressed to our Investor Relations Department, which can be reached by calling (703) 903-3883 or writing to:
8200 Jones Branch Drive, Mail Stop 486,
McLean, VA 22102-3110
or sending an email to shareholder@freddiemac.com.
3 of 3