1. PFIZER REPORTS FOURTH-QUARTER AND FULL-YEAR 2008 RESULTS
AND 2009 FINANCIAL GUIDANCE
Fourth-Quarter 2008 Reported Revenues of $12.3 Billion Compared with $12.9 Billion in the
Year-Ago Quarter
Fourth-Quarter 2008 Reported Diluted EPS of $0.04 Compared with $0.40 in the Year-Ago
Quarter, Reflecting a $2.3 Billion Charge Resulting from an Agreement in Principle to
Resolve Previously Disclosed Investigations
Fourth-Quarter 2008 Adjusted Diluted EPS(1) of $0.65 Compared with $0.50 in the Year-Ago
Quarter
Achieves Full-Year 2008 Revenue and Adjusted Diluted EPS(1) Guidance; Reports $2.8
Billion in Adjusted Total Cost(2) Reductions During 2007 and 2008, Exceeding Target
Announces New Cost-Reduction Program Targeting Additional Net Savings of $2 Billion by
2011; New Program plus Just-Completed Program have Potential to Yield Cost Savings of
about $4.8 Billion
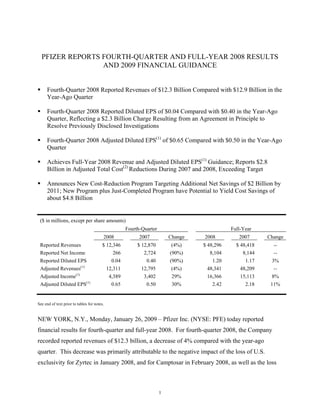
($ in millions, except per share amounts)
Fourth-Quarter Full-Year
2008 2007 Change 2008 2007 Change
Reported Revenues $ 12,346 $ 12,870 (4%) $ 48,296 $ 48,418 --
Reported Net Income 266 2,724 (90%) 8,104 8,144 --
Reported Diluted EPS 0.04 0.40 (90%) 1.20 1.17 3%
Adjusted Revenues(1) 12,311 12,795 (4%) 48,341 48,209 --
Adjusted Income(1) 4,389 3,402 29% 16,366 15,113 8%
Adjusted Diluted EPS(1) 0.65 0.50 30% 2.42 2.18 11%
See end of text prior to tables for notes.
NEW YORK, N.Y., Monday, January 26, 2009 – Pfizer Inc. (NYSE: PFE) today reported
financial results for fourth-quarter and full-year 2008. For fourth-quarter 2008, the Company
recorded reported revenues of $12.3 billion, a decrease of 4% compared with the year-ago
quarter. This decrease was primarily attributable to the negative impact of the loss of U.S.
exclusivity for Zyrtec in January 2008, and for Camptosar in February 2008, as well as the loss
1
2. of exclusivity for Norvasc in Korea and Japan in February 2008 and July 2008, respectively.
Zyrtec, Camptosar and Norvasc fourth-quarter 2008 revenues decreased by $515 million ($263
million, $144 million and $108 million, respectively), compared with the year-ago quarter. In
addition, foreign exchange unfavorably impacted reported revenues by approximately $380
million or 3%, partially offset by the solid performance of key products.
U.S. reported revenues were $5.3 billion in fourth-quarter 2008, a decrease of 8% compared with
the year-ago quarter. International reported revenues were $7.1 billion, a decrease of 1%
compared with the year-ago quarter, and reflect operational growth of 5%, which was more than
offset by the unfavorable impact of foreign exchange of 6%. U.S. reported revenues accounted
for 43% of the total compared with 44% in the year-ago quarter, while international reported
revenues accounted for 57% of the total compared with 56% in the year-ago quarter.
For fourth-quarter 2008, Pfizer posted reported net income of $266 million, a decline of 90%
compared with the prior-year quarter, and reported diluted EPS of $0.04, a decrease of 90%
compared with the prior-year quarter. Fourth-quarter 2008 results were impacted by a $2.3
billion pre-tax and after-tax charge resulting from an agreement in principle with the Office of
Michael Sullivan, the United States Attorney for the District of Massachusetts, to resolve
previously disclosed investigations regarding allegations of past off-label promotional practices
concerning Bextra, as well as other open investigations. In addition, results were unfavorably
impacted by an increased effective tax rate and an increase in pre-tax charges of $1.2 billion
($700 million after-tax) associated with cost-reduction initiatives, which were partially offset by
savings from those initiatives.
For full-year 2008, Pfizer recorded reported revenues of $48.3 billion, essentially flat compared
with 2007 full-year revenues of $48.4 billion, despite the loss of exclusivity of Norvasc, Zyrtec
and Camptosar, which collectively decreased revenues by $2.6 billion. Full-year revenues were
favorably impacted by foreign exchange of approximately $1.6 billion, or 3%, and the solid
performance of many key products. U.S. reported revenues were $20.4 billion, a decrease of
12% year over year, while international reported revenues were $27.9 billion, an increase of
10%, reflecting the favorable impact of foreign exchange of 6% and operational growth of 4%.
2
3. U.S. reported revenues accounted for 42% of the total compared with 48% in the year-ago
period, while international reported revenues accounted for 58% of the total compared with 52%
in the year-ago period.
For full-year 2008, the Company posted reported net income of $8.1 billion, essentially flat
compared with the prior year, and reported diluted EPS of $1.20, an increase of 3% compared
with $1.17. This was primarily attributable to savings associated with our cost-reduction
initiatives, the 2007 after-tax charges of $1.8 billion related to the decision to exit Exubera and
the favorable impact of foreign exchange, offset by the aforementioned charge related to Bextra
and other open investigations in fourth-quarter 2008, as well as the after-tax charge of $640
million resulting from the agreements in principle to resolve certain litigation involving the
Company’s non-steroidal anti-inflammatory (NSAID) pain medicines in third-quarter 2008 and
an increased effective tax rate.
Adjusted Revenues(1), Adjusted Income(1) and Adjusted Diluted EPS(1) Results
For fourth-quarter 2008, Pfizer posted adjusted revenues(1) of $12.3 billion, a decrease of 4%
compared with $12.8 billion in the year-ago quarter. For full-year 2008, Pfizer posted adjusted
revenues(1) of $48.3 billion, essentially flat compared with $48.2 billion in full-year 2007.
Adjusted revenues(1) in both periods were positively impacted by the solid performance of key
products, and negatively impacted by the loss of exclusivity of Norvasc, Zyrtec and Camptosar.
In addition, foreign exchange unfavorably impacted fourth-quarter 2008 revenues compared with
the year-ago period by $389 million, but favorably impacted full-year 2008 revenues by $1.6
billion compared with the prior year.
Fourth-quarter 2008 adjusted income(1) was $4.4 billion, an increase of 29% compared with $3.4
billion in the year-ago quarter, and adjusted diluted EPS(1) was $0.65, an increase of 30%
compared with $0.50 in the year-ago quarter. Both adjusted income(1) and adjusted diluted
EPS(1) were positively impacted by savings associated with our cost-reduction initiatives and
higher fourth-quarter 2007 spending levels in comparison with fourth-quarter 2008, partially
offset by an increase in the effective tax rate. Full-year 2008 adjusted income(1) was $16.4
billion, an increase of 8% compared with $15.1 billion in the year-ago period, and adjusted
3
4. diluted EPS(1) was $2.42, an increase of 11% compared with $2.18. Full-year 2008 adjusted
income(1) and adjusted diluted EPS(1) were primarily impacted by the favorable impact of foreign
exchange and savings from cost-reduction initiatives.
Reported and adjusted diluted EPS(1) were also positively impacted by the full benefit of Pfizer’s
purchase of $10.0 billion of the Company’s common stock in 2007.
Executive Commentary
“We are pleased with our performance in 2008,” said Chairman and Chief Executive Jeff
Kindler. “We achieved our financial objectives, including exceeding our cost-reduction target,
despite the tumultuous global economy. Notwithstanding an extremely competitive and
increasingly challenging environment in 2008, we made significant progress by: establishing
customer-focused business units; reprioritizing and refocusing our research on the greatest
opportunities for scientific, medical and commercial success; and increasing our Phase 3
portfolio by approximately 60%, from 16 to 26 programs at year-end. These successes have
provided the ideal platform from which we’re advancing Pfizer forward.”
“As part of this advancement, today we announced that we have entered into an agreement to
acquire Wyeth to create the world’s premier biopharmaceutical company. The combination of
Pfizer and Wyeth will meaningfully deliver Pfizer’s strategic priorities in a single transaction.
Our combined company will be one of the most diversified in the industry and will benefit from
complementary patient-centric units that match speed with the benefits of a global company’s
scale and resources,” continued Kindler.
Frank D’Amelio, Chief Financial Officer, stated, “In 2008, we exceeded our cost-reduction
target by decreasing our adjusted total costs(2) by $2.8 billion in comparison to 2006 on a
constant currency basis(3). In addition, we are implementing a new cost-reduction initiative that
will drive a lower, more variable cost structure to achieve anticipated incremental savings of
approximately $3 billion by the end of 2011 compared with our 2008 adjusted total costs(2) level.
After allocating approximately $1 billion of investment to high-growth opportunities, we
anticipate net savings of about $2 billion compared with our 2008 adjusted total costs(2) at 2008
4
5. average foreign exchange rates. The anticipated net savings from this new initiative in addition
to the savings we achieved at year-end 2008 under our previous cost-reduction initiative total
approximately $4.8 billion.”
“Further, as part of the proposed acquisition of Wyeth, we expect to achieve synergies of
approximately $4 billion by the end of 2012, which will be in addition to the savings from our
previous cost-reduction initiatives,” continued D’Amelio.
“In 2009, Pfizer expects to generate revenues of $44.0 to $46.0 billion, and adjusted diluted
EPS(1) of $1.85 to $1.95, which includes most of the anticipated $1 billion investment intended to
create new sources of revenue. This also assumes a reduction in revenues of approximately $3.0
billion compared with 2008 directly related to the strengthening of the U.S. dollar,” stated
D’Amelio.
New Cost-Reduction Initiative
Pfizer will implement a new cost-reduction initiative, which is expected to achieve incremental
cost savings of approximately $3 billion, at 2008 average foreign exchange rates, compared with
2008 adjusted total costs(2) of $28.6 billion. The program will be substantially complete by the
end of 2010, with the full savings to be realized by the end of 2011. Approximately $1 billion
of these savings will be reinvested in the business, resulting in an expected $2 billion net
decrease. With this initiative and our recently completed initiative, the Company expects to
reduce adjusted total costs(2) by about $4.8 billion while absorbing inflation and compensation
increases.
As part of this cost-reduction initiative, Pfizer intends to reduce its workforce by approximately
10%. Reductions will span sales, manufacturing, research and development, and administrative
organizations. The Company also intends to reduce the number of manufacturing sites to 41
from 46 today, as well as reduce its facilities square footage by approximately 15%. In
conjunction with this program, Pfizer expects to incur costs of approximately $6 billion on a pre-
tax basis, of which $1.5 billion has been incurred.
5
6. Product Performance
($ in millions, except percentages)
Fourth-Quarter Full-Year
2008 2007 Change 2008 2007 Change
(4)
In-Line Products $10,132 $10,061 1% $ 39,635 $ 37,424 6%
New Products(5) 451 468 (4%) 1,820 1,489 22%
Total In-Line and
New Products(6) 10,583 10,529 1% 41,455 38,913 7%
Loss of Exclusivity
Products(7) 658 1,173 2,936 5,511 (47%)
(44%)
Returns Adjustment -- -- (217) -- *
--
Total Pharmaceutical 11,241 11,702 (4%) 44,174 44,424 (1%)
Animal Health 783 785 -- 2,825 2,639 7%
Other(8) 322 383 (16%) 1,297 1,355 (4%)
Total Revenues $ 12,346 $12,870 (4%) $ 48,296 $ 48,418 --
See end of text prior to tables for notes.
* Calculation not meaningful.
Pharmaceutical
Pharmaceutical revenues for fourth-quarter 2008 were $11.2 billion, a decrease of 4% compared
with the prior-year quarter, including the unfavorable impact of foreign exchange of
approximately $340 million or 3%. Fourth-quarter 2008 revenues were unfavorably impacted
by the aforementioned loss of exclusivity of Norvasc, Zyrtec and Camptosar, partially offset by
revenues from in-line products(4), which increased 1% compared with the year-ago quarter.
Pharmaceutical revenues for full-year 2008 were $44.2 billion, a decrease of 1% compared with
the prior year, including the favorable impact of foreign exchange of approximately $1.5 billion
or 3%. Full-year 2008 revenues were unfavorably impacted by the aforementioned loss of
exclusivity of Norvasc, Zyrtec and Camptosar, partially offset by revenues from in-line and new
products(6), which increased 7% from the prior year. In addition, full-year 2008 pharmaceutical
revenues were negatively impacted by a $217 million adjustment to the prior years’ product
returns liabilities recorded in third-quarter 2008.
6
7. Lipitor revenues in fourth-quarter 2008 were $3.1 billion, a decrease of 8% compared with the
prior-year quarter. In the U.S., Lipitor revenues were $1.6 billion, a decrease of 13% compared
with the prior-year quarter. Revenues from international markets were $1.5 billion, a decrease of
2%, reflecting the unfavorable impact of foreign exchange of approximately $124 million, or
8%, which more than offset operational growth of 6%.
Lyrica revenues in fourth-quarter 2008 were $702 million, a year-over-year increase of 25%,
driven by strong physician prescribing patterns and patient satisfaction, as well as increased use
of Lyrica for fibromyalgia in the U.S., where the product continues to build on its leadership
position for this indication. In the U.S., Lyrica revenues were $384 million, a year-over-year
increase of 20%, while international revenues were $318 million, an increase of 31%, reflecting
operational growth of 42% and the unfavorable impact of foreign exchange of 11%.
Celebrex revenues in fourth-quarter 2008 were $664 million, an increase of 4% compared with
the year-ago quarter, supported by continued educational and promotional efforts highlighting
the benefit-risk proposition of Celebrex. In the U.S., Celebrex revenues were $489 million, an
increase of 4% compared with the prior-year quarter, while international revenues were $175
million, an increase of 4%.
Sutent revenues in fourth-quarter 2008 were $220 million, a year-over-year increase of 21%,
demonstrating continued strong performance and market leadership in its approved indications.
In the U.S., Sutent revenues were $66 million, an increase of 5% year over year, while
international revenues were $154 million, an increase of 30%. Sutent is available in all major
markets and is supported by efficacy, survival and cost-effectiveness data. Further, its robust life
cycle plan currently includes Phase 3 clinical trials in cancers with unmet medical need, such as
breast, lung, colorectal, liver and prostate cancers.
Chantix (known as Champix outside the U.S.) revenues in fourth-quarter 2008 were $180
million, a decrease of 36% year over year. In the U.S., Chantix revenues were $91 million, a
decline of 55% compared with the prior-year quarter, while international revenues were $89
million, an increase of 13%. Fourth-quarter 2008 U.S. results continued to be negatively
7
8. impacted by the changes to the Chantix U.S. label in prior quarters. Pfizer continues its
educational and promotional efforts with physicians and patients, focused on Chantix’s benefit-
risk proposition given the significant negative health consequences of smoking, as well as the
importance of physician-patient dialogue in helping patients quit smoking. Chantix has now
been launched in all major markets, with nine launches planned in 2009 in emerging markets.
Animal Health
Animal Health revenues for fourth-quarter 2008 were $783 million, essentially flat compared
with $785 million in the year-ago quarter. Full-year 2008 Animal Health revenues were $2.8
billion, an increase of 7% compared with $2.6 billion in 2007, driven by strong global livestock
and companion animal product performance. In fourth-quarter 2008, foreign exchange
unfavorably impacted revenues by approximately $35 million or 4%, while in full-year 2008,
foreign exchange positively impacted revenues by approximately $80 million or 3%, compared
with the prior-year respective periods.
Costs and Expenses
In fourth-quarter 2008, adjusted cost of sales(1) as a percentage of revenues was 11.7% compared
with 17.7% in fourth-quarter 2007. For the full-year 2008, adjusted cost of sales(1) as a
percentage of revenues was 14.6% compared with 16.0% in 2007, an improvement from our
previous guidance of 15.0% to 15.5%. This improvement reflects the benefits from our cost-
reduction initiatives and foreign exchange. Excluding the impact of foreign exchange, adjusted
cost of sales(1) as a percentage of revenues was 15.6% in fourth-quarter 2008 and 15.2% for the
full-year 2008.
Adjusted selling, informational and administrative (SI&A) expenses(1) were $3.5 billion in
fourth-quarter 2008, a decrease of 23% compared with the prior-year quarter. For the full-year
2008, adjusted SI&A expenses(1) were $14.0 billion, a decrease of 8% compared with 2007.
These decreases were primarily due to the favorable impact of our cost-reduction initiatives. In
addition, higher fourth-quarter 2007 spending levels contributed to the quarter-over-quarter
decline in adjusted SI&A expenses(1). Foreign exchange positively impacted fourth-quarter 2008
8
9. by $103 million and negatively impacted full-year 2008 by $379 million compared with the
respective year-ago periods.
Adjusted research and development (R&D) expenses(1) were $2.2 billion in fourth-quarter 2008,
an increase of 2% compared with the prior-year period. For full-year 2008, adjusted R&D
expenses(1) were $7.5 billion, a decrease of 1% compared with 2007. The increase in fourth-
quarter 2008 is primarily the result of up-front payments totaling $300 million related to the
licensing agreements with Medivation, Inc. and Auxilium Pharmaceuticals, Inc. Both periods
also benefited from the favorable impact of our cost-reduction initiatives.
Overall, operational improvements decreased adjusted total costs(2) by $1.1 billion or 12% in
fourth-quarter 2008 compared with the prior-year period, and foreign exchange decreased
adjusted total costs(2) by $702 million or 8%. Foreign exchange increased full-year 2008
adjusted total costs(2) by $312 million or 1% compared with 2007. Excluding the impact of
foreign exchange, full-year 2008 adjusted total costs(2) decreased by approximately $2.2 billion,
or 7%, compared with 2007. The operational improvement was driven partially by the reduction
in workforce to approximately 81,900 at year-end 2008, a decline of 4,700 compared with the
year-end 2007, as well as manufacturing and research and development site exits.
At the end of fourth-quarter 2008, Pfizer exceeded its goal to reduce absolute adjusted total
costs(2) by at least $2.0 billion by the end of 2008 compared with 2006 on a constant currency
basis(3), realizing a total reduction of $2.8 billion.
Financial Guidance
For full-year 2009, Pfizer’s financial guidance, at current exchange rates(9) is summarized below.
The 2009 financial guidance, in comparison with 2008 financial results, reflects the projected
impact of the strengthening of the U.S. dollar, increased pension expenses and lower interest
income. It also reflects an increase in the effective tax rate resulting from financial strategies in
connection with the proposed acquisition of Wyeth. These factors contributed to a reduction in
our Adjusted Diluted EPS(1) of approximately $0.50.
9
10. 2008 Actual 2009 Guidance
Adjusted Revenues(1) $48.3 billion $44.0 to $46.0 billion
Adjusted Cost of Sales(1) as a Percentage
of Revenues 14.6% 14.5% to 15.5%
Adjusted SI&A Expenses(1) $14.0 billion $13.5 to $14.0 billion
Adjusted R&D Expenses(1) $7.5 billion $7.1 to $7.5 billion
Adjusted Other (Income)/Deductions(1) ($1.4 billion) ($500 to $700 million)
Effective Tax Rate on Adjusted 22.0% Approx. 30%
Income(1)
Reported Diluted EPS(10) $1.20 $1.34 to $1.49
Adjusted Diluted EPS(1) $2.42 $1.85 to $1.95
For additional details, please see the attached financial schedules, product revenue tables,
supplemental information and disclosure notice.
(1) quot;Adjusted incomequot; and its components and quot;adjusted diluted earnings per share (EPS)quot; are
defined as reported net income and its components and reported diluted EPS excluding
purchase-accounting adjustments, acquisition-related costs, discontinued operations and
certain significant items. Adjusted Revenues, Adjusted Cost of Sales, Adjusted SI&A
expenses, Adjusted R&D expenses and Adjusted Other (Income)/Deductions-net are
income statement line items prepared on the same basis, and therefore, components of the
overall adjusted income measure. As described under Adjusted Income in the
Management’s Discussion and Analysis of Financial Condition and Results of Operations
section of Pfizer's Form 10-Q for the fiscal quarter ended September 28, 2008,
management uses adjusted income, among other factors, to set performance goals and to
measure the performance of the overall company. We believe that investors' understanding
of our performance is enhanced by disclosing this measure. Reconciliations of fourth-
quarter 2008 and 2007 and full-year 2008 and 2007 adjusted income and its components
and adjusted diluted EPS to reported net income and its components and reported diluted
EPS, as well as reconciliations of full-year 2009 adjusted income and adjusted diluted EPS
guidance to full-year 2009 reported net income and reported diluted EPS guidance, are
provided in the materials accompanying this report. The adjusted income and its
components and adjusted diluted EPS measures are not, and should not be viewed as,
substitutes for U.S. GAAP net income and its components and diluted EPS.
Represents primarily the total of Adjusted Cost of Sales(1), Adjusted SI&A expenses(1) and
(2)
Adjusted R&D expenses(1).
(3) Constant currency basis means that the applicable financial measure is based upon the
actual foreign exchange rates in effect during 2006.
(4) Represents worldwide revenues for all pharmaceutical products, excluding revenues
included in notes (5) and (7).
10
11. (5) Represents worldwide revenues for pharmaceutical products launched since 2006:
Chantix/Champix, Eraxis, Selzentry/Celsentri, Sutent, Thelin and Toviaz.
(6) Total worldwide pharmaceutical revenues excluding the revenues of major products that
have lost exclusivity in the U.S. in 2007 and 2008 as described in note (7). See the table
accompanying this report.
(7) Represents worldwide revenues for pharmaceutical products that lost exclusivity in 2007
and 2008: Camptosar, Norvasc and Zyrtec.
(8) Includes Consumer Healthcare business transition activity, Capsugel and Pfizer
Centersource.
(9) Current exchange rates approximate rates at the time of the fourth-quarter 2008 earnings
press release (January 2009).
(10) Does not assume the completion of any business development transactions not completed
as of December 31, 2008, and excludes the potential effects of litigation-related matters not
substantially resolved as of December 31, 2008, as we do not forecast those items.
Media Investors
Joan Campion 212.733.2798 Suzanne Harnett 212.733.8009
Jennifer Davis 212.733.0717
11
12. PFIZER INC AND SUBSIDIARY COMPANIES
CONSOLIDATED STATEMENTS OF INCOME
(UNAUDITED)
(millions of dollars, except per common share data)
Fourth-Quarter % Incr. / Full-Year % Incr. /
2008 2007 (Decr.) 2008 2007 (Decr.)
$ 12,346 $ 12,870 (4) $ 48,296 $ 48,418 -
Revenues
Costs and expenses:
1,715 2,625 (35) 8,112 11,239 (28)
Cost of sales (a)
3,659 4,653 (21) 14,537 15,626 (7)
Selling, informational and administrative expenses (a)
2,303 2,260 2 7,945 8,089 (2)
Research and development expenses (a)
605 756 (20) 2,668 3,128 (15)
Amortization of intangible assets
66 - * 633 283 123
Acquisition-related in-process research and development charges
1,562 216 623 2,675 2,534 6
Restructuring charges and acquisition-related costs
1,811 (610) * 2,032 (1,759) *
Other (income)/deductions--net
Income from continuing operations before provision
625 2,970 (79) 9,694 9,278 4
for taxes on income and minority interests
394 223 76 1,645 1,023 61
Provision for taxes on income
5 36 (87) 23 42 (45)
Minority interests
226 2,711 (92) 8,026 8,213 (2)
Income from continuing operations
Discontinued operations:
2 (3) * (2) (3) -
Loss from discontinued operations--net of tax
38 16 138 80 (66) *
Gains/(losses) on sales of discontinued operations--net of tax
40 13 194 78 (69) *
Discontinued operations--net of tax
$ 266 $ 2,724 (90) $ 8,104 $ 8,144 -
Net income
Earnings per common share - basic:
$ 0.03 $ 0.40 (93) $ 1.19 $ 1.19 -
Income from continuing operations
0.01 - * 0.01 (0.01) *
Discontinued operations--net of tax
$ 0.04 $ 0.40 (90) $ 1.20 $ 1.18 2
Net income
Earnings per common share - diluted:
$ 0.03 $ 0.40 (93) $ 1.19 $ 1.18 1
Income from continuing operations
0.01 - * 0.01 (0.01) *
Discontinued operations--net of tax
$ 0.04 $ 0.40 (90) $ 1.20 $ 1.17 3
Net income
Weighted-average shares used to calculate earnings per common share:
6,720 6,774 6,727 6,917
Basic
6,739 6,792 6,750 6,939
Diluted
(a) Exclusive of amortization of intangible assets, except as discussed in footnote 4 below.
* Calculation not meaningful.
Certain amounts and percentages may reflect rounding adjustments.
1. The above financial statements present the three-month and twelve-month periods ended December 31 of each year.
Subsidiaries operating outside the United States are included for the three-month and twelve-month periods ended November 30
of each year
2. The financial results for the full year ended December 31, 2007, include pre-tax charges of $2.8 billion, virtually all of which were
recorded in the third quarter of 2007, associated with the impairment of Exubera assets and the decision to exit and stop additional
investment in the product. These charges include approximately $1.1 billion of intangible asset impairments, $661 million of
inventory write-offs, $454 million of fixed asset impairments, and $578 million of other exit costs. The charges are primarily included in
Cost of sales ($2.6 billion), Selling, informational and administrative expenses ($85 million), and Research and development expenses ($100 million).
3. As required through December 31, 2008, the estimated value of Acquisition-related in-process research and development charges (IPR&D) is
expensed at acquisition date. During 2008, we expensed $633 million of IPR&D, primarily related to our acquisitions of Serenex, Inc.,
Encysive Pharmaceuticals, Inc., CovX, Coley Pharmaceutical Group, Inc. and a number of animal health product lines from Schering-
Plough Corporation, as well as two smaller acquisitions also related to Animal Health. In the first quarter of 2007, we expensed $283
million of IPR&D, primarily related to our acquisitions of BioRexis Pharmaceutical Corp. and Embrex, Inc.
4. Amortization expense related to acquired intangible assets that contribute to our ability to sell, manufacture, research, market and
distribute our products are included in Amortization of intangible assets as they benefit multiple business functions. Amortization
expense related to acquired intangible assets that are associated with a single function are included in Cost of sales , Selling,
informational and administrative expenses or Research and development expenses , as appropriate.
5. Other (income)/deductions--net for the full year ended December 31, 2008, includes charges of approximately $900 million, recorded in the third
quarter of 2008, associated with the resolution of certain litigation involving our non-steroidal anti-inflammatory pain medicines and charges
of approximately $2.3 billion, recorded in the fourth quarter of 2008, resulting from an agreement in principle to resolve previously
disclosed investigations regarding allegations of past off-label promotional practices concerning Bextra, as well as other open investigations.
6. Provision for taxes on income includes tax benefits in the full year ended December 31, 2008, of approximately $305 million related to
favorable tax settlements and of approximately $426 million related to the sale of one of our biopharmaceutical companies (Esperion
Therapeutics Inc.), both recorded in the second quarter of 2008. Provision for taxes on income includes a tax benefit of $278 million
in the fourth quarter of 2007 and a tax benefit of $958 million for full-year 2007 relating to charges associated with Exubera. Provision
for taxes on income for fourth-quarter and full-year 2008 also reflects the impact of the fourth-quarter 2008 legal settlement provisions,
which are either not deductible or deductible at lower tax rates.
13. PFIZER INC AND SUBSIDIARY COMPANIES
RECONCILIATION OF REPORTED NET INCOME AND ITS COMPONENTS AND REPORTED DILUTED EPS
TO ADJUSTED INCOME AND ITS COMPONENTS AND ADJUSTED DILUTED EPS
(UNAUDITED)
(millions of dollars, except per common share data)
Quarter Ended December 31, 2008
Purchase Acquisition- Certain
Accounting Related Discontinued Significant
Adjustments Costs Operations Items(2)
Reported Adjusted
$ 12,346 $ -$ -$ -$ (35) $ 12,311
Revenues
Costs and expenses:
1,715 - - - (271) 1,444
Cost of sales (a)
3,659 3 - - (152) 3,510
Selling, informational and administrative expenses (a)
2,303 (6) - - (85) 2,212
Research and development expenses (a)
605 (560) - - - 45
Amortization of intangible assets
66 (66) - - - -
Acquisition-related in-process R&D charges
1,562 - (13) - (1,549) -
Restructuring charges and acquisition-related costs
1,811 (2) - - (2,452) (643)
Other (income)/deductions--net
Income from continuing operations before provision
625 631 13 - 4,474 5,743
for taxes on income and minority interests
394 190 4 - 761 1,349
Provision for taxes on income
5 - - - - 5
Minority interests
226 441 9 - 3,713 4,389
Income from continuing operations
Discontinued operations:
2 - - (2) - -
Income/(loss) from discontinued operations--net of tax
38 - - (38) - -
Gains/(losses) on sales of discontinued operations--net of tax
40 - - (40) - -
Discontinued operations--net of tax
$ 266 $ 441 $ 9$ (40) $ 3,713 $ 4,389
Net income
Earnings per common share - diluted:
0.07 $
$ 0.03 $ -$ -$ 0.55 $ 0.65
Income from continuing operations
0.01 - - (0.01) - -
Discontinued operations--net of tax
0.07 $
$ 0.04 $ -$ (0.01) $ 0.55 $ 0.65
Net income
Twelve Months Ended December 31, 2008
Purchase Acquisition- Certain
Accounting Related Discontinued Significant
Adjustments Costs Operations Items(2)
Reported Adjusted
$ 48,296 $ -$ -$ -$ 45 $ 48,341
Revenues
Costs and expenses:
8,112 - - - (1,072) 7,040
Cost of sales (a)
14,537 12 - - (505) 14,044
Selling, informational and administrative expenses (a)
7,945 (28) - - (429) 7,488
Research and development expenses (a)
2,668 (2,525) - - - 143
Amortization of intangible assets
633 (633) - - - -
Acquisition-related in-process R&D charges
2,675 - (49) - (2,626) -
Restructuring charges and acquisition-related costs
2,032 (5) - - (3,413) (1,386)
Other (income)/deductions--net
Income from continuing operations before provision
9,694 3,179 49 - 8,090 21,012
for taxes on income and minority interests
1,645 740 10 - 2,228 4,623
Provision for taxes on income
23 - - - - 23
Minority interests
8,026 2,439 39 - 5,862 16,366
Income from continuing operations
Discontinued operations:
(2) - - 2 - -
Income/(loss) from discontinued operations--net of tax
80 - - (80) - -
Gains/(losses) on sales of discontinued operations--net of tax
78 - - (78) - -
Discontinued operations--net of tax
$ 8,104 $ 2,439 $ 39 $ (78) $ 5,862 $ 16,366
Net income
Earnings per common share - diluted:
0.36 $
$ 1.19 $ -$ -$ 0.87 $ 2.42
Income from continuing operations
0.01 - - (0.01) - -
Discontinued operations--net of tax
0.36 $
$ 1.20 $ -$ (0.01) $ 0.87 $ 2.42
Net income
(a) Exclusive of amortization of intangible assets, except as discussed in note 1.
See end of tables for notes.
Certain amounts may reflect rounding adjustments.
14. PFIZER INC AND SUBSIDIARY COMPANIES
RECONCILIATION OF REPORTED NET INCOME AND ITS COMPONENTS AND REPORTED DILUTED EPS
TO ADJUSTED INCOME AND ITS COMPONENTS AND ADJUSTED DILUTED EPS
(UNAUDITED)
(millions of dollars, except per common share data)
Quarter Ended December 31, 2007
Purchase Acquisition- Certain
Accounting Related Discontinued Significant
Adjustments Costs Operations Items(2)
Reported Adjusted
$ 12,870 $ -$ -$ -$ (75) $ 12,795
Revenues
Costs and expenses:
2,625 - - - (359) 2,266
Cost of sales (a)
4,653 3 - - (124) 4,532
Selling, informational and administrative expenses (a)
2,260 (7) - - (93) 2,160
Research and development expenses (a)
756 (721) - - - 35
Amortization of intangible assets
- - - - - -
Acquisition-related in-process R&D charges
216 - (3) - (213) -
Restructuring charges and acquisition-related costs
(610) (2) - - 219 (393)
Other (income)/deductions--net
Income from continuing operations before provision/(benefit)
2,970 727 3 - 495 4,195
for taxes on income and minority interests
223 219 (4) - 319 757
Provision/(benefit) for taxes on income
36 - - - - 36
Minority interests
2,711 508 7 - 176 3,402
Income from continuing operations
Discontinued operations:
(3) - - 3 - -
Income/(loss) from discontinued operations--net of tax
16 - - (16) - -
Gains/(losses) on sales of discontinued operations--net of tax
13 - - (13) - -
Discontinued operations--net of tax
$ 2,724 $ 508 $ 7$ (13) $ 176 $ 3,402
Net income
Earnings per common share - diluted:
0.07 $
$ 0.40 $ -$ -$ 0.03 $ 0.50
Income from continuing operations
- - - - - -
Discontinued operations--net of tax
0.07 $
$ 0.40 $ -$ -$ 0.03 $ 0.50
Net income
Twelve Months Ended December 31, 2007
Purchase Acquisition- Certain
Accounting Related Discontinued Significant
Adjustments Costs Operations Items(2)
Reported Adjusted
$ 48,418 $ -$ -$ -$ (209) $ 48,209
Revenues
Costs and expenses:
11,239 (49) - - (3,497) 7,693
Cost of sales (a)
15,626 12 - - (418) 15,220
Selling, informational and administrative expenses (a)
8,089 (29) - - (516) 7,544
Research and development expenses (a)
3,128 (3,013) - - - 115
Amortization of intangible assets
283 (283) - - - -
Acquisition-related in-process R&D charges
2,534 - (11) - (2,523) -
Restructuring charges and acquisition-related costs
(1,759) (22) - - 235 (1,546)
Other (income)/deductions--net
Income from continuing operations before provision
9,278 3,384 11 - 6,510 19,183
for taxes on income and minority interests
1,023 873 1 - 2,131 4,028
Provision for taxes on income
42 - - - - 42
Minority interests
8,213 2,511 10 - 4,379 15,113
Income from continuing operations
Discontinued operations:
(3) - - 3 - -
Income/(loss) from discontinued operations--net of tax
(66) - - 66 - -
Gains/(losses) on sales of discontinued operations--net of tax
(69) - - 69 - -
Discontinued operations--net of tax
$ 8,144 $ 2,511 $ 10 $ 69 $ 4,379 $ 15,113
Net income
Earnings per common share - diluted:
0.37 $
$ 1.18 $ -$ -$ 0.63 $ 2.18
Income from continuing operations
(0.01) - - 0.01 - -
Discontinued operations--net of tax
0.37 $
$ 1.17 $ -$ 0.01 $ 0.63 $ 2.18
Net income
(a) Exclusive of amortization of intangible assets, except as discussed in note 1.
See end of tables for notes.
Certain amounts may reflect rounding adjustments.
15. PFIZER INC AND SUBSIDIARY COMPANIES
NOTES TO RECONCILIATION OF REPORTED NET INCOME AND ITS COMPONENTS AND
REPORTED DILUTED EPS TO ADJUSTED INCOME AND ITS COMPONENTS AND ADJUSTED DILUTED EPS
(UNAUDITED)
1) Amortization expense related to acquired intangible assets that contribute to our ability to sell, manufacture, research, market and
distribute our products are included in Amortization of intangible assets as they benefit multiple business functions. Amortization
expense related to acquired intangible assets that are associated with a single function are included in Cost of sales , Selling,
informational and administrative expenses or Research and development expenses , as appropriate.
2) Certain significant items includes the following:
Fourth Quarter Twelve Months
2008 2007 2008 2007
(millions of dollars)
Restructuring charges - Cost-reduction initiatives (a) $ 1,549 $ 256 $ 2,626 $ 2,523
Implementation costs - Cost-reduction initiatives (b) 465 525 1,605 1,389
Legal matters(c) 56
2,313 (5) 3,249
Returns liability adjustment(d) - - -
217
Asset impairment charges and other associated costs(e) 98 (6) 213 2,798
Consumer Healthcare business transition activity(f) (4) (2) (7) (26)
Other 53 (273) 187 (230)
Total certain significant items, pre-tax 4,474 495 8,090 6,510
Income taxes(g) (761) (319) (2,228) (2,131)
Total certain significant items--net of tax $ 3,713 $ 176 $ 5,862 $ 4,379
(a) Included in Restructuring charges and acquisition-related costs.
(b) Included in Cost of sales ($225 million), Selling, informational and administrative expenses ($143 million), Research and development
expenses ($85 million), and Other (income)/deductions - net ($12 million) for the three months ended December 31, 2008. Included
in Cost of sales ($745 million), Selling, informational and administrative expenses ($413 million), Research and development expenses
($433 million), and Other (income)/deductions - net ($14 million) for the full year ended December 31, 2008. Included in
Cost of sales ($263 million), Selling, informational and administrative expenses ($136 million), Research and development expenses ($124 million),
and Other (income)/deductions - net ($2 million) for the three months ended December 31, 2007. Included in Cost of sales ($700 million), Selling,
informational and administrative expenses ($334 million), Research and development expenses ($416 million), and Other (income)/deductions - net ($61
million income) for the full year ended December 31, 2007.
(c) Included in Other (income)/deductions - net and for the full year ended December 31, 2008, includes charges of approximately $900 million,
recorded in the third quarter of 2008, associated with the resolution of certain litigation involving our non-steroidal anti-inflammatory pain
medicines and charges of approximately $2.3 billion, recorded in the fourth quarter of 2008, resulting from an agreement in principle to
resolve previously disclosed investigations regarding allegations of past off-label promotional practices concerning Bextra, as well as
other open investigations.
(d) Included in Revenues in the third quarter of 2008 and reflects an adjustment to the prior years' liability for product returns.
(e) The financial results for the full year ended December 31, 2007, include charges primarily related to the decision to exit Exubera which
are comprised of approximately $1.1 billion of intangible asset impairments, $661 million of inventory write-offs, $454 million of fixed asset
impairments and $578 million of other exit costs. The charges are primarily included in Cost of sales ($2.6 billion), Selling, informational and
administrative expenses ($85 million) and Research and development expenses ($100 million).
(f) Included in Revenues ($35 million) and Cost of sales ($31 million) for the three months ended December 31, 2008. Included in
Revenues ($172 million), Cost of sales ($162 million) and Selling, informational and administrative expenses ($3 million) for the full year
ended December 31, 2008. Included in Revenues ($75 million), Cost of sales ($73 million), Selling, informational and administrative
expenses ($3 million), and Other (income)/deductions - net ($3 million income) for the three months ended December 31, 2007.
Included in Revenues ($219 million), Cost of sales ($194 million), Selling, informational and administrative expenses ($15 million), and Other (income)/
deductions - net ($16 million income) for the full year ended December 31, 2007.
(g) Included in Provision for taxes on income and for the full year ended December 31, 2008, includes approximately $426 million recorded
in the second quarter of 2008 related to the sale of one of our biopharmaceutical companies (Esperion Therapeutics Inc.). Provision
for taxes on income for fourth-quarter and full-year 2008 also reflects the impact of the fourth-quarter 2008 legal settlement provisions, which
are either not deductible or deductible at lower tax rates.
18. PFIZER INC AND SUBSIDIARY COMPANIES
RECONCILIATION FROM REPORTED PHARMACEUTICAL REVENUES TO TOTAL
(2)
IN-LINE AND NEW PRODUCTS PHARMACEUTICAL REVENUES
(UNAUDITED)
(millions of dollars)
Worldwide
Fourth Quarter % Incr. / Full Year % Incr. /
2008 2007 (Decr.) 2008 2007 (Decr.)
Total reported Pharmaceutical revenues $ 11,241 $ 11,702 (4) $ 44,174 $ 44,424 (1)
Norvasc 542 650 (16) 2,244 3,001 (25)
Camptosar 112 256 (56) 563 969 (42)
Zyrtec/Zyrtec D 4 267 (99) 129 1,541 (92)
Other (1) - - - (217) - *
Total in-line products and new products(2)
Pharmaceutical revenues $ 10,583 $ 10,529 1 $ 41,455 $ 38,913 7
U.S.
Fourth Quarter % Incr. / Full Year % Incr. /
2008 2007 (Decr.) 2008 2007 (Decr.)
Total reported Pharmaceutical revenues $ 4,803 $ 5,261 (9) $ 18,851 $ 21,548 (13)
Norvasc 17 26 (34) 76 603 (87)
Camptosar (4) 142 * 82 539 (85)
Zyrtec/Zyrtec D 4 267 (99) 129 1,541 (92)
(1)
Other - - - (157) - *
(2)
Total in-line products and new products
Pharmaceutical revenues $ 4,786 $ 4,826 (1) $ 18,721 $ 18,865 (1)
International
Fourth Quarter % Incr. / Full Year % Incr. /
2008 2007 (Decr.) 2008 2007 (Decr.)
Total reported Pharmaceutical revenues $ 6,438 $ 6,441 - $ 25,323 $ 22,876 11
Norvasc 525 624 (16) 2,168 2,398 (10)
Camptosar 116 114 2 481 430 12
Zyrtec/Zyrtec D - - - - - -
Other (1) - - - (60) - *
Total in-line products and new products(2)
Pharmaceutical revenues(3) $ 5,797 $ 5,703 2 $ 22,734 $ 20,048 13
Certain amounts and percentages may reflect rounding adjustments.
(1) Represents an adjustment recorded in third-quarter 2008 to the prior years' liability for product returns.
(2) Total in-line and new products Pharmaceutical revenues, which exclude the revenues of major products that have lost
(1)
exclusivity in the U.S. since the beginning of 2007 and a prior years' returns liability adjustment , is an alternative view of our
Pharmaceutical revenues, and we believe that investors’ understanding of Pharmaceutical revenues is enhanced by disclosing this
performance measure. Norvasc lost its U.S. exclusivity in March 2007 and Camptosar lost its U.S. exclusivity in February 2008,
and as is typical in the pharmaceutical industry, this has resulted in a dramatic decline in revenues due to generic competition.
Zyrtec/Zyrtec D lost its U.S. exclusivity in January 2008 and we ceased marketing the product in late January 2008. We believe
that excluding the impact of these products assists the reader in understanding the dynamics of our diverse Pharmaceutical
product portfolio in 2008. Because of its non-standardized definition, this total in-line and new products Pharmaceutical
revenues measure has limitations as it may not be comparable with the calculation of similar measures of other companies.
This additional revenue measure is not, and should not be viewed as, a substitute for the U.S. GAAP comparison of
Pharmaceutical revenues.
(3) Total in-line and new products Pharmaceutical international revenues reflect a unfavorable impact in the fourth quarter
ended December 31, 2008, and a favorable impact for the full year ended December 31, 2008, due primarily to changes in foreign
exchange rates.
19. PFIZER INC
SUPPLEMENTAL INFORMATION
1) Change in Revenues
The strengthening of the U.S. dollar relative to other currencies, primarily the euro, U.K. pound, and
Canadian dollar, unfavorably impacted our revenues by approximately $380 million, or 3%, in fourth-
quarter 2008, compared to the same period in 2007. The weakening of the U.S. dollar relative to other
currencies, primarily the euro, Japanese yen and Canadian dollar, favorably impacted our revenues by
approximately $1.6 billion, or 3%, in full-year 2008, compared to full-year 2007.
Reported revenues in full-year 2008 include a reduction of $217 million, to adjust our prior years’
liabilities for product returns. In third-quarter 2008, after a detailed review of our returns experience, we
determined that our previous methodology needed to be revised, as the lag time between product sale
and return was actually much longer than we had previously assumed. Although recorded in third-
quarter 2008, virtually all of the adjustment relates back several years. We have also reviewed our
expense calculations for the prior years and determined that the expense recorded in those years was not
materially different from what would have been recorded under our revised approach.
2) Change in Cost of Sales
Reported cost of sales decreased 35% in fourth-quarter 2008, compared to the same period in 2007, and
decreased 28% in full-year 2008, compared to full-year 2007. The decrease for fourth-quarter 2008
primarily reflects a favorable impact from foreign exchange and the savings impact of our cost-reduction
initiatives. The decrease for full-year 2008 primarily reflects a $2.6 billion charge in third-quarter 2007
related to our decision to exit Exubera, the savings impact of our cost-reduction initiatives and a
favorable impact from foreign exchange, partially offset by higher implementation costs associated with
our cost-reduction initiatives.
Reported cost of sales included implementation charges related to our cost-reduction initiatives of $225
million for fourth-quarter 2008, $745 million for full-year 2008, $263 million for fourth-quarter 2007,
and $700 million for full-year 2007.
Reported cost of sales also included $31 million for fourth-quarter 2008, $162 million for full-year 2008,
$73 million for fourth-quarter 2007 and $194 million for full-year 2007, related to business-transition
activities associated with the sale of our Consumer Healthcare business, completed in December 2006.
This continuing activity is transitional in nature and generally results from agreements that seek to
facilitate the orderly transfer of operations of our former Consumer Healthcare business to the new
owner.
Reported cost of sales as a percentage of revenues decreased 6.5 percentage points to 13.9% in fourth
quarter 2008, compared to the same period in 2007, reflecting the favorable impact of our cost-
reduction initiatives and the impact of foreign exchange, as well as lower implementation costs
associated with our cost-reduction initiatives. Reported cost of sales as a percentage of revenues
decreased 6.4 percentage points to 16.8% in full-year 2008, compared to full-year 2007, reflecting a $2.6
billion charge in third-quarter 2007 related to our decision to exit Exubera, the favorable impact of our
cost-reduction initiatives and the impact of foreign exchange, partially offset by higher implementation
costs associated with our cost-reduction initiatives.
1
20. 3) Change in Selling, Informational & Administrative (SI&A) Expenses and Research &
Development (R&D) Expenses
Reported SI&A expenses decreased 21% in fourth-quarter 2008, reflecting the savings associated with
our cost-reduction initiatives and a favorable impact from foreign exchange. Reported SI&A expenses
decreased 7% in full-year 2008, compared to the same periods in 2007, reflecting the savings associated
with our cost-reduction initiatives and a $85 million charge in 2007 related to our decision to exit
Exubera, partially offset by an unfavorable impact from foreign exchange and the impact of higher
implementation costs associated with our cost-reduction initiatives.
Reported SI&A expenses included implementation charges related to our cost-reduction initiatives of
$143 million for fourth-quarter 2008, $413 million for full-year 2008, $136 million for fourth-quarter
2007 and $334 million for full-year 2007.
Reported R&D expenses, excluding acquisition-related in-process research and development charges
(IPR&D), increased 2% in fourth-quarter 2008, and decreased 2% in full-year 2008, compared to the
same periods in 2007. The increase for fourth-quarter 2008 was primarily due to an up-front payment to
Medivation, Inc. in connection with our collaboration agreement to develop and commercialize
Dimebon, partially offset by a favorable impact from foreign exchange and the realization of savings
associated with our cost-reduction initiatives. The decrease for full-year 2008 compared to full-year 2007
was primarily due to the collaboration payments made to Bristol-Myers Squibb Company in second-
quarter 2007 in connection with our collaboration to develop and commercialize apixaban and a $100
million charge in 2007 related to our decision to exit Exubera, in addition to the realization of savings
associated with our cost-reduction initiatives, partially offset by the up-front payment to Medivation,
Inc. in the fourth quarter of 2008 and higher R&D spending related to Phase 3 clinical trials in 2008.
Reported R&D expenses included implementation charges related to our cost-reduction initiatives of
$85 million for fourth-quarter 2008, $433 million for full-year 2008, $124 million for fourth-quarter 2007
and $416 million for full-year 2007.
IPR&D charges of $633 million in 2008 primarily related to our acquisitions of Serenex, Inc., Encysive
Pharmaceuticals, Inc., CovX, Coley Pharmaceutical Group, Inc. and a number of animal health product
lines from Schering-Plough Corporation, as well as two smaller acquisitions also related to Animal
Health. IPR&D charges in 2007 of $283 million primarily related to our acquisitions of BioRexis
Pharmaceutical Corp. and Embrex, Inc.
4) Asset Impairment Charges and Other Costs Associated with Exiting Exubera
In third-quarter 2007, after an assessment of the financial performance of Exubera, an inhalable form of
insulin for the treatment of diabetes, as well as its lack of acceptance by patients, physicians and payers,
we decided to exit the product.
Total pre-tax charges for 2007 were $2.8 billion and were primarily included in Cost of sales ($2.6 billion),
Selling, informational and administrative expenses ($85 million), and Research and development expenses ($100
million). Total pre-tax charges for 2008 were not significant.
2
21. 5) Other Income and Other Deductions
($ millions) Fourth Quarter Full Year
2008 2007* 2008 2007*
Net Interest Income(a) $(284) $(285) $(772) $(1,099)
Royalty Income (54) (55) (248) (224)
Net Gains on Asset Disposals (419) (237) (439) (326)
Legal matters(b) 2,366 (7) 3,300 46
Other, Net 202 (26) 191 (156)
Other (Income)/Deductions-Net $1,811 $(610) $2,032 $(1,759)
*Certain prior period amounts were reclassified to conform to the current period presentation.
(a) The decreases in net interest income in fourth-quarter and full-year 2008, compared to the same
periods in 2007, were due primarily to lower net financial assets and lower interest rates.
(b) In third-quarter 2008, we recorded charges of approximately $900 million related to our agreements
in principle to resolve certain litigation involving our non-steroidal anti-inflammatory pain medicines
and in fourth-quarter 2008, we recorded charges of approximately $2.3 billion resulting from an
agreement in principle to resolve previously disclosed investigations regarding allegations of past off-
label promotional practices concerning Bextra, as well as other open investigations.
6) Effective Tax Rate
The effective tax rate on reported Income from continuing operations before provision for taxes on income and
minority interests for fourth-quarter 2008 was a 63.1% cost compared to a 7.5% cost in fourth-quarter
2007, and in full-year 2008 was a 17.0% cost compared to a 11.0% cost for full-year 2007. The higher
tax rates for 2008 reflect the impact of the fourth-quarter 2008 legal settlement provisions, which are
either not deductible or deductible at lower tax rates, and higher acquired IPR&D expenses in 2008,
which are primarily not deductible for tax purposes, partially offset by tax benefits recorded in second-
quarter 2008 of $305 million related to favorable tax settlements for multiple tax years and $426 million
related to the sale of one of our biopharmaceutical companies (Esperion Therapeutic Inc.). The lower
tax rates in 2007 reflect a tax benefit in 2007 related to charges associated with Exubera.
The effective tax rate on adjusted income(1) was a cost of 23.5% in fourth-quarter 2008, a cost of 18.1%
in fourth-quarter 2007, a cost of 22.0% in full-year 2008 and a cost of 21.0% in full-year 2007. The
higher rates on adjusted income(1) in 2008 reflects a change in jurisdictional mix of income, partially
offset by the $305 million in tax benefits related to the resolution of tax issues noted above.
On October 3, 2008, the Tax Extenders and Alternative Minimum Tax Relief Act (the Extenders Act)
extended the research and development tax credit from January 1, 2008 through December 31, 2009.
3
22. This research and development credit reduced income tax expense for fourth-quarter 2008 by
approximately $110 million.
7) Reconciliation of 2009 Adjusted Income(1) and Adjusted Diluted EPS(1) Guidance to 2009
Reported Net Income and Reported Diluted EPS Guidance
Full-Year 2009 Guidance
Net Income(a) Diluted EPS(a)
($ billions, except per-share amounts)
Income/(Expense)
Adjusted Income/Diluted EPS(1) Guidance ~$12.5 - $13.2 ~$1.85 - $1.95
Purchase Accounting Impacts:
Business Development Transactions Completed as of
(1.8) (0.26)
12/31/08
Costs Related to Cost-Reduction Initiatives (1.3 – 1.7) (0.20 – 0.25)
Reported Net Income/Diluted EPS Guidance ~$9.0 - $10.1 ~$1.34 - $1.49
(a) Does not assume the completion of any business-development transactions not completed as of
December 31, 2008 and excludes potential effects of litigation-related matters not substantially
resolved as of December 31, 2008, as we do not forecast those items.
________________
(1)
“Adjusted income” and “adjusted diluted earnings per share (EPS)” are defined as reported net
income and reported diluted EPS excluding purchase-accounting adjustments, acquisition-related costs,
discontinued operations and certain significant items. As described under Adjusted Income in the
Management’s Discussion and Analysis of Financial Condition and Results of Operations section of
Pfizer’s Form 10-Q for the quarterly period ended September 28, 2008, management uses adjusted
income, among other factors, to set performance goals and to measure the performance of the overall
company. We believe that investors’ understanding of our performance is enhanced by disclosing this
measure. The adjusted income and adjusted diluted EPS measures are not, and should not be viewed as,
substitutes for U.S. GAAP net income and diluted EPS.
4