VIP Kolkata Call Girl Jodhpur Park 👉 8250192130 Available With Room
RYDERFINAL 1Q06FinancialInfo
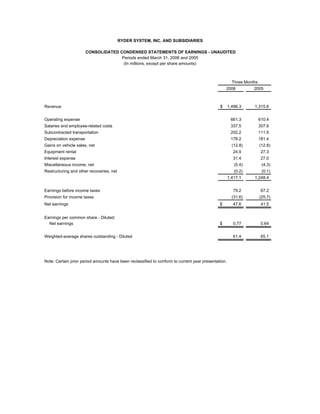
1. RYDER SYSTEM, INC. AND SUBSIDIARIES
CONSOLIDATED CONDENSED STATEMENTS OF EARNINGS - UNAUDITED
Periods ended March 31, 2006 and 2005
(In millions, except per share amounts)
Three Months
2006 2005
Revenue $ 1,496.3 1,315.6
Operating expense 661.3 610.4
Salaries and employee-related costs 337.5 307.6
Subcontracted transportation 202.2 111.9
Depreciation expense 178.2 181.4
Gains on vehicle sales, net (12.8) (12.8)
Equipment rental 24.9 27.3
Interest expense 31.4 27.0
Miscellaneous income, net (5.4) (4.3)
Restructuring and other recoveries, net (0.2) (0.1)
1,417.1 1,248.4
Earnings before income taxes 79.2 67.2
Provision for income taxes (31.6) (25.7)
Net earnings $ 47.6 41.5
Earnings per common share - Diluted:
Net earnings $ 0.77 0.64
Weighted-average shares outstanding - Diluted 61.4 65.1
Note: Certain prior period amounts have been reclassified to conform to current year presentation.
2. RYDER SYSTEM, INC. AND SUBSIDIARIES
CONSOLIDATED CONDENSED BALANCE SHEETS - UNAUDITED
PRELIMINARY AND SUBJECT TO RECLASSIFICATION
(Dollars in millions)
March 31, December 31,
2006 2005
Assets:
Cash and cash equivalents $ 75.6 128.7
Other current assets 1,080.9 1,035.1
Revenue earning equipment, net 3,909.1 3,794.4
Operating property and equipment, net 487.1 486.8
Other assets 572.6 588.3
$ 6,125.3 6,033.3
Liabilities and shareholders' equity:
Short-term debt / Current portion of long-term debt $ 263.0 269.4
Other current liabilities 951.3 984.0
Long-term debt 2,035.8 1,916.0
Other non-current liabilities (including deferred income taxes) 1,351.6 1,336.4
Shareholders' equity 1,523.6 1,527.5
$ 6,125.3 6,033.3
SELECTED KEY RATIOS
March 31, December 31,
2006 2005
Debt to equity 151% 143%
Total obligations to equity (a) * 159% 151%
Twelve months ended March 31,
2006 2005
Return on average shareholders' equity (b) 15.0% 15.3%
Return on average assets (b) 3.9% 4.0%
Return on capital* 7.9% 7.7%
(a) Total obligations represent debt plus off-balance sheet equipment obligations.
(b) Includes discontinued operations and the effect of accounting changes.
* Non-GAAP financial measure; see reconciliation to closest GAAP financial measure included within this
release.
Note: Certain prior period amounts have been reclassified to conform to current year presentation.
3. RYDER SYSTEM, INC. AND SUBSIDIARIES
BUSINESS SEGMENT REVENUE AND EARNINGS - UNAUDITED
Periods ended March 31, 2006 and 2005
(Dollars in millions)
Three Months
2006 2005 B(W)
Revenue:
Fleet Management Solutions:
Full service lease $ 451.4 $ 441.7 2.2%
Contract maintenance 32.7 33.4 (2.0%)
Contract-related maintenance 47.3 49.0 (3.6%)
Commercial rental 149.9 152.7 (1.8%)
Other 18.1 16.6 9.3%
Fuel 281.8 231.2 21.8%
Total Fleet Management Solutions 981.2 924.6 6.1%
Supply Chain Solutions 469.5 346.8 35.4%
Dedicated Contract Carriage 138.7 128.0 8.4%
Eliminations (93.1) (83.8) (11.0%)
Total revenue $ 1,496.3 1,315.6 13.7%
Business segment earnings:
Earnings before income taxes:
Fleet Management Solutions $ 74.9 70.9 5.7%
Supply Chain Solutions 10.7 6.5 63.8%
Dedicated Contract Carriage 8.5 5.9 43.7%
Eliminations (7.9) (7.6) (3.2%)
86.2 75.7 13.9%
Unallocated Central Support Services (7.2) (8.6) 16.0%
Earnings before restructuring and
other recoveries, net and income taxes 79.0 67.1 17.7%
Restructuring and other recoveries, net 0.2 0.1 137.3%
Earnings before income taxes 79.2 67.2 17.8%
Provision for income taxes (31.6) (25.7) (22.9%)
Net earnings $ 47.6 41.5 14.7%
Note: Certain prior period amounts have been reclassified to conform to current year presentation.
Amounts may not recalculate due to rounding.
4. RYDER SYSTEM, INC. AND SUBSIDIARIES
BUSINESS SEGMENT INFORMATION - UNAUDITED
Periods ended March 31, 2006 and 2005
(Dollars in millions)
Three Months
2006 2005 B(W)
Fleet Management Solutions
Total revenue $ 981.2 924.6 6.1%
Fuel revenue (281.8) (231.2) 21.8%
Operating revenue * $ 699.4 693.4 0.9%
Segment earnings before income taxes $ 74.9 70.9 5.7%
Earnings before income taxes as % of total revenue 7.6% 7.7%
Earnings before income taxes as % of operating revenue * 10.7% 10.2%
Supply Chain Solutions
Total revenue $ 469.5 346.8 35.4%
Subcontracted transportation (197.1) (108.7) 81.3%
Operating revenue * $ 272.4 238.1 14.4%
Segment earnings before income taxes $ 10.7 6.5 63.8%
Earnings before income taxes as % of total revenue 2.3% 1.9%
Earnings before income taxes as % of operating revenue * 3.9% 2.7%
Memo: Fuel costs $ 24.9 20.2 (23.1%)
Dedicated Contract Carriage
Total revenue $ 138.7 128.0 8.4%
Subcontracted transportation (5.1) (3.2) 60.4%
Operating revenue * $ 133.6 124.8 7.0%
Segment earnings before income taxes $ 8.5 5.9 43.7%
Earnings before income taxes as % of total revenue 6.1% 4.6%
Earnings before income taxes as % of operating revenue * 6.3% 4.7%
Memo: Fuel costs $ 25.0 20.6 (21.4%)
* Non-GAAP financial measure
Note: Certain prior period amounts have been reclassified to conform to current year presentation.
Amounts may not recalculate due to rounding.
5. RYDER SYSTEM, INC. AND SUBSIDIARIES
NON-GAAP FINANCIAL MEASURE RECONCILIATIONS - PRELIMINARY AND UNAUDITED
(In millions, except per share amounts)
FREE CASH FLOW RECONCILIATION Three months ended March 31
2006 2005
Net cash provided by (used in) operating activities $ 117.2 (22.6)
Net cash used in investing activities (225.0) (359.2)
Free cash flow * $ (107.8) (381.8)
DEBT TO EQUITY RECONCILIATION March 31, December 31,
2006 % to Equity % to Equity
2005
On-balance sheet debt $ 2,298.8 151% $ 2,185.4 143%
Off-balance sheet debt - PV of minimum lease payments and guaranteed
residual values under operating leases for vehicles (a) 117.1 117.0
Total obligations * $ 2,415.9 159% $ 2,302.4 151%
RETURN ON CAPITAL RECONCILIATION
Reconciliation of Return On Capital (ROC) to the GAAP measure net earnings is as follows:
Twelve months ended March 31
2006 2005
Net earnings * (12-month rolling period) $ 233.0 $ 222.1
- Discontinued operations (1.7) -
+ Cumulative effect of changes in accounting principles 2.4 -
+ Income taxes 135.3 120.2
Adjusted earnings before income taxes 369.0 342.3
- Restructuring - gain on sale of headquarters - (23.4)
+ Adjusted interest expense (b) 131.5 109.2
- Adjusted income taxes (c) (194.0) (162.0)
= Adjusted net earnings for ROC (numerator) $ 306.5 $ 266.1
Average total debt $ 2,214.8 $ 1,847.3
+ Average off-balance sheet debt 136.8 157.2
+ Average adjusted total shareholders' equity (d) 1,551.9 1,450.4
= Adjusted average total capital (denominator) $ 3,903.5 $ 3,454.9
Adjusted ROC 7.9% 7.7%
Three months
ended June 30
EPS RECONCILIATION
2005
Earnings per share $ 0.98
Less: Tax change 0.12
Earnings per share excluding tax change * $ 0.86
Notes:
(a) Discounted at the incremental borrowing rate at lease inception.
(b) Interest expense includes implied interest on off-balance sheet vehicle obligations.
(c) Income taxes was calculated using the effective income tax rate for the period exclusive of Ohio tax benefit
recognized June 2005.
(d) Represents shareholders' equity adjusted for discontinued operations, accounting changes and Ohio tax
benefit in those periods.
* Non-GAAP financial measure
Earnings per share amounts are calculated independently for each component and may not be additive due to rounding.
Certain prior period amounts have been reclassified to conform to current year presentation.