1. Celanese Corporation
Investor Relations
Corporate News Release 1601 West LBJ Freeway
Dallas, Texas 75234-6034
Celanese Corporation Reports Third Quarter Results; Adjusts 2008 Outlook
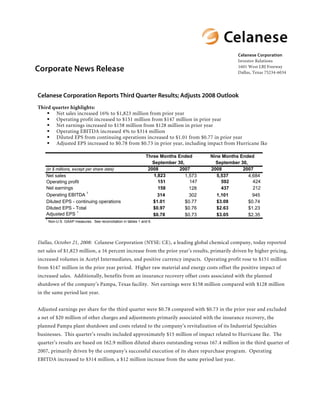
Third quarter highlights:
Net sales increased 16% to $1,823 million from prior year
Operating profit increased to $151 million from $147 million in prior year
Net earnings increased to $158 million from $128 million in prior year
Operating EBITDA increased 4% to $314 million
Diluted EPS from continuing operations increased to $1.01 from $0.77 in prior year
Adjusted EPS increased to $0.78 from $0.73 in prior year, including impact from Hurricane Ike
Three Months Ended Nine Months Ended
September 30, September 30,
2008 2007 2008 2007
(in $ millions, except per share data)
1,823 5,537
Net sales 1,573 4,684
147 424
151 592
Operating profit
Net earnings 212
158 437
128
1
Operating EBITDA 314 1,101
302 945
$1.01 $3.08
Diluted EPS - continuing operations $0.77 $0.74
$0.97 $2.63
Diluted EPS - Total $0.76 $1.23
1
Adjusted EPS $0.78 $3.05
$0.73 $2.35
1
Non-U.S. GAAP measures. See reconciliation in tables 1 and 6.
Dallas, October 21, 2008: Celanese Corporation (NYSE: CE), a leading global chemical company, today reported
net sales of $1,823 million, a 16 percent increase from the prior year’s results, primarily driven by higher pricing,
increased volumes in Acetyl Intermediates, and positive currency impacts. Operating profit rose to $151 million
from $147 million in the prior year period. Higher raw material and energy costs offset the positive impact of
increased sales. Additionally, benefits from an insurance recovery offset costs associated with the planned
shutdown of the company’s Pampa, Texas facility. Net earnings were $158 million compared with $128 million
in the same period last year.
Adjusted earnings per share for the third quarter were $0.78 compared with $0.73 in the prior year and excluded
a net of $20 million of other charges and adjustments primarily associated with the insurance recovery, the
planned Pampa plant shutdown and costs related to the company’s revitalization of its Industrial Specialties
businesses. This quarter’s results included approximately $15 million of impact related to Hurricane Ike. The
quarter’s results are based on 162.9 million diluted shares outstanding versus 167.4 million in the third quarter of
2007, primarily driven by the company’s successful execution of its share repurchase program. Operating
EBITDA increased to $314 million, a $12 million increase from the same period last year.
2. Page 2 of 13
“Celanese continued to execute on its strategic objectives and delivered solid results in a challenging economic
environment,” said David Weidman, chairman and chief executive officer. “We believe that our leading global
franchises and our integrated business model position us to deliver value and provide a more stable earnings
platform in such an environment. However, we did begin to see the impact of recessionary trends in Europe
during the quarter and have not seen indications of a near-term recovery in North America.”
Year to Date 2008
Net sales for the first nine months of 2008 were $5,537 million compared with $4,684 million in the same period
last year, driven by higher pricing, additional volumes in the Acetyl Intermediates business and positive currency
impacts. Operating profit was $592 million compared with $424 million in the prior year period. The 2007
results included a long-term management compensation program paid upon the exit of the company’s private
equity sponsor. Operating EBITDA for the first nine months of 2008 was $1,101 million, up 17 percent from the
first nine months of 2007. Adjusted earnings per share were $3.05, a 30 percent increase from last year’s results.
Recent Highlights
Safely resumed operations at production facilities located in the Gulf Coast following a controlled and
successful shutdown due to Hurricane Ike.
Announced plans to build a new Vectra® liquid crystal polymer (LCP) production facility co-located at
the Celanese integrated chemical complex in Nanjing, China. The facility is projected to be operational
in 2010.
Began construction of the world’s largest, state-of-the-art polyacetal plant at Höchst Industrial Park.
The facility is expected to be operational in 2011 and will replace Ticona’s existing production
operations in Kelsterbach, Germany.
Received Green Partner certification from Sony Corporation at its Ticona plant in Shelby, N.C. The
certification recognizes suppliers’ cooperation of eco-friendly products and their ability to meet
established regulations for environment-related substances found in components of products that bear
the Sony name.
Third Quarter Segment Overview
Advanced Engineered Materials
Advanced Engineered Materials’ continued success with its expansion strategy in Asia and increased penetration
in new automotive applications helped to offset the impact of significantly reduced automotive demand and
higher raw material and energy costs in the quarter. Net sales were $272 million, a $14 million increase from last
year’s results, driven by the company’s recent pricing actions and positive currency impacts. Significant declines
in the U.S. and European automotive industry, however, resulted in overall lower volumes for the business. Sales
in Asia, related to the business’ expansion strategy, increased for all product lines. Operating profit was $13
million compared with $35 million in the same period last year, as the pricing increases could not offset lower
volumes and significantly higher raw material and energy costs in the period. Operating EBITDA was $45
million, a $25 million decrease from last year’s results. Advanced Engineered Materials’ strategic equity affiliates
were impacted by the same macroeconomic and cost factors and contributed $6 million less in net earnings
compared to last year.
3. Page 3 of 13
Consumer Specialties
Consumer Specialties continued to generate stable earnings, driven by its expansion in Asia and the successful
integration of its acquired Acetate Products Limited (APL) business. Net sales increased to $295 million, a $13
million increase from last year’s results. The increase was driven by higher pricing on continued strong demand
and positive currency impacts. These increases were partially offset by lower volumes resulting from reduced
flake sales as the company shifted flake production to its China ventures. Operating profit was $42 million, $8
million higher than the prior year period, due to lower spending primarily related to synergies from the acquired
APL business and the higher pricing. Operating EBITDA was $56 million compared with $53 million in the
prior year period.
Industrial Specialties
The revitalization strategy for Industrial Specialties, focused on manufacturing optimization and higher value-
added applications, continued to deliver improved earnings in the quarter. Net sales were $378 million, a $64
million increase from the same period last year, primarily driven by higher pricing across all business lines and
favorable currency effects. The higher pricing was driven by continued strong demand for polyvinyl alcohol and
specialty polymers, and higher raw material costs across the business. A soft North American and European
construction market resulted in continued weakness in demand for emulsions products. Volume was slightly
higher in comparison to last year’s results due to the impact of the force majeure related to the unplanned outage
at the company’s Clear Lake, Texas, facility in 2007. Operating profit was $18 million compared with a loss of $9
million in the prior year period. Last year’s results included plant shutdown and severance costs associated with
the company’s revitalization efforts. Operating EBITDA, which excludes these strategic costs, was $36 million
compared with $18 million in the prior year period.
Acetyl Intermediates
Acetyl Intermediates’ results benefited from its strategic expansions in Asia and attractive acetyl industry
fundamentals. Net sales were $1,056 million, a 22 percent increase from the prior year period, primarily driven
by higher pricing and increased volumes. Price increases, primarily in the Americas and Europe, were attributed
to formula-based pricing on raw material increases and also to market tightness in the Americas. Higher overall
volumes in the quarter were driven by increased availability of acetic acid compared with 2007 results that were
impacted by the unplanned outage of the acetic acid unit at the company’s Clear Lake, Texas, facility. Operating
profit was $100 million, a $17 million decrease from the prior year period. This quarter’s results included the
impact of Hurricane Ike and $28 million of asset impairment and severance charges related to the planned
shutdown of the company’s Pampa, Texas, facility, which is scheduled for early 2009. These items were partially
offset by an insurance recovery of $23 million related to the 2007 outage at the Clear Lake facility. Operating
EBITDA, which excludes the impact of the planned Pampa plant shutdown and the insurance recovery, was $182
million compared with $178 million in the same period last year. The increase was primarily driven by higher
dividends from the company’s Ibn Sina cost investment.
4. Page 4 of 13
Other Activities
Other Activities primarily consists of corporate costs, including financing and administrative activities, certain
other operating entities, including the captive insurance companies, and intersegment eliminations. Operating
EBITDA in the third quarter was ($5) million compared with ($17) million in the prior year period. Included in
the 2008 results were approximately $9 million of foreign exchange benefits. These benefits were mostly offset by
similar foreign exchange losses reported in the business segments and in interest expense. The company expects
Other Activities to total between ($90) million and ($100) million for the full year.
Taxes
The tax rate for adjusted earnings per share was 26 percent in the third quarter of 2008 compared with 28 percent
in the third quarter of 2007. The U.S. GAAP effective tax rate for continuing operations for the third quarter of
2008 was negative 8 percent compared with 1 percent in the third quarter of 2007. The lower effective tax rate in
2008 is primarily due to a decrease in the U.S. tax effect on foreign earnings and dividends. The 2007 effective
tax rate included a tax benefit for revaluation of deferred taxes following a German tax rate reduction. The tax
rate for adjusted earnings per share is based upon the company’s previous guidance which did not include these
items. Cash taxes for the first three quarters of 2008 were $85 million, or $89 million lower than the prior year
period. This decrease is primarily due to reduced U.S. cash tax payments as a result of utilizing net operating loss
carryforwards and the timing of German tax refunds.
Equity and Cost Investments
Earnings from equity investments and dividends from cost investments, which are reflected in the company’s
adjusted earnings and operating EBITDA, totaled $54 million in the third quarter of 2008 compared with $53
million in the same period last year. Higher dividends from the company’s Ibn Sina cost affiliate offset lower
earnings from the company’s Advanced Engineered Materials equity affiliates. Equity and cost investment
dividends, which are included in cash flows, were $42 million versus $43 million in the prior year period.
Cash Flow
During the first nine months of 2008, the company generated $345 million in cash from operating activities, a
$66 million increase from the prior year period, on stronger operating performance and lower cash taxes. The
improved performance was partially offset by increases in trade working capital. Last year’s results included
expenses related to a long-term management compensation program.
Cash used in financing activities during the first nine months of 2008 was $402 million compared with $760
million in the same period last year. Results for the first nine months of 2007 included debt repayments and one-
time costs associated with the company’s debt refinancing transaction.
Cash and cash equivalents at the end of the third quarter were $584 million, a decrease of $241 million from the
end of 2007. During the first nine months of 2008, the company repurchased approximately $378 million of its
outstanding common shares and has approximately $22 million in authorized purchases remaining. Net debt at
the end of the third quarter was $3,036 million, an increase of $305 million from the end of 2007.
5. Page 5 of 13
Outlook
“We believe that the quality of our franchises, fiscal discipline and focus on operational excellence will continue
to create value for our shareholders in this challenging economic environment,” said Weidman. “While the
impact of today’s environment on our industry, our customers, and therefore, our short-term performance is
uncertain, we remain confident in our ability to execute our strategic objectives.”
For the remainder of 2008, the company expects the economic slowdown in North America and Europe to
continue and also sees recent signs of slowing growth in Asia linked to the global credit crisis. Due to these
factors, and their impact on overall volumes, the company updated its full year 2008 outlook for adjusted
earnings per share to between $3.40 and $3.55 from its previous guidance range of between $3.60 and $3.85. The
company’s guidance is based on a tax rate of 26 percent and a year-end weighted average of 165 million diluted
shares outstanding. The company also adjusted its full year 2008 operating EBITDA guidance range to between
$1,320 million and $1,355 million from its previous guidance range of between $1,355 million and $1,415 million.
Contacts:
Investor Relations Media – U.S. Media - Europe
Mark Oberle W. Travis Jacobsen Jens Kurth
Phone: +1 972 443 4464 Phone: +1 972 443 3750 Phone: +49 69 305 7137
Telefax: +1 972 443 8519 Telefax: +1 972 443 8519 Telefax: +49 69 305 36787
Mark.Oberle@celanese.com William.Jacobsen@celanese.com J.Kurth@celanese.com
As a global leader in the chemicals industry, Celanese Corporation makes products essential to everyday living. Our
products, found in consumer and industrial applications, are manufactured in North America, Europe and Asia. Net
sales totaled $6.4 billion in 2007, with approximately 70% generated outside of North America. Known for
operational excellence and execution of its business strategies, Celanese delivers value to customers around the globe
with innovations and best-in-class technologies. Based in Dallas, Texas, the company employs approximately 8,400
employees worldwide. For more information on Celanese Corporation, please visit the company's website at
www.celanese.com.
6. Page 6 of 13
Forward-Looking Statements
This release may contain “forward-looking statements,” which include information concerning the company’s plans, objectives, goals, strategies,
future revenues or performance, capital expenditures, financing needs and other information that is not historical information. When used in
this release, the words “outlook,” “forecast,” “estimates,” “expects,” “anticipates,” “projects,” “plans,” “intends,” “believes,” and variations of
such words or similar expressions are intended to identify forward-looking statements. All forward-looking statements are based upon current
expectations and beliefs and various assumptions. There can be no assurance that the company will realize these expectations or that these beliefs
will prove correct. There are a number of risks and uncertainties that could cause actual results to differ materially from the forward-looking
statements contained in this release. Numerous factors, many of which are beyond the company’s control, could cause actual results to differ
materially from those expressed as forward-looking statements. Certain of these risk factors are discussed in the company’s filings with the
Securities and Exchange Commission. Any forward-looking statement speaks only as of the date on which it is made, and the company
undertakes no obligation to update any forward-looking statements to reflect events or circumstances after the date on which it is made or to
reflect the occurrence of anticipated or unanticipated events or circumstances.
Reconciliation of Non-U.S. GAAP Measures to U.S. GAAP
This release reflects five performance measures, operating EBITDA, affiliate EBITDA, adjusted earnings per share, net debt and adjusted free cash
flow, as non-U.S. GAAP measures. The most directly comparable financial measure presented in accordance with U.S. GAAP in our consolidated
financial statements for operating EBITDA is operating profit; for affiliate EBITDA is equity in net earnings of affiliates; for adjusted earnings
per share is earnings per common share-diluted; for net debt is total debt; and for adjusted free cash flow is cash flow from operations.
Use of Non-U.S. GAAP Financial Information
Operating EBITDA, a measure used by management to measure performance, is defined as operating profit from continuing
operations, plus equity in net earnings from affiliates, other income and depreciation and amortization, and further adjusted for other
charges and adjustments. We provide guidance on operating EBITDA and are unable to reconcile forecasted operating EBITDA to a
GAAP financial measure because a forecast of Other Charges and Adjustments is not practical. Our management believes operating
EBITDA is useful to investors because it is one of the primary measures our management uses for its planning and budgeting processes
and to monitor and evaluate financial and operating results. Operating EBITDA is not a recognized term under U.S. GAAP and does
not purport to be an alternative to operating profit as a measure of operating performance or to cash flows from operating activities as
a measure of liquidity. Because not all companies use identical calculations, this presentation of operating EBITDA may not be
comparable to other similarly titled measures of other companies. Additionally, operating EBITDA is not intended to be a measure of
free cash flow for management’s discretionary use, as it does not consider certain cash requirements such as interest payments, tax
payments and debt service requirements nor does it represent the amount used in our debt covenants.
Affiliate EBITDA, a measure used by management to measure performance of its equity investments, is defined as the proportional
operating profit plus the proportional depreciation and amortization of its equity investments. Affiliate EBITDA, including Celanese
Proportional Share of affiliate information on Table 8, is not a recognized term under U.S. GAAP and is not meant to be an
alternative to operating cash flow of the equity investments. The company has determined that it does not have sufficient ownership
for operating control of these investments to consider their results on a consolidated basis. The company believes that investors should
consider affiliate EBITDA when determining the equity investments’ overall value in the company.
Adjusted earnings per share is a measure used by management to measure performance. It is defined as net earnings (loss) available to
common shareholders plus preferred dividends, adjusted for other charges and adjustments, and divided by the number of basic
common shares, diluted preferred shares, and options valued using the treasury method. We provide guidance on an adjusted earnings
per share basis and are unable to reconcile forecasted adjusted earnings per share to a GAAP financial measure without unreasonable
effort because a forecast of Other Items is not practical. We believe that the presentation of this non-U.S. GAAP measure provides
useful information to management and investors regarding various financial and business trends relating to our financial condition
and results of operations, and that when U.S. GAAP information is viewed in conjunction with non-U.S. GAAP information, investors
are provided with a more meaningful understanding of our ongoing operating performance. This non-U.S. GAAP information is not
intended to be considered in isolation or as a substitute for U.S. GAAP financial information.
The tax rate used for adjusted earnings per share is the tax rate based on our initial guidance, less changes in uncertain tax positions.
We adjust this tax rate during the year only if there is a substantial change in our underlying operations; an updated forecast would
not necessarily result in a change to our tax rate used for adjusted earnings per share. The adjusted tax rate may differ significantly
from the tax rate used for U.S. GAAP reporting in any given reporting period. It is not practical to reconcile our prospective adjusted
tax rate to the actual U.S. GAAP tax rate in any future period.
Net debt is defined as total debt less cash and cash equivalents. We believe that the presentation of this non-U.S. GAAP measure
provides useful information to management and investors regarding changes to the company’s capital structure. Our management and
credit analysts use net debt to evaluate the company's capital structure and assess credit quality. This non-U.S. GAAP information is
not intended to be considered in isolation or as a substitute for U.S. GAAP financial information.
Adjusted free cash flow is defined as cash flow from operations less capital expenditures, other productive asset purchases, operating
cash from discontinued operations and certain other charges and adjustments. We believe that the presentation of this non-U.S.
GAAP measure provides useful information to management and investors regarding changes to the company’s cash flow. Our
management and credit analysts use adjusted free cash flow to evaluate the company’s liquidity and assess credit quality. This non-
U.S. GAAP information is not intended to be considered in isolation or as a substitute for U.S. GAAP financial information.
Results Unaudited
The results presented in this release, together with the adjustments made to present the results on a comparable basis, have not been audited and
are based on internal financial data furnished to management. Quarterly results should not be taken as an indication of the results of operations
to be reported for any subsequent period or for the full fiscal year.
7. Page 7 of 13
Preliminary Consolidated Statements of Operations- Unaudited
Three Months Ended Nine Months Ended
September 30, September 30,
(in $ millions, except per share data) 2008 2007 2008 2007
Net sales 1,823 1,573 5,537 4,684
Cost of sales (1,490) (1,236) (4,390) (3,651)
Gross profit 333 337 1,147 1,033
Selling, general and administrative expenses (142) (133) (416) (371)
1
Amortization of Intangibles (19) (18) (58) (53)
Research and development expenses (18) (18) (59) (54)
Other (charges) gains, net (1) (12) (24) (118)
Foreign exchange gain (loss), net (1) - 3 0
Gain (loss) on disposition of assets, net (1) (9) (1) (13)
Operating profit 151 147 592 424
Equity in net earnings of affiliates 19 24 46 65
Interest expense (65) (63) (195) (196)
Refinancing expenses - - - (256)
Interest income 8 9 27 34
Dividend income - cost investments 35 29 138 93
Other income (expense), net 4 (15) 9 (30)
Earnings (loss) from continuing operations
before tax and minority interests 152 131 617 134
Income tax (provision) benefit 12 (1) (106) (6)
Minority interests - - 1 -
Earnings (loss) from continuing operations 164 130 512 128
Earnings (loss) from discontinued operations:
Earnings ( loss) from operation of discontinued operations (8) - (120) 38
- - 47
Gain on disposal of discontinued operations -
2 (2) 45 (1)
Income tax (provision) benefit
(2) (75) 84
Earnings (loss) from discontinued operations (6)
Net earnings (loss) 158 128 437 212
Cumulative preferred stock dividends (3) (2) (8) (7)
Net earnings (loss) available to common
shareholders 155 126 429 205
Earnings (loss) per common share - basic:
Continuing operations $1.09 $0.85 $3.36 $0.78
Discontinued operations (0.04) (0.01) (0.50) 0.54
Net earnings (loss) available to common shareholders $1.05 $0.84 $2.86 $1.32
Earnings (loss) per common share - diluted:
Continuing operations $1.01 $0.77 $3.08 $0.74
Discontinued operations (0.04) (0.01) (0.45) 0.49
Net earnings (loss) available to common shareholders $0.97 $0.76 $2.63 $1.23
Weighted average shares - basic 147.1 150.2 150.0 155.4
Weighted average shares - diluted 162.9 167.4 166.0 172.1
1
Customer related intangibles
8. Page 8 of 13
Preliminary Consolidated Balance Sheets - Unaudited
September 30, December 31,
2008 2007
(in $ millions)
ASSETS
Current assets:
584
Cash and cash equivalents 825
Receivables:
1,013
Trade - third party and affiliates, net 1,009
346
Other 437
743
Inventories 636
68
Deferred income taxes 70
17
Marketable securities, at fair value 46
49
Other assets 40
Total current assets 2,820 3,063
779
Investments 814
2,527
Property, plant and equipment, net 2,362
69
Deferred income taxes 10
202
Marketable securities, at fair value 209
370
Other assets 309
816
Goodwill 866
389
Intangible assets, net 425
Total assets 7,972 8,058
LIABILITIES AND SHAREHOLDERS' EQUITY
Current liabilities:
Short-term borrowings and current
302
installments of long-term debt - third party and affiliates 272
754
Trade payables - third parties and affiliates 818
561
Other liabilities 888
29
Deferred income taxes 30
52
Income taxes payable 23
Total current liabilities 1,698 2,031
3,318
Long-term debt 3,284
243
Deferred income taxes 265
238
Uncertain tax positions 220
651
Benefit obligations 696
793
Other liabilities 495
2
Minority interests 5
Shareholders' equity:
-
-
Preferred stock
-
-
Common stock
(403)
(781)
Treasury stock, at cost
492
Additional paid-in capital 469
1,210
Retained earnings 799
108
Accumulated other comprehensive income (loss), net 197
1,029 1,062
Total shareholders' equity
Total liabilities and shareholders' equity 7,972 8,058
9. Page 9 of 13
Table 1
Segment Data and Reconciliation of Operating Profit (Loss) to Operating EBITDA -
a Non-U.S. GAAP Measure
Three Months Ended Nine Months Ended
September 30, September 30,
(in $ millions) 2008 2007 2008 2007
Net Sales
272 866
Advanced Engineered Materials 258 777
295 869
Consumer Specialties 282 832
378 1,129
Industrial Specialties 314 1,015
1,056 3,219
Acetyl Intermediates 864 2,532
1
Other Activities - 1
1 2
(178) (547)
Intersegment eliminations (146) (474)
Total 1,823 1,573 5,537 4,684
Operating Profit (Loss)
13 80
Advanced Engineered Materials 35 103
42 138
Consumer Specialties 34 130
18 55
Industrial Specialties (9) 2
100 425
Acetyl Intermediates 117 340
1
Other Activities (22) (106)
(30) (151)
Total 151 147 592 424
Equity Earnings, Cost - Dividend Income and Other Income (Expense)
12 32
Advanced Engineered Materials 18 48
1 49
Consumer Specialties 2 37
- -
Industrial Specialties - -
33 95
Acetyl Intermediates 28 51
1
Other Activities 12 17
(10) (8)
Total 58 38 193 128
Other Charges and Other Adjustments 2
1 3
Advanced Engineered Materials - 5
- 1
Consumer Specialties 2 11
3 11
Industrial Specialties 14 33
13 33
Acetyl Intermediates 2 28
1
Other Activities 3 18
22 98
Total 20 40 66 175
Depreciation and Amortization Expense
19 58
Advanced Engineered Materials 17 51
13 40
Consumer Specialties 15 39
15 43
Industrial Specialties 13 43
36 102
Acetyl Intermediates 31 81
1
Other Activities 1 4
7
2
Total 85 77 250 218
Operating EBITDA
45 173
Advanced Engineered Materials 70 207
56 228
Consumer Specialties 53 217
36 109
Industrial Specialties 18 78
182 655
Acetyl Intermediates 178 500
1
Other Activities (5) (64)
(17) (57)
Total 314 302 1,101 945
1
Other Activities primarily includes corporate selling, general and administrative expenses and the results from captive insurance companies.
2
See Table 7.
10. Page 10 of 13
Table 2
Factors Affecting Third Quarter 2008 Segment Net Sales Compared to Third Quarter 2007
Other 1
Volume Price Currency Total
(in percent)
Advanced Engineered Materials -6% 6% 5% 0% 5%
Consumer Specialties -3% 6% 2% 0% 5%
Industrial Specialties 1% 15% 5% -1% 20%
Acetyl Intermediates 9% 11% 2% 0% 22%
Total Company 4% 11% 3% -2% 16%
Factors Affecting Nine Months 2008 Segment Net Sales Compared to Nine Months 2007
Other 1
Volume Price Currency Total
(in percent)
Advanced Engineered Materials 2% 2% 7% 0% 11%
Consumer Specialties -6% 5% 3% 2% 4%
Industrial Specialties -7% 13% 7% -2% 11%
Acetyl Intermediates 9% 14% 4% 0% 27%
Total Company 3% 10% 6% -1% 18%
1
Primarily represents net sales from APL (Acetate), divestiture of AT Plastics Films business and captive insurance companies (Total Company).
Table 3
Cash Flow Information
Nine Months Ended
September 30,
(in $ millions) 2008 2007
345
Net cash provided by operating activities 279
1
Net cash provided by (used in) investing activities (169) 196
(402)
Net cash used in financing activities (760)
(15)
Exchange rate effects on cash 25
825
Cash and cash equivalents at beginning of period 791
584 531
Cash and cash equivalents at end of period
1
2008 includes $311 million of cash received and $122 million of capital expenditures related to the Ticona Kelsterbach plant relocation.
Table 4
Cash Dividends Received
Three Months Ended Nine Months Ended
September 30, September 30,
(in $ millions) 2008 2007 2008 2007
7 62
Dividends from equity investments 14 54
35 138
Dividends from cost investments 29 93
Total 42 43 200 147
11. Page 11 of 13
Table 5
Net Debt - Reconciliation of a Non-U.S. GAAP Measure
September 30, December 31,
2008 2007
(in $ millions)
Short-term borrowings and current
302
installments of long-term debt - third party and affiliates 272
3,318
Long-term debt 3,284
3,620 3,556
Total debt
584
Less: Cash and cash equivalents 825
Net Debt 3,036 2,731
Table 6
Adjusted Earnings (Loss) Per Share - Reconciliation of a Non-U.S. GAAP Measure
Three Months Ended Nine Months Ended
September 30, September 30,
2008 2007 2008 2007
(in $ millions, except per share data)
Earnings (loss) from continuing operations
before tax and minority interests 152 617
131 134
Non-GAAP Adjustments:
1
Other charges and other adjustments 20 66
40 175
- 254
- -
Refinancing costs
Adjusted Earnings (loss) from continuing operations
before tax and minority interests 172 683
171 563
2
Income tax (provision) benefit on adjusted earnings (45) (178)
(48) (158)
-
- 1
Minority interests -
Adjusted Earnings (loss) from continuing operations 127 123 506 405
(3) (8)
Preferred dividends (2) (7)
Adjusted net earnings (loss) available to common shareholders 124 121 498 398
3 8
Add back: Preferred dividends 2 7
Adjusted net earnings (loss) for adjusted EPS 127 123 506 405
Diluted shares (millions)
147.1 150.0
Weighted average shares outstanding 150.2 155.4
12.0
12.0
12.0
Assumed conversion of Preferred Shares 12.0
0.3
0.6
0.4
Assumed conversion of Restricted Stock 0.4
4.8 4.4
3.4
3.4
Assumed conversion of stock options
162.9 166.0
Total diluted shares 167.4 172.1
Adjusted EPS 0.78 0.73 3.05 2.35
1
See Table 7 for details
2
The adjusted tax rate for the three and nine months ended September 30, 2008 is 26% based on the forecasted adjusted tax rate for 2008.
12. Page 12 of 13
Table 7
Reconciliation of Other Charges and Other Adjustments
Other Charges:
Three Months Ended Nine Months Ended
September 30, September 30,
(in $ millions) 2008 2007 2008 2007
27
8 19
Employee termination benefits 2
4
7
-
Plant/office closures 4
(2)
-
-
Insurance recoveries associated with plumbing cases (2)
74
-
-
Long-term compensation triggered by Exit Event -
9
21
21
Asset impairments 6
-
(23)
(23)
Clear Lake insurance recoveries -
-
(8)
(8)
Sorbates settlement -
3 8
Ticona Kelsterbach plant relocation 1 4
1 -
-
Other 2
Total 1 12 24 118
Other Adjustments: 1
Three Months Ended Nine Months Ended Income
September 30, September 30, Statement
Classification
(in $ millions) 2008 2007 2008 2007
- (2)
Ethylene pipeline exit costs - 10 Other income/expense, net
9 5 27
Business optimization 10 SG&A
- 13 -
Foreign exchange loss related to refinancing transaction 22 Other income/expense, net
(2) - (6)
Ticona Kelsterbach plant relocation - Cost of sales
7 - 14
Plant closures - Cost of sales
- (1) -
Executive severance & other costs related to Squeeze-Out - SG&A
- -
AT Plastics films sale 7 7 Gain on disposition
5 4 9
Other 8 Various
19 28 42 57
Total
20 40 66 175
Total other charges and other adjustments
1
These items are included in net earnings but not included in other charges.
13. Page 13 of 13
Table 8
Equity Affiliate Preliminary Results - Total - Unaudited
Three Months Ended Nine Months Ended
(in $ millions) September 30, September 30,
2008 2007 2008 2007
Net Sales
Ticona Affiliates1 368 315 1,117 934
Infraserv2 566 422 1,706 1,175
Total 934 737 2,823 2,109
Operating Profit
Ticona Affiliates 41 55 116 148
Infraserv 19 61
31 79
Total 72 74 195 209
Depreciation and Amortization
Ticona Affiliates 12 39
16 54
Infraserv 29 21 85 61
Total 45 33 139 100
Affiliate EBITDA3
Ticona Affiliates 57 67 170 187
Infraserv 60 40 164 122
Total 117 107 334 309
Net Income
Ticona Affiliates 21 38 67 98
Infraserv 19 59
24 89
Total 45 57 156 157
Net Debt
Ticona Affiliates 142 142
188 188
Infraserv 358 5 358 5
Total 546 147 546 147
4
Equity Affiliate Preliminary Results - Celanese Proportional Share - Unaudited
Three Months Ended Nine Months Ended
(in $ millions) September 30, September 30,
2008 2007 2008 2007
Net Sales
Ticona Affiliates 170 145 515 432
Infraserv 135 388
182 516
Total 352 280 1,031 820
Operating Profit
Ticona Affiliates 25 70
19 53
Infraserv 6 20
10 24
Total 29 31 77 90
Depreciation and Amortization
Ticona Affiliates 8 6 25 18
Infraserv 9 6 26 20
Total 17 12 51 38
3
Affiliate EBITDA
Ticona Affiliates 27 31 78 88
Infraserv 19 12 50 39
Total 46 43 128 127
Equity in net earnings of affiliates (as reported on the Income Statement)
Ticona Affiliates 18 47
12 31
Infraserv 6 18
7 15
Total 19 24 46 65
5
Affiliate EBITDA in excess of Equity in net earnings of affiliates
Ticona Affiliates 15 13 47 41
Infraserv 6 21
12 35
Total 27 19 82 62
Net Debt
Ticona Affiliates 62 62
86 86
Infraserv 113 3 113 3
Total 199 65 199 65
1
Ticona Affiliates includes PolyPlastics (45% ownership), Korean Engineering Plastics (50%), Fortron Industries (50%), and Una SA (50%)
2
Infraserv includes Infraserv Entities valued as equity investments (Infraserv Höchst Group - 31% ownership, Infraserv Gendorf - 39% and Infraserv Knapsack 27%)
3
Affiliate EBITDA is the sum of Operating Profit and Depreciation and Amortization, a non-U.S. GAAP measure
4
Calculated as the product of figures from the above table times Celanese ownership percentage
5
Product of Celanese proportion of Affiliate EBITDA less Equity in net earnings of affiliates; not included in Celanese operating EBITDA