
Recommended
More Related Content
What's hot
Viewers also liked
Viewers also liked (18)
Similar to .ashland ADC%20info
Similar to .ashland ADC%20info (20)
More from finance29
More from finance29 (20)
Recently uploaded
Recently uploaded (20)
.ashland ADC%20info
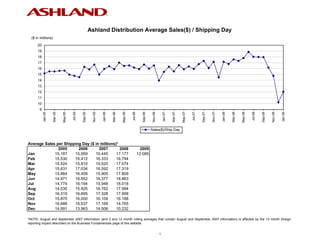
- 1. Ashland Distribution Average Sales($) / Shipping Day ($ in millions) 20 19 18 17 16 15 14 13 12 11 10 9 May-05 May-06 May-07 May-08 Nov-05 Nov-06 Nov-07 Nov-08 Mar-05 Mar-06 Mar-07 Mar-08 Jan-05 Jul-05 Sep-05 Jan-06 Jul-06 Sep-06 Jan-07 Jul-07 Sep-07 Jan-08 Jul-08 Sep-08 Jan-09 Sales($)/Ship Day Average Sales per Shipping Day ($ in millions)* 2005 2006 2007 2008 2009 Jan 15.187 15.959 15.445 17.177 12.065 Feb 15.530 16.412 16.333 16.794 Mar 15.524 15.910 15.520 17.574 Apr 15.631 17.034 16.592 17.319 May 15.664 16.459 15.905 17.809 Jun 14.971 16.552 16.377 18.863 Jul 14.774 16.194 15.948 18.018 Aug 14.535 15.925 16.762 17.994 Sep 16.319 16.695 17.328 17.958 Oct 15.870 16.000 16.109 16.188 Nov 16.688 16.537 17.169 14.765 Dec 14.991 13.963 14.506 10.232 *NOTE: August and September 2007 information (and 3 and 12 month rolling averages that contain August and September 2007 information) is affected by the 13 month foreign reporting impact described on the Business Fundamentals page of this website. 1
- 2. Ashland Distribution Revenue ($ in millions) 450 400 350 300 250 200 May-05 May-06 May-07 May-08 Nov-05 Nov-06 Nov-07 Nov-08 Mar-05 Mar-06 Mar-07 Mar-08 Jan-05 Jul-05 Sep-05 Jan-06 Jul-06 Sep-06 Jan-07 Jul-07 Sep-07 Jan-08 Jul-08 Sep-08 Jan-09 Monthly Sales 12 Month Rolling Average Monthly Sales ($ in millions)* 12 Month Rolling Average ($ in millions)* 2005 2006 2007 2008 2009 2005 2006 2007 2008 2009 Jan 304 335 340 378 253 Jan 288 326 338 343 343 Feb 311 328 327 353 Feb 293 328 338 345 Mar 342 366 341 351 Mar 297 330 336 346 Apr 328 324 332 381 Apr 301 329 337 350 May 329 362 350 374 May 306 332 336 352 Jun 329 364 344 396 Jun 309 335 334 356 Jul 295 324 335 396 Jul 311 337 335 361 Aug 334 366 386 378 Aug 314 340 336 361 Sep 343 334 329 377 Sep 318 339 336 365 Oct 333 352 371 372 Oct 320 341 338 365 Nov 334 331 343 266 Nov 323 341 339 358 Dec 300 265 276 215 Dec 324 338 340 353 *NOTE: August and September 2007 information (and 3 and 12 month rolling averages that contain August and September 2007 information) is affected by the 13 month foreign reporting impact described on the Business Fundamentals page of this website. 2
- 3. Ashland Distribution Gross Profit (%) % 11.0 10.0 9.0 8.0 7.0 6.0 May-05 May-06 May-07 May-08 Nov-05 Nov-06 Nov-07 Nov-08 Mar-05 Mar-06 Mar-07 Mar-08 Jan-05 Jul-05 Sep-05 Jan-06 Jul-06 Sep-06 Jan-07 Jul-07 Sep-07 Jan-08 Jul-08 Sep-08 Jan-09 3 Month Rolling Average 12 Month Rolling Average 3 Month Rolling Average (%)* 12 Month Rolling Average (%)* 2005 2006 2007 2008 2009 2005 2006 2007 2008 2009 Jan 9.9 10.1 8.8 7.6 10.8 Jan 9.6 9.8 9.1 7.5 8.4 Feb 9.7 9.4 8.7 7.2 Feb 9.6 9.8 9.1 7.4 Mar 9.8 9.6 9.0 7.7 Mar 9.7 9.8 8.9 7.3 Apr 9.8 9.7 8.1 7.6 Apr 9.7 9.7 8.7 7.4 May 10.0 9.8 7.3 7.6 May 9.7 9.7 8.4 7.5 Jun 10.0 9.3 7.1 7.8 Jun 9.7 9.6 8.4 7.5 Jul 10.1 9.1 7.3 7.6 Jul 9.8 9.5 8.3 7.4 Aug 9.7 8.8 7.8 7.7 Aug 9.8 9.5 8.2 7.4 Sep 9.3 8.8 7.0 8.1 Sep 9.7 9.5 7.9 7.8 Oct 9.1 8.9 6.9 8.1 Oct 9.7 9.4 7.7 7.7 Nov 9.9 9.0 7.2 8.5 Nov 9.8 9.2 7.7 7.7 Dec 10.2 8.6 7.5 8.6 Dec 9.8 9.1 7.6 8.0 *NOTE: August and September 2007 information (and 3 and 12 month rolling averages that contain August and September 2007 information) is affected by the 13 month foreign reporting impact described on the Business Fundamentals page of this website. 3