More Related Content
Similar to csx D6E96BFD-BB9B-4786-BFED-206E571130AF_AAR2009WK08_csx
Similar to csx D6E96BFD-BB9B-4786-BFED-206E571130AF_AAR2009WK08_csx (20)
csx D6E96BFD-BB9B-4786-BFED-206E571130AF_AAR2009WK08_csx
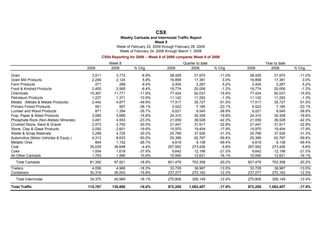
- 1. CSX
Weekly Carloads and Intermodal Traffic Report
Week 8
Week of February 22, 2009 through February 28, 2009
Week of February 24, 2008 through March 1, 2008
CS54 Reporting for 2009 -- Week 8 of 2009 compares Week 9 of 2008
Week 8 Quarter to date Year to date
2009 2008 % Chg 2009 2008 % Chg 2009 2008 % Chg
Grain 3,511 3,772 -6.9% 28,459 31,970 -11.0% 28,459 31,970 -11.0%
Grain Mill Products 2,249 2,124 5.9% 16,858 17,381 -3.0% 16,858 17,381 -3.0%
Farm Products 271 299 -9.4% 2,405 2,287 5.2% 2,405 2,287 5.2%
Food & Kindred Products 2,400 2,565 -6.4% 19,774 20,006 -1.2% 19,774 20,006 -1.2%
Chemicals 10,367 11,771 -11.9% 77,424 92,037 -15.9% 77,424 92,037 -15.9%
Petroleum Products 1,227 1,371 -10.5% 11,142 11,292 -1.3% 11,142 11,292 -1.3%
Metals (Metals & Metals Products) 2,442 4,877 -49.9% 17,517 35,727 -51.0% 17,517 35,727 -51.0%
Primary Forest Products 561 907 -38.1% 5,522 7,180 -23.1% 5,522 7,180 -23.1%
Lumber and Wood Products 871 1,354 -35.7% 6,021 9,545 -36.9% 6,021 9,545 -36.9%
Pulp, Paper & Allied Products 3,085 3,666 -15.8% 24,310 30,309 -19.8% 24,310 30,309 -19.8%
Phosphate Rock (Non-Metalic Minerals) 3,491 4,553 -23.3% 21,059 36,528 -42.3% 21,059 36,528 -42.3%
Crushed Stone, Sand & Gravel 2,573 3,700 -30.5% 21,447 31,917 -32.8% 21,447 31,917 -32.8%
Stone, Clay & Glass Products 2,092 2,601 -19.6% 15,970 19,454 -17.9% 15,970 19,454 -17.9%
Waste & Scrap Materials 3,299 4,725 -30.2% 25,769 37,526 -31.3% 25,769 37,526 -31.3%
Automotive (Motor Vehicles & Equip.) 4,313 8,633 -50.0% 25,389 62,767 -59.6% 25,389 62,767 -59.6%
Metallic Ores 844 1,152 -26.7% 4,619 9,136 -49.4% 4,619 9,136 -49.4%
Coal 35,039 36,648 -4.4% 257,562 273,426 -5.8% 257,562 273,426 -5.8%
Coke 1,004 1,618 -37.9% 9,642 12,199 -21.0% 9,642 12,199 -21.0%
All Other Carloads 1,753 1,585 10.6% 10,590 12,621 -16.1% 10,590 12,621 -16.1%
Total Carloads 81,392 97,921 -16.9% 601,479 753,308 -20.2% 601,479 753,308 -20.2%
Trailers 4,056 4,966 -18.3% 33,729 38,987 -13.5% 33,729 38,987 -13.5%
Containers 30,319 36,003 -15.8% 237,077 270,162 -12.2% 237,077 270,162 -12.2%
Total Intermodal 34,375 40,969 -16.1% 270,806 309,149 -12.4% 270,806 309,149 -12.4%
Total Traffic 115,767 138,890 -16.6% 872,285 1,062,457 -17.9% 872,285 1,062,457 -17.9%