More Related Content
Similar to csx F074F9A7-B3D1-49F4-BF3E-86E0BEC2511E_AAR2009WK10_csx
Similar to csx F074F9A7-B3D1-49F4-BF3E-86E0BEC2511E_AAR2009WK10_csx (20)
csx F074F9A7-B3D1-49F4-BF3E-86E0BEC2511E_AAR2009WK10_csx
- 1. CSX
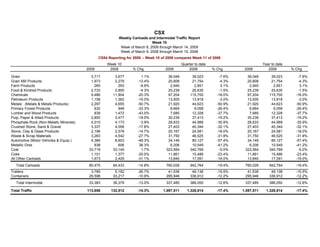
Weekly Carloads and Intermodal Traffic Report
Week 10
Week of March 8, 2009 through March 14, 2009
Week of March 9, 2008 through March 15, 2008
CS54 Reporting for 2009 -- Week 10 of 2009 compares Week 11 of 2008
Week 10 Quarter to date Year to date
2009 2008 % Chg 2009 2008 % Chg 2009 2008 % Chg
Grain 3,717 3,677 1.1% 36,049 39,023 -7.6% 36,049 39,023 -7.6%
Grain Mill Products 1,973 2,279 -13.4% 20,808 21,754 -4.3% 20,808 21,754 -4.3%
Farm Products 265 293 -9.6% 2,940 2,851 3.1% 2,940 2,851 3.1%
Food & Kindred Products 2,733 2,855 -4.3% 25,239 25,635 -1.5% 25,239 25,635 -1.5%
Chemicals 9,486 11,904 -20.3% 97,204 115,700 -16.0% 97,204 115,700 -16.0%
Petroleum Products 1,158 1,362 -15.0% 13,505 13,918 -3.0% 13,505 13,918 -3.0%
Metals (Metals & Metals Products) 2,297 4,655 -50.7% 21,920 44,623 -50.9% 21,920 44,623 -50.9%
Primary Forest Products 632 948 -33.3% 6,664 9,058 -26.4% 6,664 9,058 -26.4%
Lumber and Wood Products 839 1,472 -43.0% 7,685 12,328 -37.7% 7,685 12,328 -37.7%
Pulp, Paper & Allied Products 2,850 3,477 -18.0% 30,239 37,413 -19.2% 30,239 37,413 -19.2%
Phosphate Rock (Non-Metalic Minerals) 4,010 4,173 -3.9% 28,833 44,989 -35.9% 28,833 44,989 -35.9%
Crushed Stone, Sand & Gravel 3,337 4,058 -17.8% 27,403 40,344 -32.1% 27,403 40,344 -32.1%
Stone, Clay & Glass Products 2,198 2,578 -14.7% 20,167 24,581 -18.0% 20,167 24,581 -18.0%
Waste & Scrap Materials 3,283 4,542 -27.7% 31,750 46,525 -31.8% 31,750 46,525 -31.8%
Automotive (Motor Vehicles & Equip.) 4,366 8,603 -49.3% 34,149 80,127 -57.4% 34,149 80,127 -57.4%
Metallic Ores 838 606 38.3% 6,206 10,549 -41.2% 6,206 10,549 -41.2%
Coal 33,719 33,145 1.7% 323,564 340,769 -5.0% 323,564 340,769 -5.0%
Coke 1,101 1,377 -20.0% 11,861 15,486 -23.4% 11,861 15,486 -23.4%
All Other Carloads 1,673 2,429 -31.1% 13,840 17,091 -19.0% 13,840 17,091 -19.0%
Total Carloads 80,475 94,433 -14.8% 760,026 942,764 -19.4% 760,026 942,764 -19.4%
Trailers 3,785 5,162 -26.7% 41,539 49,138 -15.5% 41,539 49,138 -15.5%
Containers 29,598 33,217 -10.9% 295,946 336,912 -12.2% 295,946 336,912 -12.2%
Total Intermodal 33,383 38,379 -13.0% 337,485 386,050 -12.6% 337,485 386,050 -12.6%
Total Traffic 113,858 132,812 -14.3% 1,097,511 1,328,814 -17.4% 1,097,511 1,328,814 -17.4%