SlideShare a Scribd company logo
1 of 9
Download to read offline
ALLTEL CORPORATION
CONSOLIDATED HIGHLIGHTS AND SUPPLEMENTAL OPERATING INFORMATION (UNAUDITED)
(Dollars in millions, except per customer amounts)
                                                                                            THREE MONTHS ENDED                                                                TWELVE MONTHS ENDED
                                                                                                                      Increase                                                                        Increase
                                                                          December 31,         December 31,          (Decrease)                               December 31,        December 31,       (Decrease)
                                                                             2007 (1)               2006              Amount             %                       2007 (1)              2006           Amount        %
Service revenues                                                          $      2,061.1       $       1,851.1      $       210.0         11                  $     7,984.3       $       7,029.8   $      954.5     14
Total revenues and sales                                                  $      2,268.0       $       2,088.2      $       179.8          9                  $     8,803.1       $       7,884.0   $      919.1     12
Operating income (loss)                                                   $       (360.4)      $         363.8      $      (724.2)      (199)                 $        806.4      $       1,357.6   $    (551.2)    (41)
Income (loss) from continuing operations                                  $       (523.4)      $         235.8      $      (759.2)      (322)                 $        184.1      $         823.7   $    (639.6)    (78)
Net income (loss)                                                         $       (525.2)      $         215.9      $      (741.1)      (343)                 $        183.2      $       1,129.4   $    (946.2)    (84)
Capital expenditures (A)                                                  $        341.6       $         454.5      $      (112.9)       (25)                 $     1,086.2       $       1,197.1   $     (110.9)    (9)
Total assets                                                              $    32,135.5        $     18,343.7       $ 13,791.8            75
Service revenue operating margin (B)                                             (17.5%)                19.7%             (37.2%)       (189)                         10.1%                19.3%          (9.2%)     (48)
Operating margin (C)                                                             (15.9%)                17.4%             (33.3%)       (191)                          9.2%                17.2%          (8.0%)     (47)
Service revenue adjusted EBITDA margin (D)                                        37.2%                 38.0%                 (.8%)       (2)                         38.7%                39.2%            (.5%)     (1)
Controlled POPs                                                              79,383,821           78,838,118             545,703           1
Customers                                                                    12,785,193           11,823,938             961,255           8
Penetration rate                                                                   16.1%                 15.0%                 1.1%        7
Average customers                                                            12,585,179           11,676,380             908,799           8                     12,253,760          11,120,780       1,132,980      10
Gross customer additions:
       Internal                                                               1,024,052               898,560            125,492          14                      3,586,287            3,303,907        282,380        9
       Acquired, net of divested                                                  (4,576)             433,339           (437,915)       (101)                         (4,576)            521,530       (526,106)    (101)
       Total                                                                  1,019,476            1,331,899            (312,423)        (23)                     3,581,711            3,825,437       (243,726)      (6)
Net customer additions:
       Internal                                                                 342,684               228,299            114,385          50                        965,831              640,084        325,747       51
       Acquired, net of divested                                                  (4,576)             433,339           (437,915)       (101)                         (4,576)            521,530       (526,106)    (101)
       Total                                                                    338,108               661,638           (323,530)        (49)                       961,255            1,161,614       (200,359)     (17)
Cash costs:
       Cost of services                                                  $         692.4       $         613.7      $         78.7        13                  $     2,625.8       $       2,340.6   $      285.2     12
       Cost of products sold                                                       317.9                 327.1                 (9.2)      (3)                       1,194.0               1,176.9           17.1      1
       Selling, general, administrative and other                                  512.3                 456.8                55.5        12                        1,957.8               1,755.3          202.5     12
       Less product sales                                                          206.9                 237.1               (30.2)      (13)                          818.8                854.2          (35.4)    (4)
       Total                                                             $       1,315.7       $       1,160.5      $       155.2         13                  $     4,958.8       $       4,418.6   $      540.2     12
Cash costs per unit per month (E)                                                 $34.85                $33.13              $1.72          5                         $33.72                $33.11           $.61      2
Revenues:
       Service revenues                                                  $       2,061.1       $       1,851.1      $       210.0         11                  $     7,984.3       $       7,029.8   $      954.5      14
       Less wholesale roaming revenues                                             184.8                 168.2                16.6        10                           705.6                654.3           51.3       8
       Less wholesale transport revenues                                            34.5                  49.9               (15.4)      (31)                          161.9                100.3           61.6      61
       Retail revenues                                                   $       1,841.8       $       1,633.0      $       208.8         13                  $      7,116.8      $       6,275.2   $      841.6      13
Average revenue per customer per month (F)                                        $54.59                $52.84              $1.75          3                         $54.30                $52.68          $1.62       3
Retail revenue per customer per month (G)                                         $48.78                $46.62              $2.16          5                         $48.40                $47.02          $1.38       3
Retail minutes of use per customer per month (H)                                     795                   650                 145        22                             730                  634              96     15
Postpay churn                                                                     1.34%                 1.47%              (.13%)         (9)                         1.28%                1.57%          (.29%)     (18)
Total churn                                                                       1.81%                 1.92%               (.11%)        (6)                         1.79%                2.00%          (.21%)     (11)
(1) Represents the combined results of operations for the Successor and Predecessor periods as presented on pages 2 and 3.
(A) Includes capitalized software development costs.
(B) Service revenue operating margin is calculated by dividing operating income (loss) by service revenues.
(C) Operating margin is calculated by dividing operating income (loss) by total revenues and sales.
(D) Service revenue adjusted EBITDA margin is calculated by dividing adjusted EBITDA by service revenues.
(E) Cash costs per unit per month is calculated by dividing the sum of the reported cost of services, cost of products sold, selling, general, administrative and other expenses less product sales
           by average customers for the period.
(F) Average revenue per customer per month is calculated by dividing service revenues by average customers for the period.
(G) Retail revenue per customer per month is calculated by dividing retail revenues (service revenues less wholesale revenues) by average customers for the period.
(H) Retail minutes of use per customer per month represents the average monthly minutes that Alltel's customers use on both the Company's network and while roaming on other carriers' networks.
                                                                      Adjusted EBITDA has been reconciled to net income (loss) on pages 6 and 7.
                                                                                                           -more-
ALLTEL CORPORATION
CONSOLIDATED STATEMENTS OF OPERATIONS (UNAUDITED)-Page 2
(Millions)


                                                                                                         THREE MONTHS ENDED
                                                                  October 1 -      November 16 -
                                                                 November 15,      December 31,     December 31,      December 31,
                                                                     2007              2007             2007              2006
                                                                 (Predecessor)      (Successor)      (Combined)       (Predecessor)
Revenues and sales:
       Service revenues                                          $      1,034.1    $     1,027.0    $    2,061.1     $      1,851.1
       Product sales                                                      101.0            105.9           206.9              237.1
           Total revenues and sales                                     1,135.1          1,132.9         2,268.0            2,088.2
Costs and expenses:
       Cost of services                                                   337.2            355.2           692.4              613.7
       Cost of products sold                                              145.3            172.6           317.9              327.1
       Selling, general, administrative and other                         263.3            249.0           512.3              456.8
       Depreciation and amortization                                      226.7            260.2           486.9              323.9
       Integration expenses, restructuring and other charges              613.7              5.2           618.9                2.9
           Total costs and expenses                                     1,586.2          1,042.2         2,628.4            1,724.4
Operating income (loss)                                                  (451.1)           90.7           (360.4)             363.8
Equity earnings in unconsolidated partnerships                              8.7              8.0            16.7               14.5
Minority interest in consolidated partnerships                             (3.0)            (2.2)           (5.2)              (9.5)
Other income, net                                                           4.7             15.4            20.1               14.9
Interest expense                                                          (23.0)          (280.4)         (303.4)             (47.6)
Income (loss) from continuing operations before income taxes             (463.7)          (168.5)         (632.2)             336.1
Income tax expense (benefit)                                              (44.3)           (64.5)         (108.8)             100.3
Income (loss) from continuing operations                                 (419.4)          (104.0)         (523.4)             235.8
Income (loss) from discontinued operations                                 (2.4)             0.6            (1.8)             (19.9)
Net income (loss)                                               $        (421.8)   $      (103.4)   $     (525.2)    $        215.9


                                                               -more-
ALLTEL CORPORATION
CONSOLIDATED STATEMENTS OF OPERATIONS-Page 3
(Millions)


                                                                                                        TWELVE MONTHS ENDED
                                                                   January 1 -     November 16 -
                                                                  November 15,     December 31,     December 31,     December 31,
                                                                      2007             2007             2007             2006
                                                                  (Predecessor)     (Successor)      (Combined)      (Predecessor)
Revenues and sales:
       Service revenues                                           $     6,957.3    $     1,027.0    $    7,984.3     $     7,029.8
       Product sales                                                      712.9            105.9           818.8             854.2
           Total revenues and sales                                     7,670.2          1,132.9         8,803.1           7,884.0
Costs and expenses:
       Cost of services                                                 2,270.6            355.2         2,625.8           2,340.6
       Cost of products sold                                            1,021.4            172.6         1,194.0           1,176.9
       Selling, general, administrative and other                       1,708.8            249.0         1,957.8           1,755.3
       Depreciation and amortization                                    1,286.7            260.2         1,546.9           1,239.9
       Integration expenses, restructuring and other charges              667.0              5.2           672.2              13.7
           Total costs and expenses                                     6,954.5          1,042.2         7,996.7           6,526.4
Operating income                                                         715.7             90.7            806.4           1,357.6
Equity earnings in unconsolidated partnerships                             57.2              8.0            65.2              60.1
Minority interest in consolidated partnerships                            (30.4)            (2.2)          (32.6)            (46.6)
Other income, net                                                          23.9             15.4            39.3              84.0
Interest expense                                                         (163.3)          (280.4)         (443.7)           (282.5)
Gain on exchange or disposal of assets and other                           56.5              -              56.5             126.1
Income (loss) from continuing operations before income taxes              659.6           (168.5)          491.1           1,298.7
Income tax expense (benefit)                                              371.5            (64.5)          307.0             475.0
Income (loss) from continuing operations                                 288.1            (104.0)          184.1            823.7
Income (loss) from discontinued operations                                (1.5)              0.6            (0.9)           305.7
Net income (loss)                                                 $      286.6     $      (103.4)   $      183.2     $     1,129.4


                                                               -more-
ALLTEL CORPORATION
CONSOLIDATED BALANCE SHEETS-Page 4
(Millions)


ASSETS                                                                                LIABILITIES AND SHAREHOLDERS' EQUITY

                                              December 31,   December 31,                                                                December 31,    December 31,
                                                  2007           2006                                                                        2007            2006
                                               (Successor)   (Predecessor)                                                                (Successor)    (Predecessor)

CURRENT ASSETS:                                                                       CURRENT LIABILITIES:
  Cash and short-term investments             $      833.3   $       934.2              Current maturities of long-term debt             $      140.1    $       36.3
  Accounts receivable (less allowance for                                               Accounts payable                                        603.6           576.1
     doubtful accounts of $32.6 and                                                     Advance payments and customer deposits                  195.9           186.2
     $54.9, respectively)                            831.1          807.3               Accrued taxes                                           120.4           114.1
  Inventories                                        196.0          218.6               Accrued dividends                                         -              46.0
  Prepaid expenses and other                         142.8           67.7               Accrued interest                                        187.1            79.3
  Assets related to discontinued operations            0.3            4.3               Other current liabilities                               271.9           156.5
                                                                                        Liabilities related to discontinued operations            0.2             2.8
   Total current assets                            2,003.5         2,032.1
                                                                                         Total current liabilities                            1,519.2          1,197.3
Investments                                          536.1           368.9
Goodwill                                          16,917.4         8,447.0
Other intangibles                                  6,784.6         2,129.4            Long-term debt                                         23,374.7          2,697.4
                                                                                      Deferred income taxes                                   2,542.7          1,109.5
PROPERTY, PLANT AND EQUIPMENT:                                                        Other liabilities                                         266.4            677.6
  Land and improvements                              251.1           314.9
  Buildings and improvements                         836.4           955.1               Total liabilities                                   27,703.0          5,681.8
  Operating plant and equipment                    3,650.3         7,933.8
  Information processing                             368.8         1,048.1
  Furniture and fixtures                              99.8           173.8            SHAREHOLDERS' EQUITY:
  Under construction                                 360.1           496.0              Preferred stock                                           -                0.3
                                                                                        Common stock                                              4.5            364.5
   Total property, plant and equipment             5,566.5        10,921.7              Additional paid-in capital                            4,536.7          4,296.8
   Less accumulated depreciation                     164.9         5,690.3              Accumulated other comprehensive income (loss)            (5.3)             9.5
                                                                                        Retained earnings (deficit)                            (103.4)         7,990.8
   Net property, plant and equipment               5,401.6         5,231.4
                                                                                         Total shareholders' equity                           4,432.5         12,661.9
Other assets                                         485.3            89.4
Assets related to discontinued operations              7.0            45.5
                                                                                      TOTAL LIABILITIES AND
TOTAL ASSETS                                  $   32,135.5   $    18,343.7            SHAREHOLDERS' EQUITY                               $   32,135.5    $    18,343.7


                                                                             -more-
ALLTEL CORPORATION
CONSOLIDATED STATEMENTS OF CASH FLOWS-Page 5
(Millions)
                                                                                                                   November 16 -     January 1 -
                                                                                                                   December 31,     November 15,     December 31,
                                                                                                                       2007             2007             2006
                                                                                                                    (Successor)     (Predecessor)    (Predecessor)
Cash Flows from Operating Activities:
   Net income (loss)                                                                                               $      (103.4)   $      286.6     $     1,129.4
   Adjustments to reconcile net income (loss) to net cash provided from (used in) operating activities:
      Loss (income) from discontinued operations                                                                           (0.6)              1.5           (305.7)
      Depreciation and amortization                                                                                       260.2           1,286.7          1,239.9
      Provision for doubtful accounts                                                                                      32.6             171.6            227.3
      Amortization of deferred financing costs                                                                             33.9               2.4              3.9
      Non-cash portion of gain on exchange or disposal of assets and other                                                  -               (56.5)           (80.0)
      Change in deferred income taxes                                                                                     (46.7)             42.9             38.7
      Adjustment to income tax liabilities, including contingency reserves                                                  -               (33.8)           (29.9)
      Other, net                                                                                                           (1.0)             30.2            (17.8)
   Changes in operating assets and liabilities, net of effects of
   acquisitions and dispositions:
      Accounts receivable                                                                                                   (7.7)          (242.2)          (237.0)
      Inventories                                                                                                           11.0             11.6            (20.0)
      Accounts payable                                                                                                    (301.6)           327.7             67.2
      Other current liabilities                                                                                             23.5            309.9           (516.4)
      Other, net                                                                                                           (78.2)             8.1             (9.4)
              Net cash provided from (used in) operating activities                                                       (178.0)         2,146.7          1,490.2
Cash Flows from Investing Activities:
   Additions to property, plant and equipment                                                                             (192.3)          (860.6)        (1,164.5)
   Additions to capitalized software development costs                                                                      (4.2)           (29.1)           (32.6)
   Acquisition of Alltel                                                                                               (25,065.2)             -                -
   Purchases of property, net of cash acquired                                                                               -               (6.5)        (1,760.6)
   Proceeds from the sale of investments                                                                                     -              188.7            200.6
   Proceeds from the return on investments                                                                                  13.8             43.5             50.8
   Other, net                                                                                                                6.0             (1.0)            12.7
              Net cash used in investing activities                                                                    (25,241.9)          (665.0)        (2,693.6)
Cash Flows from Financing Activities:
   Dividends paid on common and preferred stock                                                                              -             (176.6)          (513.1)
   Repayments of long-term debt                                                                                         (1,457.8)           (36.9)        (1,198.5)
   Repurchases of common stock                                                                                               -           (1,360.3)        (1,595.6)
   Cash payments to effect conversion of convertible notes                                                                  (7.3)             -              (67.6)
   Distributions to minority investors                                                                                     (11.2)           (31.8)           (38.2)
   Excess tax benefits from stock option exercises                                                                           -               25.8             12.2
   Cash proceeds from the settlement of interest rate swaps                                                                 33.9              -                -
   Long-term debt issued, net of issuance costs                                                                         22,237.1              -                -
   Common stock issued                                                                                                   4,506.9             63.9            216.0
              Net cash provided from (used in) financing activities                                                     25,301.6         (1,515.9)        (3,184.8)
Cash Flows from Discontinued Operations:
   Cash provided from operating activities                                                                                   0.7             3.2             599.5
   Cash provided from investing activities                                                                                   -              47.7           3,746.6
   Cash used in financing activities                                                                                         -               -                (0.2)
             Net cash provided from discontinued operations                                                                  0.7            50.9           4,345.9
Effect of exchange rate changes on cash and short-term investments                                                           -                -               (5.9)
Increase (decrease) in cash and short-term investments                                                                    (117.6)           16.7             (48.2)
Cash and Short-term Investments:
   Beginning of the period                                                                                                950.9            934.2            982.4
   End of the period                                                                                               $      833.3     $      950.9     $      934.2
                                                                                                          -more-
ALLTEL CORPORATION
RECONCILIATION OF NET INCOME (LOSS) TO ADJUSTED EBITDA (UNAUDITED)-Page 6
(Millions)


                                                                                                                                             THREE MONTHS ENDED
                                                                                                        October 1 -     November 16 -
                                                                                                       November 15,     December 31,    December 31,      December 31,
                                                                                                           2007             2007            2007              2006
                                                                                                       (Predecessor)     (Successor)     (Combined)       (Predecessor)

Net income (loss)                                                                                      $      (421.8)   $     (103.4)   $     (525.2)     $       215.9
   Loss (income) from discontinued operations                                                    (A)             2.4            (0.6)            1.8               19.9
   Income tax expense (benefit)                                                                                (44.3)          (64.5)         (108.8)             100.3
   Interest expense, net of interest income                                                                     18.2           265.0           283.2               32.1
   Depreciation and amortization                                                                               226.7           260.2           486.9              323.9
EBITDA                                                                                                        (218.8)          356.7           137.9              692.1
   Minority interest in consolidated partnerships                                                                3.0             2.2             5.2                9.5
   Equity earnings in unconsolidated partnerships, net of cash distributions received                           (5.5)            5.7             0.2               (0.5)
   Stock-based compensation expense, net of restricted shares surrendered for tax                (C)             3.8             1.2             5.0                7.9
   Integration expenses, restructuring and other charges                                         (D)           613.7             5.2           618.9                2.9
   Non-cash rental income, net of amortization of related deferred leasing costs                 (E)            (4.3)            -              (4.3)              (8.5)
   Other non-cash changes in operating expenses                                                                 (0.2)            0.3             0.1               (0.6)
   Management fee paid to Sponsors                                                               (F)             -               3.9             3.9                -
Adjusted EBITDA                                                                                        $       391.7    $      375.2    $      766.9      $       702.8


                                                                                        -more-
ALLTEL CORPORATION
RECONCILIATION OF NET INCOME (LOSS) TO ADJUSTED EBITDA (UNAUDITED)-Page 7
(Millions)


                                                                                                                                       TWELVE MONTHS ENDED
                                                                                                   January 1 -     November 16 -
                                                                                                  November 15,     December 31,    December 31,     December 31,
                                                                                                      2007             2007            2007             2006
                                                                                                  (Predecessor)     (Successor)     (Combined)      (Predecessor)

Net income (loss)                                                                                 $       286.6    $     (103.4)   $      183.2     $     1,129.4
   Loss (income) from discontinued operations                                               (A)             1.5            (0.6)            0.9            (305.7)
   Income tax expense (benefit)                                                                           371.5           (64.5)          307.0             475.0
   Interest expense, net of interest income                                                               140.8           265.0           405.8             202.2
   Depreciation and amortization                                                                        1,286.7           260.2         1,546.9           1,239.9
EBITDA                                                                                                  2,087.1           356.7         2,443.8           2,740.8
   Minority interest in consolidated partnerships                                                          30.4             2.2            32.6              46.6
   Equity earnings in unconsolidated partnerships, net of cash distributions received                     (14.1)            5.7            (8.4)             (9.4)
   Gain on exchange or disposal of assets and other                                         (B)           (56.5)            -             (56.5)           (126.1)
   Stock-based compensation expense, net of restricted shares surrendered for tax           (C)            26.1             1.2            27.3              33.0
   Integration expenses, restructuring and other charges                                    (D)           667.0             5.2           672.2              13.7
   Non-cash rental income, net of amortization of related deferred leasing costs            (E)           (29.7)            -             (29.7)            (33.9)
   Other non-cash changes in operating expenses                                                             4.7             0.3             5.0              (3.5)
   Management fee paid to Sponsors                                                          (F)             -               3.9             3.9               -
   Pro forma EBITDA for the Midwest Wireless acquisition                                    (G)             -               -               -                91.5
Adjusted EBITDA                                                                                   $     2,715.0    $      375.2    $    3,090.2     $     2,752.7


                                                                                        -more-
ALLTEL CORPORATION
NOTES TO RECONCILIATIONS OF NET INCOME (LOSS) TO ADJUSTED EBITDA
(UNAUDITED) -Page 8


     On November 16, 2007, Alltel Corporation (quot;Alltelquot; or the quot;Companyquot;) was acquired by Atlantis Holdings LLC, a Delaware limited liability company (quot;Atlantis Holdingsquot; or quot;Parentquot;) and an affiliate of private investment funds
     TPG Partners V, L.P. and GS Capital Partners VI Fund, L.P. (together the quot;Sponsorsquot;). The acquisition was completed through the merger of Atlantis Merger Sub, Inc., a Delaware corporation and wholly-owned subsidiary of
     Parent, with and into Alltel (the quot;Mergerquot;), with Alltel surviving the Merger as a privately-held, majority-owned subsidiary of Parent. Although Alltel continues as the same legal entity after the Merger, Atlantis Holdings' cost of
     acquiring Alltel has been pushed-down to establish a new accounting basis for Alltel. Accordingly, the accompanying consolidated financial statements are presented for two periods, Predecessor and Successor, which relate to the
     accounting periods preceding and succeeding the consummation of the Merger. Alltel has presented its results of operations for the three and twelve months ended December 31, 2007 by adding the operating results for the
     Predecessor periods October 1, 2007 to November 15, 2007 and January 1, 2007 to November 15, 2007 to the Successor period
     November 16, 2007 to December 31, 2007. Although this combined presentation does not comply with generally accepted accounting principles (quot;GAAPquot;), Alltel believes that it provides a meaningful method of comparison.


     Alltel also has presented calculations of earnings before interest, taxes and depreciation and amortization expense (quot;EBITDAquot;) and Adjusted EBITDA. Alltel has included this presentation of Adjusted EBITDA because covenants
     in Alltel Communications, Inc.’s senior secured credit facilities contain ratios based on this measure. Measurements of Adjusted EBITDA are based on the Company’s calculation of EBITDA (net income (loss), excluding the effects
     of discontinued operations, and before net interest expense, provision for income taxes and depreciation and amortization) adjusted to exclude unusual items, certain non-cash charges and other items permitted in calculating
     covenant compliance under the indenture and the credit facilities. Alltel believes that the application of these supplementary adjustments to EBITDA in determining Adjusted EBITDA are appropriate to provide additional
     information to investors to demonstrate compliance with its financing covenants. If the Company’s Adjusted EBITDA were to decline below certain levels, covenants in the senior secured credit facilities that are based on Adjusted
     EBITDA, including the maximum senior secured leverage ratio covenant, may be violated and could cause, among other

     things, an inability to incur further indebtedness and in certain circumstances a default or mandatory prepayment of amounts outstanding under the senior secured term loan facility.

     EBITDA and Adjusted EBITDA are not measures calculated in accordance with GAAP and should not be considered a substitute for operating income (loss), net income (loss) or any other measure of financial performance reported
     in accordance with GAAP or as measures of operating cash flows or liquidity. The presentation of EBITDA has limitations as an analytical tool, and should not be considered in isolation, or as a substitute for analysis of the
     Company’s results of operations or cash flows as reported under GAAP. In particular, EBITDA and Adjusted EBITDA should not be viewed as a reliable indicator of Alltel’s ability to generate cash to service its debt obligations
     because certain of the items added to net income (loss) to determine EBITDA and Adjusted EBITDA involve outlays of cash. As a result, actual cash available to service the Company’s debt obligations will be different from
     Adjusted EBITDA. In addition to demonstrating compliance with its financing covenants, Alltel believes that the presentation of EBITDA and Adjusted EBITDA is helpful in highlighting operational trends because these measures
     exclude certain non-cash charges and other non-operating items that are not representative of the Company’s core business
     operations.

(A) The following are included in discontinued operations:

     On November 7, 2007, Alltel signed a definitive agreement to sell one of its wireless markets for cash. Accordingly, this market has been classified from that date as discontinued operations. The sale is expected to be completed by
     mid-2008.
     As a condition of receiving approval for its acquisition of Midwest Wireless Holdings (quot;Midwest Wirelessquot;), Alltel agreed to divest certain wireless operations in Minnesota. The operations in Minnesota have been reported as
     discontinued operations from September 7, 2006 to the date of sale, April 3, 2007.

     On July 17, 2006, Alltel completed the spin-off of its wireline business. The wireline operations have been reported as discontinued operations for all periods presented. On August 1, 2005, as part of its acquisition of Western
     Wireless Corporation (quot;Western Wirelessquot;), Alltel acquired international operations in eight countries. The international operations have been reported as discontinued operations from August 1, 2005 through the dates of sale. All
     of the international operations were sold by June 2006.

(B) The following are included in gain on exchange or disposal of assets and other:
     Through its merger with Western Wireless, Alltel acquired marketable equity securities. On January 24, 2007, Alltel completed the sale of these securities for $188.7 million in cash and recorded a pretax gain from the sale of $56.5
     million.

     On July 17, 2006, in order to effect the spin-off of its wireline telecommunications business to its stockholders, Alltel contributed all of the assets of its wireline telecommunications business to ALLTEL Holding Corp. (quot;Alltel
     Holdingquot; or quot;Spincoquot;), a wholly-owned subsidiary of the Company, in exchange for: (i) the issuance to Alltel of Spinco common stock that was distributed on a pro rata basis to Alltel’s stockholders as a tax-free stock dividend, (ii)
     the payment of a special dividend to Alltel in the amount of $2.3 billion and (iii) the distribution by Spinco to Alltel of $1.7 billion of Spinco debt securities.

     Also on July 17, 2006, Alltel completed a debt exchange in which Alltel transferred to two investment banks the Spinco debt securities received in the spin-off transaction in exchange for certain Alltel debt securities, consisting of
     $988.5 million of outstanding commercial paper borrowings and $685.1 million of 4.656 percent notes due May 17, 2007. In completing the debt exchange, Alltel incurred a pretax loss of $27.5 million.


                                                                                                                    -more-
ALLTEL CORPORATION
NOTES TO RECONCILIATIONS OF NET INCOME (LOSS) TO ADJUSTED EBITDA
(UNAUDITED) (CONTINUED) -Page 9


    On August 25, 2006, Alltel repurchased prior to maturity $1.0 billion of long-term debt, consisting of $664.3 million of 4.656 percent equity unit notes due 2007, $61.0 million of 6.65 percent unsecured notes due 2008, $147.0
    million of 7.60 percent unsecured notes due 2009 and $127.7 million of 8.00 percent notes due 2010 pursuant to cash tender offers announced by the Company on July 31, 2006. Concurrent with the debt repurchase, Alltel also
    terminated the related pay variable/receive fixed, interest rate swap agreement that had been designated as a fair value hedge against the 6.65 percent unsecured notes due 2008. In connection with the early termination of the debt
    and interest rate swap agreement, Alltel incurred net pretax termination fees of $23.0 million.

    During 2005, federal legislation was enacted which included provisions to dissolve and liquidate the assets of the Rural Telephone Bank (quot;RTBquot;). In connection with the dissolution and liquidation, during April 2006, the RTB
    redeemed all outstanding shares of its Class C stock. As a result, Alltel received liquidating cash distributions of $198.7 million in exchange for its $22.1 million investment in RTB Class C stock.
(C) Compensation expense recognized by Alltel related to restricted stock and stock option awards. Excludes $63.8 million of expense resulting from the accelerated vesting of employee stock option and restricted stock awards in
    connection with the Merger. This amount has been included in integration expenses, restructuring and other charges as discussed below.

(D) The following are included in integration expenses, restructuring and other charges:
    During 2007, in connection with the 2006 purchase of Midwest Wireless and properties in Illinois, Texas and Virginia, Alltel incurred system conversion and other integration costs totaling $12.0 million to convert the acquired
    properties to Alltel's customer billing and support systems. Also during 2007, in connection with the closing of two call centers, Alltel recorded severance and employee benefit costs of $4.5 million and lease termination fees of
    $2.6 million. In connection with the Merger, Alltel incurred during the Predecessor period $647.9 million of incremental costs, which include financial advisory, legal, accounting, regulatory filing, and other fees of $177.6 million,
    stock-based compensation expense of $63.8 million related to the accelerated vesting of employee stock option and restricted stock awards, a curtailment charge of $118.6 million resulting from the termination and payout of the
    supplemental executive retirement plan, and additional compensation-related costs of $287.9 million primarily related to change-in-control payments to certain executives, bonus payments and related payroll taxes. During the
    Successor period, Alltel incurred $5.2 million of incremental expenses related to the Merger which included
    insurance premiums of $4.2 million to obtain retroactive indemnification coverage for departing directors and officers for events that occurred prior to the Merger and $1.0 million in employee retention bonuses.

    During 2006, Alltel incurred $10.8 million of integration expenses related to its acquisition of Western Wireless, consisting of costs incurred to convert Western Wireless' customer billing and operational support systems to Alltel's
    internal systems. The Company also incurred $2.9 million of integration expenses related to its purchase of Midwest Wireless completed on October 3, 2006 and the acquisitions of wireless properties in Illinois, Texas and Virginia
    completed during the second quarter of 2006. These expenses primarily consisted of branding, signage and computer system conversion costs.

(E) Represents non-cash rental income and amortization of deferred leasing costs related to Alltel's agreement to lease cell site towers to American Tower Corporation. The deferred rental income was received in advance by Alltel
    under the terms of the leasing agreement. The remaining deferred rental income and deferred leasing costs were written-off in connection with the Merger.

(F) Represents the annual management fee and out-of-pocket expenses payable to affiliates of the Sponsors in exchange for consulting and management advisory services. The annual management fee is equal to one percent of Alltel’s
    consolidated Adjusted EBITDA.
(G) Represents the historical EBITDA of Midwest Wireless for the nine months ended September 30, 2006 assuming the acquisition of Midwest Wireless had occurred on January 1, 2006.


                                                                                                                     -end-

More Related Content

Similar to alltel 4q 07_highlights

alltel 4Q 04_Highlights
alltel  4Q 04_Highlightsalltel  4Q 04_Highlights
alltel 4Q 04_Highlightsfinance27
 
alltel 4Q04_Highlights
alltel  4Q04_Highlightsalltel  4Q04_Highlights
alltel 4Q04_Highlightsfinance27
 
alltel 4Q 04_Highlights
alltel  4Q 04_Highlightsalltel  4Q 04_Highlights
alltel 4Q 04_Highlightsfinance27
 
alltel 4Q 04_Highlights
alltel  4Q 04_Highlightsalltel  4Q 04_Highlights
alltel 4Q 04_Highlightsfinance27
 
alltel 4Q04_Highlights
alltel  4Q04_Highlightsalltel  4Q04_Highlights
alltel 4Q04_Highlightsfinance27
 
alltel 4Q 04_Highlights
alltel  4Q 04_Highlightsalltel  4Q 04_Highlights
alltel 4Q 04_Highlightsfinance27
 
alltel 4Q04_Highlights
alltel  4Q04_Highlightsalltel  4Q04_Highlights
alltel 4Q04_Highlightsfinance27
 
alltel 4Q 04_Highlights
alltel  4Q 04_Highlightsalltel  4Q 04_Highlights
alltel 4Q 04_Highlightsfinance27
 
alltel 4Q04_Highlights
alltel  4Q04_Highlightsalltel  4Q04_Highlights
alltel 4Q04_Highlightsfinance27
 
alltel 4Q 04_Highlights
alltel  4Q 04_Highlightsalltel  4Q 04_Highlights
alltel 4Q 04_Highlightsfinance27
 
alltel 4Q 04_Highlights
alltel  4Q 04_Highlightsalltel  4Q 04_Highlights
alltel 4Q 04_Highlightsfinance27
 
alltel 4Q04_Highlights
alltel  4Q04_Highlightsalltel  4Q04_Highlights
alltel 4Q04_Highlightsfinance27
 
alltel 4Q04_Highlights
alltel  4Q04_Highlightsalltel  4Q04_Highlights
alltel 4Q04_Highlightsfinance27
 
alltel 4Q 04_Highlights
alltel  4Q 04_Highlightsalltel  4Q 04_Highlights
alltel 4Q 04_Highlightsfinance27
 
alltel 4Q 04_Highlights
alltel  4Q 04_Highlightsalltel  4Q 04_Highlights
alltel 4Q 04_Highlightsfinance27
 
alltel 4Q 04_Highlights
alltel  4Q 04_Highlightsalltel  4Q 04_Highlights
alltel 4Q 04_Highlightsfinance27
 
alltel 4Q04_Highlights
alltel  4Q04_Highlightsalltel  4Q04_Highlights
alltel 4Q04_Highlightsfinance27
 
alltel 4Q 04_Highlights
alltel  4Q 04_Highlightsalltel  4Q 04_Highlights
alltel 4Q 04_Highlightsfinance27
 
alltel 4Q 04_Highlights
alltel  4Q 04_Highlightsalltel  4Q 04_Highlights
alltel 4Q 04_Highlightsfinance27
 
alltel 4Q04_Highlights
alltel  4Q04_Highlightsalltel  4Q04_Highlights
alltel 4Q04_Highlightsfinance27
 

Similar to alltel 4q 07_highlights (20)

alltel 4Q 04_Highlights
alltel  4Q 04_Highlightsalltel  4Q 04_Highlights
alltel 4Q 04_Highlights
 
alltel 4Q04_Highlights
alltel  4Q04_Highlightsalltel  4Q04_Highlights
alltel 4Q04_Highlights
 
alltel 4Q 04_Highlights
alltel  4Q 04_Highlightsalltel  4Q 04_Highlights
alltel 4Q 04_Highlights
 
alltel 4Q 04_Highlights
alltel  4Q 04_Highlightsalltel  4Q 04_Highlights
alltel 4Q 04_Highlights
 
alltel 4Q04_Highlights
alltel  4Q04_Highlightsalltel  4Q04_Highlights
alltel 4Q04_Highlights
 
alltel 4Q 04_Highlights
alltel  4Q 04_Highlightsalltel  4Q 04_Highlights
alltel 4Q 04_Highlights
 
alltel 4Q04_Highlights
alltel  4Q04_Highlightsalltel  4Q04_Highlights
alltel 4Q04_Highlights
 
alltel 4Q 04_Highlights
alltel  4Q 04_Highlightsalltel  4Q 04_Highlights
alltel 4Q 04_Highlights
 
alltel 4Q04_Highlights
alltel  4Q04_Highlightsalltel  4Q04_Highlights
alltel 4Q04_Highlights
 
alltel 4Q 04_Highlights
alltel  4Q 04_Highlightsalltel  4Q 04_Highlights
alltel 4Q 04_Highlights
 
alltel 4Q 04_Highlights
alltel  4Q 04_Highlightsalltel  4Q 04_Highlights
alltel 4Q 04_Highlights
 
alltel 4Q04_Highlights
alltel  4Q04_Highlightsalltel  4Q04_Highlights
alltel 4Q04_Highlights
 
alltel 4Q04_Highlights
alltel  4Q04_Highlightsalltel  4Q04_Highlights
alltel 4Q04_Highlights
 
alltel 4Q 04_Highlights
alltel  4Q 04_Highlightsalltel  4Q 04_Highlights
alltel 4Q 04_Highlights
 
alltel 4Q 04_Highlights
alltel  4Q 04_Highlightsalltel  4Q 04_Highlights
alltel 4Q 04_Highlights
 
alltel 4Q 04_Highlights
alltel  4Q 04_Highlightsalltel  4Q 04_Highlights
alltel 4Q 04_Highlights
 
alltel 4Q04_Highlights
alltel  4Q04_Highlightsalltel  4Q04_Highlights
alltel 4Q04_Highlights
 
alltel 4Q 04_Highlights
alltel  4Q 04_Highlightsalltel  4Q 04_Highlights
alltel 4Q 04_Highlights
 
alltel 4Q 04_Highlights
alltel  4Q 04_Highlightsalltel  4Q 04_Highlights
alltel 4Q 04_Highlights
 
alltel 4Q04_Highlights
alltel  4Q04_Highlightsalltel  4Q04_Highlights
alltel 4Q04_Highlights
 

More from finance27

commercial metals Overview_03/08
commercial metals Overview_03/08commercial metals Overview_03/08
commercial metals Overview_03/08finance27
 
commercial metals 2Q 08_Presentation
commercial metals 2Q 08_Presentationcommercial metals 2Q 08_Presentation
commercial metals 2Q 08_Presentationfinance27
 
commercial metals BofA_05/08
commercial metals BofA_05/08commercial metals BofA_05/08
commercial metals BofA_05/08finance27
 
commercial metals Overview_06/08_2
commercial metals Overview_06/08_2commercial metals Overview_06/08_2
commercial metals Overview_06/08_2finance27
 
commercial metals Q3 08_Presentation
commercial metals Q3 08_Presentationcommercial metals Q3 08_Presentation
commercial metals Q3 08_Presentationfinance27
 
commercial metals Q3 08_Presentation
commercial metals Q3 08_Presentationcommercial metals Q3 08_Presentation
commercial metals Q3 08_Presentationfinance27
 
commercial metals Hodges_09/08
commercial metals Hodges_09/08commercial metals Hodges_09/08
commercial metals Hodges_09/08finance27
 
commercial metals 4thQ 2008
commercial metals 4thQ 2008commercial metals 4thQ 2008
commercial metals 4thQ 2008finance27
 
commercial metals 4thQ 2008
commercial metals  4thQ 2008commercial metals  4thQ 2008
commercial metals 4thQ 2008finance27
 
commercial metals GoldmanSachs_12/04/08
commercial metals GoldmanSachs_12/04/08commercial metals GoldmanSachs_12/04/08
commercial metals GoldmanSachs_12/04/08finance27
 
commercial metals 12/02/05TwinsBroch
commercial metals 12/02/05TwinsBrochcommercial metals 12/02/05TwinsBroch
commercial metals 12/02/05TwinsBrochfinance27
 
commercial metals 12/02/05TwinsBroch
commercial metals 12/02/05TwinsBrochcommercial metals 12/02/05TwinsBroch
commercial metals 12/02/05TwinsBrochfinance27
 
commercial metals 12/02/05TwinsBroch
commercial metals 12/02/05TwinsBrochcommercial metals 12/02/05TwinsBroch
commercial metals 12/02/05TwinsBrochfinance27
 
commercial metals 2005AR
commercial metals 2005ARcommercial metals 2005AR
commercial metals 2005ARfinance27
 
commercial metals 2005AR
commercial metals 2005ARcommercial metals 2005AR
commercial metals 2005ARfinance27
 
commercial metals 2005AR
commercial metals 2005ARcommercial metals 2005AR
commercial metals 2005ARfinance27
 
commercial metals AR_2006
commercial metals AR_2006commercial metals AR_2006
commercial metals AR_2006finance27
 
commercial metals AR_2006
commercial metals AR_2006commercial metals AR_2006
commercial metals AR_2006finance27
 
commercial metals AR_2006
commercial metals AR_2006commercial metals AR_2006
commercial metals AR_2006finance27
 
commercial metals 2007_AR
commercial metals 2007_ARcommercial metals 2007_AR
commercial metals 2007_ARfinance27
 

More from finance27 (20)

commercial metals Overview_03/08
commercial metals Overview_03/08commercial metals Overview_03/08
commercial metals Overview_03/08
 
commercial metals 2Q 08_Presentation
commercial metals 2Q 08_Presentationcommercial metals 2Q 08_Presentation
commercial metals 2Q 08_Presentation
 
commercial metals BofA_05/08
commercial metals BofA_05/08commercial metals BofA_05/08
commercial metals BofA_05/08
 
commercial metals Overview_06/08_2
commercial metals Overview_06/08_2commercial metals Overview_06/08_2
commercial metals Overview_06/08_2
 
commercial metals Q3 08_Presentation
commercial metals Q3 08_Presentationcommercial metals Q3 08_Presentation
commercial metals Q3 08_Presentation
 
commercial metals Q3 08_Presentation
commercial metals Q3 08_Presentationcommercial metals Q3 08_Presentation
commercial metals Q3 08_Presentation
 
commercial metals Hodges_09/08
commercial metals Hodges_09/08commercial metals Hodges_09/08
commercial metals Hodges_09/08
 
commercial metals 4thQ 2008
commercial metals 4thQ 2008commercial metals 4thQ 2008
commercial metals 4thQ 2008
 
commercial metals 4thQ 2008
commercial metals  4thQ 2008commercial metals  4thQ 2008
commercial metals 4thQ 2008
 
commercial metals GoldmanSachs_12/04/08
commercial metals GoldmanSachs_12/04/08commercial metals GoldmanSachs_12/04/08
commercial metals GoldmanSachs_12/04/08
 
commercial metals 12/02/05TwinsBroch
commercial metals 12/02/05TwinsBrochcommercial metals 12/02/05TwinsBroch
commercial metals 12/02/05TwinsBroch
 
commercial metals 12/02/05TwinsBroch
commercial metals 12/02/05TwinsBrochcommercial metals 12/02/05TwinsBroch
commercial metals 12/02/05TwinsBroch
 
commercial metals 12/02/05TwinsBroch
commercial metals 12/02/05TwinsBrochcommercial metals 12/02/05TwinsBroch
commercial metals 12/02/05TwinsBroch
 
commercial metals 2005AR
commercial metals 2005ARcommercial metals 2005AR
commercial metals 2005AR
 
commercial metals 2005AR
commercial metals 2005ARcommercial metals 2005AR
commercial metals 2005AR
 
commercial metals 2005AR
commercial metals 2005ARcommercial metals 2005AR
commercial metals 2005AR
 
commercial metals AR_2006
commercial metals AR_2006commercial metals AR_2006
commercial metals AR_2006
 
commercial metals AR_2006
commercial metals AR_2006commercial metals AR_2006
commercial metals AR_2006
 
commercial metals AR_2006
commercial metals AR_2006commercial metals AR_2006
commercial metals AR_2006
 
commercial metals 2007_AR
commercial metals 2007_ARcommercial metals 2007_AR
commercial metals 2007_AR
 

Recently uploaded

Bladex Earnings Call Presentation 1Q2024
Bladex Earnings Call Presentation 1Q2024Bladex Earnings Call Presentation 1Q2024
Bladex Earnings Call Presentation 1Q2024Bladex
 
03_Emmanuel Ndiaye_Degroof Petercam.pptx
03_Emmanuel Ndiaye_Degroof Petercam.pptx03_Emmanuel Ndiaye_Degroof Petercam.pptx
03_Emmanuel Ndiaye_Degroof Petercam.pptxFinTech Belgium
 
Interimreport1 January–31 March2024 Elo Mutual Pension Insurance Company
Interimreport1 January–31 March2024 Elo Mutual Pension Insurance CompanyInterimreport1 January–31 March2024 Elo Mutual Pension Insurance Company
Interimreport1 January–31 March2024 Elo Mutual Pension Insurance CompanyTyöeläkeyhtiö Elo
 
02_Fabio Colombo_Accenture_MeetupDora&Cybersecurity.pptx
02_Fabio Colombo_Accenture_MeetupDora&Cybersecurity.pptx02_Fabio Colombo_Accenture_MeetupDora&Cybersecurity.pptx
02_Fabio Colombo_Accenture_MeetupDora&Cybersecurity.pptxFinTech Belgium
 
Log your LOA pain with Pension Lab's brilliant campaign
Log your LOA pain with Pension Lab's brilliant campaignLog your LOA pain with Pension Lab's brilliant campaign
Log your LOA pain with Pension Lab's brilliant campaignHenry Tapper
 
Instant Issue Debit Cards - High School Spirit
Instant Issue Debit Cards - High School SpiritInstant Issue Debit Cards - High School Spirit
Instant Issue Debit Cards - High School Spiritegoetzinger
 
fca-bsps-decision-letter-redacted (1).pdf
fca-bsps-decision-letter-redacted (1).pdffca-bsps-decision-letter-redacted (1).pdf
fca-bsps-decision-letter-redacted (1).pdfHenry Tapper
 
05_Annelore Lenoir_Docbyte_MeetupDora&Cybersecurity.pptx
05_Annelore Lenoir_Docbyte_MeetupDora&Cybersecurity.pptx05_Annelore Lenoir_Docbyte_MeetupDora&Cybersecurity.pptx
05_Annelore Lenoir_Docbyte_MeetupDora&Cybersecurity.pptxFinTech Belgium
 
VIP Kolkata Call Girl Serampore 👉 8250192130 Available With Room
VIP Kolkata Call Girl Serampore 👉 8250192130  Available With RoomVIP Kolkata Call Girl Serampore 👉 8250192130  Available With Room
VIP Kolkata Call Girl Serampore 👉 8250192130 Available With Roomdivyansh0kumar0
 
Instant Issue Debit Cards - School Designs
Instant Issue Debit Cards - School DesignsInstant Issue Debit Cards - School Designs
Instant Issue Debit Cards - School Designsegoetzinger
 
The Economic History of the U.S. Lecture 19.pdf
The Economic History of the U.S. Lecture 19.pdfThe Economic History of the U.S. Lecture 19.pdf
The Economic History of the U.S. Lecture 19.pdfGale Pooley
 
OAT_RI_Ep19 WeighingTheRisks_Apr24_TheYellowMetal.pptx
OAT_RI_Ep19 WeighingTheRisks_Apr24_TheYellowMetal.pptxOAT_RI_Ep19 WeighingTheRisks_Apr24_TheYellowMetal.pptx
OAT_RI_Ep19 WeighingTheRisks_Apr24_TheYellowMetal.pptxhiddenlevers
 
Monthly Market Risk Update: April 2024 [SlideShare]
Monthly Market Risk Update: April 2024 [SlideShare]Monthly Market Risk Update: April 2024 [SlideShare]
Monthly Market Risk Update: April 2024 [SlideShare]Commonwealth
 
High Class Call Girls Nashik Maya 7001305949 Independent Escort Service Nashik
High Class Call Girls Nashik Maya 7001305949 Independent Escort Service NashikHigh Class Call Girls Nashik Maya 7001305949 Independent Escort Service Nashik
High Class Call Girls Nashik Maya 7001305949 Independent Escort Service NashikCall Girls in Nagpur High Profile
 
Dharavi Russian callg Girls, { 09892124323 } || Call Girl In Mumbai ...
Dharavi Russian callg Girls, { 09892124323 } || Call Girl In Mumbai ...Dharavi Russian callg Girls, { 09892124323 } || Call Girl In Mumbai ...
Dharavi Russian callg Girls, { 09892124323 } || Call Girl In Mumbai ...Pooja Nehwal
 
Call Girls Service Nagpur Maya Call 7001035870 Meet With Nagpur Escorts
Call Girls Service Nagpur Maya Call 7001035870 Meet With Nagpur EscortsCall Girls Service Nagpur Maya Call 7001035870 Meet With Nagpur Escorts
Call Girls Service Nagpur Maya Call 7001035870 Meet With Nagpur Escortsranjana rawat
 
Lundin Gold April 2024 Corporate Presentation v4.pdf
Lundin Gold April 2024 Corporate Presentation v4.pdfLundin Gold April 2024 Corporate Presentation v4.pdf
Lundin Gold April 2024 Corporate Presentation v4.pdfAdnet Communications
 
Independent Call Girl Number in Kurla Mumbai📲 Pooja Nehwal 9892124323 💞 Full ...
Independent Call Girl Number in Kurla Mumbai📲 Pooja Nehwal 9892124323 💞 Full ...Independent Call Girl Number in Kurla Mumbai📲 Pooja Nehwal 9892124323 💞 Full ...
Independent Call Girl Number in Kurla Mumbai📲 Pooja Nehwal 9892124323 💞 Full ...Pooja Nehwal
 
Call Girls In Yusuf Sarai Women Seeking Men 9654467111
Call Girls In Yusuf Sarai Women Seeking Men 9654467111Call Girls In Yusuf Sarai Women Seeking Men 9654467111
Call Girls In Yusuf Sarai Women Seeking Men 9654467111Sapana Sha
 

Recently uploaded (20)

Bladex Earnings Call Presentation 1Q2024
Bladex Earnings Call Presentation 1Q2024Bladex Earnings Call Presentation 1Q2024
Bladex Earnings Call Presentation 1Q2024
 
03_Emmanuel Ndiaye_Degroof Petercam.pptx
03_Emmanuel Ndiaye_Degroof Petercam.pptx03_Emmanuel Ndiaye_Degroof Petercam.pptx
03_Emmanuel Ndiaye_Degroof Petercam.pptx
 
Interimreport1 January–31 March2024 Elo Mutual Pension Insurance Company
Interimreport1 January–31 March2024 Elo Mutual Pension Insurance CompanyInterimreport1 January–31 March2024 Elo Mutual Pension Insurance Company
Interimreport1 January–31 March2024 Elo Mutual Pension Insurance Company
 
02_Fabio Colombo_Accenture_MeetupDora&Cybersecurity.pptx
02_Fabio Colombo_Accenture_MeetupDora&Cybersecurity.pptx02_Fabio Colombo_Accenture_MeetupDora&Cybersecurity.pptx
02_Fabio Colombo_Accenture_MeetupDora&Cybersecurity.pptx
 
Log your LOA pain with Pension Lab's brilliant campaign
Log your LOA pain with Pension Lab's brilliant campaignLog your LOA pain with Pension Lab's brilliant campaign
Log your LOA pain with Pension Lab's brilliant campaign
 
Commercial Bank Economic Capsule - April 2024
Commercial Bank Economic Capsule - April 2024Commercial Bank Economic Capsule - April 2024
Commercial Bank Economic Capsule - April 2024
 
Instant Issue Debit Cards - High School Spirit
Instant Issue Debit Cards - High School SpiritInstant Issue Debit Cards - High School Spirit
Instant Issue Debit Cards - High School Spirit
 
fca-bsps-decision-letter-redacted (1).pdf
fca-bsps-decision-letter-redacted (1).pdffca-bsps-decision-letter-redacted (1).pdf
fca-bsps-decision-letter-redacted (1).pdf
 
05_Annelore Lenoir_Docbyte_MeetupDora&Cybersecurity.pptx
05_Annelore Lenoir_Docbyte_MeetupDora&Cybersecurity.pptx05_Annelore Lenoir_Docbyte_MeetupDora&Cybersecurity.pptx
05_Annelore Lenoir_Docbyte_MeetupDora&Cybersecurity.pptx
 
VIP Kolkata Call Girl Serampore 👉 8250192130 Available With Room
VIP Kolkata Call Girl Serampore 👉 8250192130  Available With RoomVIP Kolkata Call Girl Serampore 👉 8250192130  Available With Room
VIP Kolkata Call Girl Serampore 👉 8250192130 Available With Room
 
Instant Issue Debit Cards - School Designs
Instant Issue Debit Cards - School DesignsInstant Issue Debit Cards - School Designs
Instant Issue Debit Cards - School Designs
 
The Economic History of the U.S. Lecture 19.pdf
The Economic History of the U.S. Lecture 19.pdfThe Economic History of the U.S. Lecture 19.pdf
The Economic History of the U.S. Lecture 19.pdf
 
OAT_RI_Ep19 WeighingTheRisks_Apr24_TheYellowMetal.pptx
OAT_RI_Ep19 WeighingTheRisks_Apr24_TheYellowMetal.pptxOAT_RI_Ep19 WeighingTheRisks_Apr24_TheYellowMetal.pptx
OAT_RI_Ep19 WeighingTheRisks_Apr24_TheYellowMetal.pptx
 
Monthly Market Risk Update: April 2024 [SlideShare]
Monthly Market Risk Update: April 2024 [SlideShare]Monthly Market Risk Update: April 2024 [SlideShare]
Monthly Market Risk Update: April 2024 [SlideShare]
 
High Class Call Girls Nashik Maya 7001305949 Independent Escort Service Nashik
High Class Call Girls Nashik Maya 7001305949 Independent Escort Service NashikHigh Class Call Girls Nashik Maya 7001305949 Independent Escort Service Nashik
High Class Call Girls Nashik Maya 7001305949 Independent Escort Service Nashik
 
Dharavi Russian callg Girls, { 09892124323 } || Call Girl In Mumbai ...
Dharavi Russian callg Girls, { 09892124323 } || Call Girl In Mumbai ...Dharavi Russian callg Girls, { 09892124323 } || Call Girl In Mumbai ...
Dharavi Russian callg Girls, { 09892124323 } || Call Girl In Mumbai ...
 
Call Girls Service Nagpur Maya Call 7001035870 Meet With Nagpur Escorts
Call Girls Service Nagpur Maya Call 7001035870 Meet With Nagpur EscortsCall Girls Service Nagpur Maya Call 7001035870 Meet With Nagpur Escorts
Call Girls Service Nagpur Maya Call 7001035870 Meet With Nagpur Escorts
 
Lundin Gold April 2024 Corporate Presentation v4.pdf
Lundin Gold April 2024 Corporate Presentation v4.pdfLundin Gold April 2024 Corporate Presentation v4.pdf
Lundin Gold April 2024 Corporate Presentation v4.pdf
 
Independent Call Girl Number in Kurla Mumbai📲 Pooja Nehwal 9892124323 💞 Full ...
Independent Call Girl Number in Kurla Mumbai📲 Pooja Nehwal 9892124323 💞 Full ...Independent Call Girl Number in Kurla Mumbai📲 Pooja Nehwal 9892124323 💞 Full ...
Independent Call Girl Number in Kurla Mumbai📲 Pooja Nehwal 9892124323 💞 Full ...
 
Call Girls In Yusuf Sarai Women Seeking Men 9654467111
Call Girls In Yusuf Sarai Women Seeking Men 9654467111Call Girls In Yusuf Sarai Women Seeking Men 9654467111
Call Girls In Yusuf Sarai Women Seeking Men 9654467111
 

alltel 4q 07_highlights

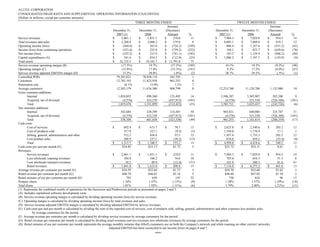
  • 1. ALLTEL CORPORATION CONSOLIDATED HIGHLIGHTS AND SUPPLEMENTAL OPERATING INFORMATION (UNAUDITED) (Dollars in millions, except per customer amounts) THREE MONTHS ENDED TWELVE MONTHS ENDED Increase Increase December 31, December 31, (Decrease) December 31, December 31, (Decrease) 2007 (1) 2006 Amount % 2007 (1) 2006 Amount % Service revenues $ 2,061.1 $ 1,851.1 $ 210.0 11 $ 7,984.3 $ 7,029.8 $ 954.5 14 Total revenues and sales $ 2,268.0 $ 2,088.2 $ 179.8 9 $ 8,803.1 $ 7,884.0 $ 919.1 12 Operating income (loss) $ (360.4) $ 363.8 $ (724.2) (199) $ 806.4 $ 1,357.6 $ (551.2) (41) Income (loss) from continuing operations $ (523.4) $ 235.8 $ (759.2) (322) $ 184.1 $ 823.7 $ (639.6) (78) Net income (loss) $ (525.2) $ 215.9 $ (741.1) (343) $ 183.2 $ 1,129.4 $ (946.2) (84) Capital expenditures (A) $ 341.6 $ 454.5 $ (112.9) (25) $ 1,086.2 $ 1,197.1 $ (110.9) (9) Total assets $ 32,135.5 $ 18,343.7 $ 13,791.8 75 Service revenue operating margin (B) (17.5%) 19.7% (37.2%) (189) 10.1% 19.3% (9.2%) (48) Operating margin (C) (15.9%) 17.4% (33.3%) (191) 9.2% 17.2% (8.0%) (47) Service revenue adjusted EBITDA margin (D) 37.2% 38.0% (.8%) (2) 38.7% 39.2% (.5%) (1) Controlled POPs 79,383,821 78,838,118 545,703 1 Customers 12,785,193 11,823,938 961,255 8 Penetration rate 16.1% 15.0% 1.1% 7 Average customers 12,585,179 11,676,380 908,799 8 12,253,760 11,120,780 1,132,980 10 Gross customer additions: Internal 1,024,052 898,560 125,492 14 3,586,287 3,303,907 282,380 9 Acquired, net of divested (4,576) 433,339 (437,915) (101) (4,576) 521,530 (526,106) (101) Total 1,019,476 1,331,899 (312,423) (23) 3,581,711 3,825,437 (243,726) (6) Net customer additions: Internal 342,684 228,299 114,385 50 965,831 640,084 325,747 51 Acquired, net of divested (4,576) 433,339 (437,915) (101) (4,576) 521,530 (526,106) (101) Total 338,108 661,638 (323,530) (49) 961,255 1,161,614 (200,359) (17) Cash costs: Cost of services $ 692.4 $ 613.7 $ 78.7 13 $ 2,625.8 $ 2,340.6 $ 285.2 12 Cost of products sold 317.9 327.1 (9.2) (3) 1,194.0 1,176.9 17.1 1 Selling, general, administrative and other 512.3 456.8 55.5 12 1,957.8 1,755.3 202.5 12 Less product sales 206.9 237.1 (30.2) (13) 818.8 854.2 (35.4) (4) Total $ 1,315.7 $ 1,160.5 $ 155.2 13 $ 4,958.8 $ 4,418.6 $ 540.2 12 Cash costs per unit per month (E) $34.85 $33.13 $1.72 5 $33.72 $33.11 $.61 2 Revenues: Service revenues $ 2,061.1 $ 1,851.1 $ 210.0 11 $ 7,984.3 $ 7,029.8 $ 954.5 14 Less wholesale roaming revenues 184.8 168.2 16.6 10 705.6 654.3 51.3 8 Less wholesale transport revenues 34.5 49.9 (15.4) (31) 161.9 100.3 61.6 61 Retail revenues $ 1,841.8 $ 1,633.0 $ 208.8 13 $ 7,116.8 $ 6,275.2 $ 841.6 13 Average revenue per customer per month (F) $54.59 $52.84 $1.75 3 $54.30 $52.68 $1.62 3 Retail revenue per customer per month (G) $48.78 $46.62 $2.16 5 $48.40 $47.02 $1.38 3 Retail minutes of use per customer per month (H) 795 650 145 22 730 634 96 15 Postpay churn 1.34% 1.47% (.13%) (9) 1.28% 1.57% (.29%) (18) Total churn 1.81% 1.92% (.11%) (6) 1.79% 2.00% (.21%) (11) (1) Represents the combined results of operations for the Successor and Predecessor periods as presented on pages 2 and 3. (A) Includes capitalized software development costs. (B) Service revenue operating margin is calculated by dividing operating income (loss) by service revenues. (C) Operating margin is calculated by dividing operating income (loss) by total revenues and sales. (D) Service revenue adjusted EBITDA margin is calculated by dividing adjusted EBITDA by service revenues. (E) Cash costs per unit per month is calculated by dividing the sum of the reported cost of services, cost of products sold, selling, general, administrative and other expenses less product sales by average customers for the period. (F) Average revenue per customer per month is calculated by dividing service revenues by average customers for the period. (G) Retail revenue per customer per month is calculated by dividing retail revenues (service revenues less wholesale revenues) by average customers for the period. (H) Retail minutes of use per customer per month represents the average monthly minutes that Alltel's customers use on both the Company's network and while roaming on other carriers' networks. Adjusted EBITDA has been reconciled to net income (loss) on pages 6 and 7. -more-
  • 2. ALLTEL CORPORATION CONSOLIDATED STATEMENTS OF OPERATIONS (UNAUDITED)-Page 2 (Millions) THREE MONTHS ENDED October 1 - November 16 - November 15, December 31, December 31, December 31, 2007 2007 2007 2006 (Predecessor) (Successor) (Combined) (Predecessor) Revenues and sales: Service revenues $ 1,034.1 $ 1,027.0 $ 2,061.1 $ 1,851.1 Product sales 101.0 105.9 206.9 237.1 Total revenues and sales 1,135.1 1,132.9 2,268.0 2,088.2 Costs and expenses: Cost of services 337.2 355.2 692.4 613.7 Cost of products sold 145.3 172.6 317.9 327.1 Selling, general, administrative and other 263.3 249.0 512.3 456.8 Depreciation and amortization 226.7 260.2 486.9 323.9 Integration expenses, restructuring and other charges 613.7 5.2 618.9 2.9 Total costs and expenses 1,586.2 1,042.2 2,628.4 1,724.4 Operating income (loss) (451.1) 90.7 (360.4) 363.8 Equity earnings in unconsolidated partnerships 8.7 8.0 16.7 14.5 Minority interest in consolidated partnerships (3.0) (2.2) (5.2) (9.5) Other income, net 4.7 15.4 20.1 14.9 Interest expense (23.0) (280.4) (303.4) (47.6) Income (loss) from continuing operations before income taxes (463.7) (168.5) (632.2) 336.1 Income tax expense (benefit) (44.3) (64.5) (108.8) 100.3 Income (loss) from continuing operations (419.4) (104.0) (523.4) 235.8 Income (loss) from discontinued operations (2.4) 0.6 (1.8) (19.9) Net income (loss) $ (421.8) $ (103.4) $ (525.2) $ 215.9 -more-
  • 3. ALLTEL CORPORATION CONSOLIDATED STATEMENTS OF OPERATIONS-Page 3 (Millions) TWELVE MONTHS ENDED January 1 - November 16 - November 15, December 31, December 31, December 31, 2007 2007 2007 2006 (Predecessor) (Successor) (Combined) (Predecessor) Revenues and sales: Service revenues $ 6,957.3 $ 1,027.0 $ 7,984.3 $ 7,029.8 Product sales 712.9 105.9 818.8 854.2 Total revenues and sales 7,670.2 1,132.9 8,803.1 7,884.0 Costs and expenses: Cost of services 2,270.6 355.2 2,625.8 2,340.6 Cost of products sold 1,021.4 172.6 1,194.0 1,176.9 Selling, general, administrative and other 1,708.8 249.0 1,957.8 1,755.3 Depreciation and amortization 1,286.7 260.2 1,546.9 1,239.9 Integration expenses, restructuring and other charges 667.0 5.2 672.2 13.7 Total costs and expenses 6,954.5 1,042.2 7,996.7 6,526.4 Operating income 715.7 90.7 806.4 1,357.6 Equity earnings in unconsolidated partnerships 57.2 8.0 65.2 60.1 Minority interest in consolidated partnerships (30.4) (2.2) (32.6) (46.6) Other income, net 23.9 15.4 39.3 84.0 Interest expense (163.3) (280.4) (443.7) (282.5) Gain on exchange or disposal of assets and other 56.5 - 56.5 126.1 Income (loss) from continuing operations before income taxes 659.6 (168.5) 491.1 1,298.7 Income tax expense (benefit) 371.5 (64.5) 307.0 475.0 Income (loss) from continuing operations 288.1 (104.0) 184.1 823.7 Income (loss) from discontinued operations (1.5) 0.6 (0.9) 305.7 Net income (loss) $ 286.6 $ (103.4) $ 183.2 $ 1,129.4 -more-
  • 4. ALLTEL CORPORATION CONSOLIDATED BALANCE SHEETS-Page 4 (Millions) ASSETS LIABILITIES AND SHAREHOLDERS' EQUITY December 31, December 31, December 31, December 31, 2007 2006 2007 2006 (Successor) (Predecessor) (Successor) (Predecessor) CURRENT ASSETS: CURRENT LIABILITIES: Cash and short-term investments $ 833.3 $ 934.2 Current maturities of long-term debt $ 140.1 $ 36.3 Accounts receivable (less allowance for Accounts payable 603.6 576.1 doubtful accounts of $32.6 and Advance payments and customer deposits 195.9 186.2 $54.9, respectively) 831.1 807.3 Accrued taxes 120.4 114.1 Inventories 196.0 218.6 Accrued dividends - 46.0 Prepaid expenses and other 142.8 67.7 Accrued interest 187.1 79.3 Assets related to discontinued operations 0.3 4.3 Other current liabilities 271.9 156.5 Liabilities related to discontinued operations 0.2 2.8 Total current assets 2,003.5 2,032.1 Total current liabilities 1,519.2 1,197.3 Investments 536.1 368.9 Goodwill 16,917.4 8,447.0 Other intangibles 6,784.6 2,129.4 Long-term debt 23,374.7 2,697.4 Deferred income taxes 2,542.7 1,109.5 PROPERTY, PLANT AND EQUIPMENT: Other liabilities 266.4 677.6 Land and improvements 251.1 314.9 Buildings and improvements 836.4 955.1 Total liabilities 27,703.0 5,681.8 Operating plant and equipment 3,650.3 7,933.8 Information processing 368.8 1,048.1 Furniture and fixtures 99.8 173.8 SHAREHOLDERS' EQUITY: Under construction 360.1 496.0 Preferred stock - 0.3 Common stock 4.5 364.5 Total property, plant and equipment 5,566.5 10,921.7 Additional paid-in capital 4,536.7 4,296.8 Less accumulated depreciation 164.9 5,690.3 Accumulated other comprehensive income (loss) (5.3) 9.5 Retained earnings (deficit) (103.4) 7,990.8 Net property, plant and equipment 5,401.6 5,231.4 Total shareholders' equity 4,432.5 12,661.9 Other assets 485.3 89.4 Assets related to discontinued operations 7.0 45.5 TOTAL LIABILITIES AND TOTAL ASSETS $ 32,135.5 $ 18,343.7 SHAREHOLDERS' EQUITY $ 32,135.5 $ 18,343.7 -more-
  • 5. ALLTEL CORPORATION CONSOLIDATED STATEMENTS OF CASH FLOWS-Page 5 (Millions) November 16 - January 1 - December 31, November 15, December 31, 2007 2007 2006 (Successor) (Predecessor) (Predecessor) Cash Flows from Operating Activities: Net income (loss) $ (103.4) $ 286.6 $ 1,129.4 Adjustments to reconcile net income (loss) to net cash provided from (used in) operating activities: Loss (income) from discontinued operations (0.6) 1.5 (305.7) Depreciation and amortization 260.2 1,286.7 1,239.9 Provision for doubtful accounts 32.6 171.6 227.3 Amortization of deferred financing costs 33.9 2.4 3.9 Non-cash portion of gain on exchange or disposal of assets and other - (56.5) (80.0) Change in deferred income taxes (46.7) 42.9 38.7 Adjustment to income tax liabilities, including contingency reserves - (33.8) (29.9) Other, net (1.0) 30.2 (17.8) Changes in operating assets and liabilities, net of effects of acquisitions and dispositions: Accounts receivable (7.7) (242.2) (237.0) Inventories 11.0 11.6 (20.0) Accounts payable (301.6) 327.7 67.2 Other current liabilities 23.5 309.9 (516.4) Other, net (78.2) 8.1 (9.4) Net cash provided from (used in) operating activities (178.0) 2,146.7 1,490.2 Cash Flows from Investing Activities: Additions to property, plant and equipment (192.3) (860.6) (1,164.5) Additions to capitalized software development costs (4.2) (29.1) (32.6) Acquisition of Alltel (25,065.2) - - Purchases of property, net of cash acquired - (6.5) (1,760.6) Proceeds from the sale of investments - 188.7 200.6 Proceeds from the return on investments 13.8 43.5 50.8 Other, net 6.0 (1.0) 12.7 Net cash used in investing activities (25,241.9) (665.0) (2,693.6) Cash Flows from Financing Activities: Dividends paid on common and preferred stock - (176.6) (513.1) Repayments of long-term debt (1,457.8) (36.9) (1,198.5) Repurchases of common stock - (1,360.3) (1,595.6) Cash payments to effect conversion of convertible notes (7.3) - (67.6) Distributions to minority investors (11.2) (31.8) (38.2) Excess tax benefits from stock option exercises - 25.8 12.2 Cash proceeds from the settlement of interest rate swaps 33.9 - - Long-term debt issued, net of issuance costs 22,237.1 - - Common stock issued 4,506.9 63.9 216.0 Net cash provided from (used in) financing activities 25,301.6 (1,515.9) (3,184.8) Cash Flows from Discontinued Operations: Cash provided from operating activities 0.7 3.2 599.5 Cash provided from investing activities - 47.7 3,746.6 Cash used in financing activities - - (0.2) Net cash provided from discontinued operations 0.7 50.9 4,345.9 Effect of exchange rate changes on cash and short-term investments - - (5.9) Increase (decrease) in cash and short-term investments (117.6) 16.7 (48.2) Cash and Short-term Investments: Beginning of the period 950.9 934.2 982.4 End of the period $ 833.3 $ 950.9 $ 934.2 -more-
  • 6. ALLTEL CORPORATION RECONCILIATION OF NET INCOME (LOSS) TO ADJUSTED EBITDA (UNAUDITED)-Page 6 (Millions) THREE MONTHS ENDED October 1 - November 16 - November 15, December 31, December 31, December 31, 2007 2007 2007 2006 (Predecessor) (Successor) (Combined) (Predecessor) Net income (loss) $ (421.8) $ (103.4) $ (525.2) $ 215.9 Loss (income) from discontinued operations (A) 2.4 (0.6) 1.8 19.9 Income tax expense (benefit) (44.3) (64.5) (108.8) 100.3 Interest expense, net of interest income 18.2 265.0 283.2 32.1 Depreciation and amortization 226.7 260.2 486.9 323.9 EBITDA (218.8) 356.7 137.9 692.1 Minority interest in consolidated partnerships 3.0 2.2 5.2 9.5 Equity earnings in unconsolidated partnerships, net of cash distributions received (5.5) 5.7 0.2 (0.5) Stock-based compensation expense, net of restricted shares surrendered for tax (C) 3.8 1.2 5.0 7.9 Integration expenses, restructuring and other charges (D) 613.7 5.2 618.9 2.9 Non-cash rental income, net of amortization of related deferred leasing costs (E) (4.3) - (4.3) (8.5) Other non-cash changes in operating expenses (0.2) 0.3 0.1 (0.6) Management fee paid to Sponsors (F) - 3.9 3.9 - Adjusted EBITDA $ 391.7 $ 375.2 $ 766.9 $ 702.8 -more-
  • 7. ALLTEL CORPORATION RECONCILIATION OF NET INCOME (LOSS) TO ADJUSTED EBITDA (UNAUDITED)-Page 7 (Millions) TWELVE MONTHS ENDED January 1 - November 16 - November 15, December 31, December 31, December 31, 2007 2007 2007 2006 (Predecessor) (Successor) (Combined) (Predecessor) Net income (loss) $ 286.6 $ (103.4) $ 183.2 $ 1,129.4 Loss (income) from discontinued operations (A) 1.5 (0.6) 0.9 (305.7) Income tax expense (benefit) 371.5 (64.5) 307.0 475.0 Interest expense, net of interest income 140.8 265.0 405.8 202.2 Depreciation and amortization 1,286.7 260.2 1,546.9 1,239.9 EBITDA 2,087.1 356.7 2,443.8 2,740.8 Minority interest in consolidated partnerships 30.4 2.2 32.6 46.6 Equity earnings in unconsolidated partnerships, net of cash distributions received (14.1) 5.7 (8.4) (9.4) Gain on exchange or disposal of assets and other (B) (56.5) - (56.5) (126.1) Stock-based compensation expense, net of restricted shares surrendered for tax (C) 26.1 1.2 27.3 33.0 Integration expenses, restructuring and other charges (D) 667.0 5.2 672.2 13.7 Non-cash rental income, net of amortization of related deferred leasing costs (E) (29.7) - (29.7) (33.9) Other non-cash changes in operating expenses 4.7 0.3 5.0 (3.5) Management fee paid to Sponsors (F) - 3.9 3.9 - Pro forma EBITDA for the Midwest Wireless acquisition (G) - - - 91.5 Adjusted EBITDA $ 2,715.0 $ 375.2 $ 3,090.2 $ 2,752.7 -more-
  • 8. ALLTEL CORPORATION NOTES TO RECONCILIATIONS OF NET INCOME (LOSS) TO ADJUSTED EBITDA (UNAUDITED) -Page 8 On November 16, 2007, Alltel Corporation (quot;Alltelquot; or the quot;Companyquot;) was acquired by Atlantis Holdings LLC, a Delaware limited liability company (quot;Atlantis Holdingsquot; or quot;Parentquot;) and an affiliate of private investment funds TPG Partners V, L.P. and GS Capital Partners VI Fund, L.P. (together the quot;Sponsorsquot;). The acquisition was completed through the merger of Atlantis Merger Sub, Inc., a Delaware corporation and wholly-owned subsidiary of Parent, with and into Alltel (the quot;Mergerquot;), with Alltel surviving the Merger as a privately-held, majority-owned subsidiary of Parent. Although Alltel continues as the same legal entity after the Merger, Atlantis Holdings' cost of acquiring Alltel has been pushed-down to establish a new accounting basis for Alltel. Accordingly, the accompanying consolidated financial statements are presented for two periods, Predecessor and Successor, which relate to the accounting periods preceding and succeeding the consummation of the Merger. Alltel has presented its results of operations for the three and twelve months ended December 31, 2007 by adding the operating results for the Predecessor periods October 1, 2007 to November 15, 2007 and January 1, 2007 to November 15, 2007 to the Successor period November 16, 2007 to December 31, 2007. Although this combined presentation does not comply with generally accepted accounting principles (quot;GAAPquot;), Alltel believes that it provides a meaningful method of comparison. Alltel also has presented calculations of earnings before interest, taxes and depreciation and amortization expense (quot;EBITDAquot;) and Adjusted EBITDA. Alltel has included this presentation of Adjusted EBITDA because covenants in Alltel Communications, Inc.’s senior secured credit facilities contain ratios based on this measure. Measurements of Adjusted EBITDA are based on the Company’s calculation of EBITDA (net income (loss), excluding the effects of discontinued operations, and before net interest expense, provision for income taxes and depreciation and amortization) adjusted to exclude unusual items, certain non-cash charges and other items permitted in calculating covenant compliance under the indenture and the credit facilities. Alltel believes that the application of these supplementary adjustments to EBITDA in determining Adjusted EBITDA are appropriate to provide additional information to investors to demonstrate compliance with its financing covenants. If the Company’s Adjusted EBITDA were to decline below certain levels, covenants in the senior secured credit facilities that are based on Adjusted EBITDA, including the maximum senior secured leverage ratio covenant, may be violated and could cause, among other things, an inability to incur further indebtedness and in certain circumstances a default or mandatory prepayment of amounts outstanding under the senior secured term loan facility. EBITDA and Adjusted EBITDA are not measures calculated in accordance with GAAP and should not be considered a substitute for operating income (loss), net income (loss) or any other measure of financial performance reported in accordance with GAAP or as measures of operating cash flows or liquidity. The presentation of EBITDA has limitations as an analytical tool, and should not be considered in isolation, or as a substitute for analysis of the Company’s results of operations or cash flows as reported under GAAP. In particular, EBITDA and Adjusted EBITDA should not be viewed as a reliable indicator of Alltel’s ability to generate cash to service its debt obligations because certain of the items added to net income (loss) to determine EBITDA and Adjusted EBITDA involve outlays of cash. As a result, actual cash available to service the Company’s debt obligations will be different from Adjusted EBITDA. In addition to demonstrating compliance with its financing covenants, Alltel believes that the presentation of EBITDA and Adjusted EBITDA is helpful in highlighting operational trends because these measures exclude certain non-cash charges and other non-operating items that are not representative of the Company’s core business operations. (A) The following are included in discontinued operations: On November 7, 2007, Alltel signed a definitive agreement to sell one of its wireless markets for cash. Accordingly, this market has been classified from that date as discontinued operations. The sale is expected to be completed by mid-2008. As a condition of receiving approval for its acquisition of Midwest Wireless Holdings (quot;Midwest Wirelessquot;), Alltel agreed to divest certain wireless operations in Minnesota. The operations in Minnesota have been reported as discontinued operations from September 7, 2006 to the date of sale, April 3, 2007. On July 17, 2006, Alltel completed the spin-off of its wireline business. The wireline operations have been reported as discontinued operations for all periods presented. On August 1, 2005, as part of its acquisition of Western Wireless Corporation (quot;Western Wirelessquot;), Alltel acquired international operations in eight countries. The international operations have been reported as discontinued operations from August 1, 2005 through the dates of sale. All of the international operations were sold by June 2006. (B) The following are included in gain on exchange or disposal of assets and other: Through its merger with Western Wireless, Alltel acquired marketable equity securities. On January 24, 2007, Alltel completed the sale of these securities for $188.7 million in cash and recorded a pretax gain from the sale of $56.5 million. On July 17, 2006, in order to effect the spin-off of its wireline telecommunications business to its stockholders, Alltel contributed all of the assets of its wireline telecommunications business to ALLTEL Holding Corp. (quot;Alltel Holdingquot; or quot;Spincoquot;), a wholly-owned subsidiary of the Company, in exchange for: (i) the issuance to Alltel of Spinco common stock that was distributed on a pro rata basis to Alltel’s stockholders as a tax-free stock dividend, (ii) the payment of a special dividend to Alltel in the amount of $2.3 billion and (iii) the distribution by Spinco to Alltel of $1.7 billion of Spinco debt securities. Also on July 17, 2006, Alltel completed a debt exchange in which Alltel transferred to two investment banks the Spinco debt securities received in the spin-off transaction in exchange for certain Alltel debt securities, consisting of $988.5 million of outstanding commercial paper borrowings and $685.1 million of 4.656 percent notes due May 17, 2007. In completing the debt exchange, Alltel incurred a pretax loss of $27.5 million. -more-
  • 9. ALLTEL CORPORATION NOTES TO RECONCILIATIONS OF NET INCOME (LOSS) TO ADJUSTED EBITDA (UNAUDITED) (CONTINUED) -Page 9 On August 25, 2006, Alltel repurchased prior to maturity $1.0 billion of long-term debt, consisting of $664.3 million of 4.656 percent equity unit notes due 2007, $61.0 million of 6.65 percent unsecured notes due 2008, $147.0 million of 7.60 percent unsecured notes due 2009 and $127.7 million of 8.00 percent notes due 2010 pursuant to cash tender offers announced by the Company on July 31, 2006. Concurrent with the debt repurchase, Alltel also terminated the related pay variable/receive fixed, interest rate swap agreement that had been designated as a fair value hedge against the 6.65 percent unsecured notes due 2008. In connection with the early termination of the debt and interest rate swap agreement, Alltel incurred net pretax termination fees of $23.0 million. During 2005, federal legislation was enacted which included provisions to dissolve and liquidate the assets of the Rural Telephone Bank (quot;RTBquot;). In connection with the dissolution and liquidation, during April 2006, the RTB redeemed all outstanding shares of its Class C stock. As a result, Alltel received liquidating cash distributions of $198.7 million in exchange for its $22.1 million investment in RTB Class C stock. (C) Compensation expense recognized by Alltel related to restricted stock and stock option awards. Excludes $63.8 million of expense resulting from the accelerated vesting of employee stock option and restricted stock awards in connection with the Merger. This amount has been included in integration expenses, restructuring and other charges as discussed below. (D) The following are included in integration expenses, restructuring and other charges: During 2007, in connection with the 2006 purchase of Midwest Wireless and properties in Illinois, Texas and Virginia, Alltel incurred system conversion and other integration costs totaling $12.0 million to convert the acquired properties to Alltel's customer billing and support systems. Also during 2007, in connection with the closing of two call centers, Alltel recorded severance and employee benefit costs of $4.5 million and lease termination fees of $2.6 million. In connection with the Merger, Alltel incurred during the Predecessor period $647.9 million of incremental costs, which include financial advisory, legal, accounting, regulatory filing, and other fees of $177.6 million, stock-based compensation expense of $63.8 million related to the accelerated vesting of employee stock option and restricted stock awards, a curtailment charge of $118.6 million resulting from the termination and payout of the supplemental executive retirement plan, and additional compensation-related costs of $287.9 million primarily related to change-in-control payments to certain executives, bonus payments and related payroll taxes. During the Successor period, Alltel incurred $5.2 million of incremental expenses related to the Merger which included insurance premiums of $4.2 million to obtain retroactive indemnification coverage for departing directors and officers for events that occurred prior to the Merger and $1.0 million in employee retention bonuses. During 2006, Alltel incurred $10.8 million of integration expenses related to its acquisition of Western Wireless, consisting of costs incurred to convert Western Wireless' customer billing and operational support systems to Alltel's internal systems. The Company also incurred $2.9 million of integration expenses related to its purchase of Midwest Wireless completed on October 3, 2006 and the acquisitions of wireless properties in Illinois, Texas and Virginia completed during the second quarter of 2006. These expenses primarily consisted of branding, signage and computer system conversion costs. (E) Represents non-cash rental income and amortization of deferred leasing costs related to Alltel's agreement to lease cell site towers to American Tower Corporation. The deferred rental income was received in advance by Alltel under the terms of the leasing agreement. The remaining deferred rental income and deferred leasing costs were written-off in connection with the Merger. (F) Represents the annual management fee and out-of-pocket expenses payable to affiliates of the Sponsors in exchange for consulting and management advisory services. The annual management fee is equal to one percent of Alltel’s consolidated Adjusted EBITDA. (G) Represents the historical EBITDA of Midwest Wireless for the nine months ended September 30, 2006 assuming the acquisition of Midwest Wireless had occurred on January 1, 2006. -end-