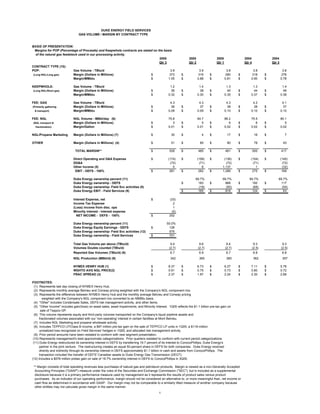
1. DUKE ENERGY FIELD SERVICES
GAS VOLUME / MARGIN BY CONTRACT TYPE
BASIS OF PRESENTATION:
Margins for POP (Percentage of Proceeds) and Keepwhole contracts are stated on the basis
of the natural gas feedstock used in our processing activity.
2005 2005 2005 2004 2004
Qtr 3 Qtr 2 Qtr 1 Qtr 4 Qtr 3
CONTRACT TYPE (10):
POP: Gas Volume - TBtu/d 3.9 3.9 3.8 3.8 3.8
Margin (Dollars in Millions) $ 373 $ 316 $ 280 $ 318 $ 276
(Long NGL/Long gas)
Margin/MMbtu $ 1.05 $ 0.88 $ 0.81 $ 0.90 $ 0.78
KEEPWHOLE: Gas Volume - TBtu/d 1.2 1.4 1.3 1.3 1.4
Margin (Dollars in Millions) $ 36 $ 38 $ 40 $ 44 $ 49
(Long NGL/Short gas)
Margin/MMbtu $ 0.32 $ 0.30 $ 0.35 $ 0.37 $ 0.38
FEE: GAS Gas Volume - TBtu/d 4.3 4.3 4.3 4.2 4.1
Margin (Dollars in Millions) $ 36 $ 37 $ 38 $ 38 $ 37
(Primarily gathering
Margin/MMbtu $ 0.09 $ 0.09 $ 0.10 $ 0.10 $ 0.10
& transport)
FEE: NGL NGL Volume - MBbl/day (6) 75.8 84.7 86.2 75.5 80.1
Margin (Dollars in Millions) $ 3 $ 5 $ 6 $ 6 $ 5
(NGL transport &
Margin/Gallon $ 0.01 $ 0.01 $ 0.02 $ 0.02 $ 0.02
fractionation)
NGL/Propane Marketing Margin (Dollars in Millions) (7) $ 30 $ 4 $ 17 $ 16 $ 7
OTHER Margin (Dollars in Millions) (4) $ 51 $ 85 $ 80 $ 78 $ 43
TOTAL MARGIN** $ 528 $ 485 $ 461 $ 500 $ 417
Direct Operating and G&A Expense $ (174) $ (158) $ (136) $ (154) $ (145)
DD&A (72) (71) (72) (71) (72)
Other Income (5) 0 6 1,137 1 (32)
EBIT - DEFS - 100% $ 281 $ 262 $ 1,389 $ 275 $ 169
Duke Energy ownership percent (11) 69.7% 69.7% 69.7% 69.7%
Duke Energy ownership - DEFS $ 183 $ 968 $ 192 $ 117
Duke Energy ownership- Field Svc activities (8) (18) (50) (68) (54)
Duke Energy EBIT - Field Services (9) $ 165 $ 918 $ 124 $ 63
Interest Expense, net $ (33)
Income Tax Expense 2
(Loss) income from disc. ops 1
Minority interest - interest expense (0)
NET INCOME - DEFS - 100% $ 252
Duke Energy ownership percent (11) 50.0%
Duke Energy Equity Earnings - DEFS $ 126
Duke Energy ownership- Field Svc activities (12) 575
Duke Energy ownership - Field Services $ 701
Total Gas Volume per above (TBtu/d) 9.4 9.6 9.4 9.3 9.3
Volumes Double counted (TBtu/d) (2.7) (2.7) (2.7) (2.5) (2.5)
Reported Gas Volumes (TBtu/d) (9) 6.7 6.9 6.7 6.8 6.8
NGL Production (MBbl/d) (9) 342 365 360 362 357
NYMEX HENRY HUB (1) $ 8.37 $ 6.73 $ 6.27 $ 7.11 $ 5.76
WGHTD AVG NGL PRICE(2) $ 0.91 $ 0.75 $ 0.73 $ 0.80 $ 0.72
FRAC SPREAD (3) $ 2.37 $ 1.97 $ 2.24 $ 2.30 $ 2.66
FOOTNOTES:
(1) Represents last day closing of NYMEX Henry Hub.
(2) Represents monthly average Belvieu and Conway pricing weighted with the Company's NGL component mix.
(3) Represents the difference between NYMEX Henry Hub and the monthly average Belvieu and Conway pricing
weighted with the Company's NGL component mix converted to an MMBtu basis.
(4) quot;Otherquot; includes Condensate Sales, DEFS risk management activity, and other items.
(5) quot;Other Incomequot; includes gain/(loss) on asset sales, asset impairments, and Minority Interest. 1Q05 reflects the $1.1 billion pre-tax gain on
sale of Teppco GP.
(6) This volume represents equity and third party volumes transported on the Company's liquid pipeline assets and
fractionated volumes associated with our 'non-operating' interest in certain facilities at Mont Belvieu.
(7) Includes NGL Marketing and propane wholesale activity.
(8) Includes TEPPCO LP/Class B income, a $97 million pre-tax gain on the sale of TEPPCO LP units in 1Q05, a $118 million
unrealized loss recognized on Field Services' hedges in 1Q05, and allocated risk management activity.
(9) Prior period amounts have been restated to conform with new segment presentation.
(10) Represents management's best approximate categorizations. Prior quarters restated to conform with current period categorizations.
(11) Duke Energy restructured its ownership interest in DEFS by transferring 19.7 percent of its interest to ConocoPhillips, Duke Energy's
partner in the joint venture. The restructuring creates an equal 50-percent share in DEFS for both companies. Duke Energy received
directly and indirectly through its ownership interest in DEFS approximately $1.1 billion in cash and assets from ConocoPhillips. The
transaction included the transfer of DEFS' Canadian assets to Duke Energy Gas Transmission (DEGT).
(12) Includes a $576 million pretax gain on sale of 19.7% ownership interest in DEFS to ConocoPhillips in 3Q05.
** Margin consists of total operating revenues less purchases of natural gas and petroleum products. Margin is viewed as a non-Generally Accepted
Accounting Principles (quot;GAAPquot;) measure under the rules of the Securities and Exchange Commission (quot;SECquot;), but is included as a supplemental
disclosure because it is a primary performance measure used by management as it represents the results of product sales versus product
purchases. As an indicator of our operating performance, margin should not be considered an alternative to, or more meaningful than, net income or
cash flow as determined in accordance with GAAP. Our margin may not be comparable to a similarly titled measure of another company because
other entities may not calculate gross margin in the same manner.
1