More Related Content
Similar to Duke Energy 2Q04_DEFS_Margin_by_Contract_Schedule
Similar to Duke Energy 2Q04_DEFS_Margin_by_Contract_Schedule (20)
Duke Energy 2Q04_DEFS_Margin_by_Contract_Schedule
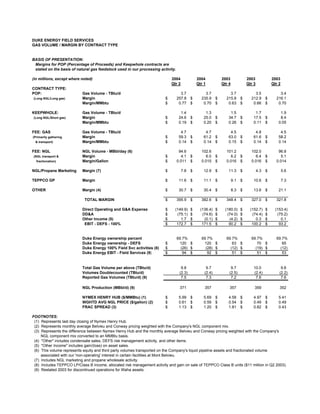
- 1. DUKE ENERGY FIELD SERVICES
GAS VOLUME / MARGIN BY CONTRACT TYPE
BASIS OF PRESENTATION:
Margins for POP (Percentage of Proceeds) and Keepwhole contracts are
stated on the basis of natural gas feedstock used in our processing activity.
(in millions, except where noted) 2004 2004 2003 2003 2003
Qtr 2 Qtr 1 Qtr 4 Qtr 3 Qtr 2
CONTRACT TYPE:
POP: Gas Volume - TBtu/d 3.7 3.7 3.7 3.5 3.4
Margin $ 257.8 $ 235.9 $ 215.8 $ 212.9 $ 216.1
(Long NGL/Long gas)
Margin/MMbtu $ 0.77 $ 0.70 $ 0.63 $ 0.66 $ 0.70
KEEPWHOLE: Gas Volume - TBtu/d 1.4 1.3 1.5 1.7 1.9
Margin $ 24.6 $ 25.0 $ 34.7 $ 17.5 $ 8.4
(Long NGL/Short gas)
Margin/MMbtu $ 0.19 $ 0.20 $ 0.26 $ 0.11 $ 0.05
FEE: GAS Gas Volume - TBtu/d 4.7 4.7 4.5 4.8 4.5
Margin $ 59.3 $ 61.2 $ 63.0 $ 61.6 $ 58.2
(Primarily gathering
Margin/MMbtu $ 0.14 $ 0.14 $ 0.15 $ 0.14 $ 0.14
& transport)
FEE: NGL NGL Volume - MBbl/day (6) 94.6 102.6 101.2 102.0 96.8
Margin $ 4.1 $ 6.0 $ 6.2 $ 6.4 $ 5.1
(NGL transport &
Margin/Gallon $ 0.011 $ 0.015 $ 0.016 $ 0.016 $ 0.014
fractionation)
NGL/Propane Marketing Margin (7) $ 7.8 $ 12.9 $ 11.3 $ 4.3 $ 5.6
TEPPCO GP Margin $ 11.6 $ 11.1 $ 9.1 $ 10.6 $ 7.3
OTHER Margin (4) $ 30.7 $ 30.4 $ 8.3 $ 13.6 $ 21.1
TOTAL MARGIN $ 395.9 $ 382.6 $ 348.4 $ 327.0 $ 321.8
Direct Operating and G&A Expense $ (149.9) $ (136.4) $ (180.0) $ (152.7) $ (153.4)
DD&A $ (75.1) $ (74.6) $ (74.0) $ (74.4) $ (75.2)
Other Income (5) $ 1.7 $ (0.1) $ (4.2) $ 0.3 $ 0.1
EBIT - DEFS - 100% $ 172.7 $ 171.5 $ 90.2 $ 100.2 $ 93.2
Duke Energy ownership percent 69.7% 69.7% 69.7% 69.7% 69.7%
Duke Energy ownership - DEFS $ 120 $ 120 $ 63 $ 70 $ 65
Duke Energy 100% Field Svc activities (8) $ (26) $ (28) $ (12) $ (19) $ (12)
Duke Energy EBIT - Field Services (9) $ 94 $ 92 $ 51 $ 51 $ 53
Total Gas Volume per above (TBtu/d) 9.8 9.7 9.7 10.0 9.8
Volumes Doublecounted (TBtu/d) (2.3) (2.4) (2.5) (2.4) (2.2)
Reported Gas Volumes (TBtu/d) (9) 7.5 7.3 7.2 7.6 7.6
NGL Production (MBbl/d) (9) 371 357 357 359 352
NYMEX HENRY HUB ($/MMBtu) (1) $ 5.99 $ 5.69 $ 4.58 $ 4.97 $ 5.41
WGHTD AVG NGL PRICE ($/gallon) (2) $ 0.61 $ 0.59 $ 0.54 $ 0.49 $ 0.49
FRAC SPREAD (3) $ 1.13 $ 1.20 $ 1.81 $ 0.82 $ 0.43
FOOTNOTES:
(1) Represents last day closing of Nymex Henry Hub.
(2) Represents monthly average Belvieu and Conway pricing weighted with the Company's NGL component mix.
(3) Represents the difference between Nymex Henry Hub and the monthly average Belvieu and Conway pricing weighted with the Company's
NGL component mix converted to an MMBtu basis.
(4) quot;Otherquot; includes condensate sales, DEFS risk management activity, and other items.
(5) quot;Other Incomequot; includes gain/(loss) on asset sales.
(6) This volume represents equity and third party volumes transported on the Company's liquid pipeline assets and fractionated volume
associated with our 'non-operating' interest in certain facilities at Mont Belvieu.
(7) Includes NGL marketing and propane wholesale activity.
(8) Includes TEPPCO LP/Class B income, allocated risk management activity and gain on sale of TEPPCO Class B units ($11 million in Q2 2003).
(9) Restated 2003 for discontinued operations for Waha assets.