SlideShare a Scribd company logo
1 of 91
1
Acquisition cost of long-lived assets: the following items
represent expenditures (or receipts) related to construction of a
new home office for Lowery company.
Cost of land site, which include an old apartment building
appraised at $75,000 $165,000
Legal fees, including fee for title search
$2100
Payment of apartment building mortgage and related interest
due at time of sale $9300
Payment for delinquent property taxes assumed by the purchaser
$4000
Cost of razing the apartment building
$17,000
Proceeds from sale of salvaged materials
($3800)
Grading to establish proper drainage flow on land site
$1900
Architects fee on new building
$300,000
Proceeds from sales of excess dirt (from basement excavation)
to owner of adjoining property (that was used to fill in a low
area on property) ($2000)
Payment to building contractor
$5,000,000
Payment of medical bills of employee accidentally injured while
inspecting building construction
$1400
Special assessment for paving city sidewalks (paid to city)
$18,000
Cost of paving driveway parking lot
$25,000
Cost of installing lights in parking lot
$9200
Premium for insurance on building during construction
$7500
Cost of open house party to celebrate the opening of new
building $8000
Required
From the given data, calculate the proper balances for land,
building, and land improvements accounts of Lowery Company.
2
Depreciation method: on January 2, Roth Inc. purchased a laser
cutting machine to be used in the fabrication of a part for one of
its key products. The machine cost $80,000, and its estimated
useful life was four years or 1 million cuttings, after which it
could be sold for $5000.
Required
Calculate the depreciation expense for each year of the
machines useful life under each of the following depreciation
methods:
a. straight-line
b. double declining balance
c. Units of production. Assume annual production and cuttings
of:
a. 200,000
b. 350,000
c. 260,000
d. 190,000
3
Depreciation method: on January 2, 2012, Alvarez Company
purchased an electroplating machine to help manufacture a part
for one of its key products. The machine cost $218,700 and was
estimated to have a useful life of six years or 700,000
pleadings, after which it could be sold for $23,400.
Required
a. calculate each year’s depreciation expense for the period
2012-2017 under each of the following depreciation methods:
1. straight-line
2. double declining balance
3. Units of production. (Assume annual production in pleadings
of:
i. 140,000
ii. 180,000
iii. 100,000
iv. 110,000
v. 80,000
vi. 90,000
b. Assume that the machine was purchased on September 1,
2012. Calculate each year’s depreciation expense for the period
2012 through 2018 under each of the following depreciation
methods:
1. straight-line
2. double declining balance
4
Accounting for planting and intangible assets: selected
transactions of Continental publishers Inc., for 2013 are given
below:
Jan 2: paid $90,000 to purchase copyrights to a series of
romantic novels. The copyrights expire in 40 years, although
sales of the novels are expected to stop after 10 years.
Mar 1: discovered a satellite dish antenna has been destroyed by
lightning. The losses covered by insurance and a claim is found
today. The antenna cost $9180 when installed on July 1, 2012.
And was being depreciated for over 12 years with the $900
salvage value. Straight-line depreciation was last recorded on
December 31, 2012. Continental expects to receive an insurance
settlement of $8100
Apr 1: paid $120,000 to remodel space to create an employee
exercise area on the lower level in a least building. The
buildings remaining useful life is 40 years; the lease on the
building expires in 12 years.
Jul 1: paid $270,000 to acquire a patent on a new publishing
process. The patent has a remaining legal life of 15 years.
Continental estimates to new process will be utilized for six
years before it becomes obsolete.
Nov 1: paid $63,000 to obtain a four-year franchise to sell a
new series of computerized do-it-yourself manuals.
Required:
a. Prepare journal entries to record these transactions.
b. Prepare the December 31 journal entries to record
depreciation and amortization expense for assets acquired
during the year. Continental uses straight-line depreciation and
amortization.
5
Contingent liabilities: determine which of the following
transactions represent contingent liabilities for Kelly leasing
and indicate the proper accounting treatment for the company’s
fiscal year-end, by placing the letter of the correct accounting
treatment in the space provided
A. accrue liability and disclose in the financial statement notes
B. disclose the financial statement footnotes only
C. no disclosure
1. Kelly leasing was sued by a customer who claimed the
equipment they least was not up to standards described by
Koby. Kobe stands by its claims and can support all the item
specifications. Koby plans to vigorously defend itself and
believes the chances of losing the lawsuit a remote.
2. A government audit of Koby found that the company is in
violation of several work safety regulations. Koby has been
notified that it will be assessed a fine of $25,000. Koby has
agreed to make the safety changes so that it will be in
compliance with the regulations.
3. Koby leasing has been served a lawsuit by a customer that
claims he was injured from one of the products leased from
Koby. Koby plans to defend itself in court, but his lawyers
believe there is a 50-50 chance that they will lose and be forced
to pay $50,000.
6
Recording payroll and payroll taxes: Beamon Corporation had
the following payroll for April:
Officer salaries
$32,000
Sales salaries $67,000
Federal income taxes withheld
$19,000
FICA taxes withheld $7500
Health insurance premiums withheld
$1600
Union dues withheld $1200
Salaries (including above) subject to federal unemployment
taxes$55,000
Salaries (including above) subject to state unemployment taxes
$60,000
Required prepare journal entries on April 30 to record:
a. Accrual of the monthly payroll.
b. Payment of the net payroll.
c. Accrual of employer’s payroll taxes. (Assume that FICA tax
matches the amount withheld, if the federal unemployment tax
is 0.6%, and the state unemployment tax is 5.4%.)
d. Payment of all liabilities related to this payroll. (Assume that
all are settled at the same time)
-538-
Inzinerine Ekonomika-Engineering Economics, 2014, 25(5),
538–548
Finding a New Way to Increase Project Management Efficiency
in Terms of Time
Reduction
Seweryn Spalek
Silesian University of Technology
Gliwice, Poland
E-mail. [email protected]
http://dx.doi.org/10.5755/j01.ee.25.5.8419
There are three basic constraints called ‘the golden triangle’ in
each project: time, budget and scope. Researchers and
practitioners are trying to find a way to increase the efficacy of
the project’s outcomes in terms of shortening the project’s
duration, lowering budgetary costs and meeting the scope.
Although several publications have been written on that topic,
there is still no common solution in place. However, more in-
depth research related to the specific type of projects or
industries is being conducted and this paper seeks to incorporate
additional knowledge into that contemporary field.
Furthermore, this is of growing importance in modern, turbulent
times, where the expectations of profiting from lessons
learned are ever increasing.
Following the current market demands, in the article a new,
innovative approach is proposed to manage the expectation
that future projects will have a shorter duration. Therefore, the
idea of creating specific roadmaps is proposed, which
should help the decision makers improve the efficacy of project
management in the company, where the process of such
improvement is measured using the maturity levels assessment
concept.
Based on the world-wide quantitative studies in the
construction, information technology and machinery industries,
specific roadmaps for each industry were determined. The
purpose of these roadmaps is to indicate the most effective
investment sequence in the increase of project management
maturity, which should result in a decrease of future projects’
duration. Moreover, discussions on the limitations of such
investments are examined.
Keywords: Investment, Time pressure, Company, Projects,
Improvement, PM, Implementation of Strategies, Knowledge,
Innovation.
Introduction
Three of the world’s most recognized Latin words,
“Citius, Altius, Fortius,” meaning “Faster, Higher,
Stronger”, have been the Olympic motto since 1894. At the
time: Pierre de Coubertin proposed the motto, having
borrowed it from his friend Henri Didon, a Dominican
priest who taught sport close to Paris (IOC, 2007, p. 5).
These three words encourage the athlete to give his or
her best during competition. To better understand the
motto, we can compare it with the Olympic creed: “The
most important thing in life is not the triumph, but the
fight; the essential thing is not to have won, but to have
fought well.” Together, the Olympic motto and the creed
represent an ideal that Coubertin believed in and promoted
as an important life lesson that could be gained from
participation in sport and the Olympic Games: that giving
one’s best and striving for personal excellence was a
worthwhile goal. It is a lesson that can still be applied
equally today, not just to athletes but to each one of us
(IOC, 2007, p. 5).
Modern project management has its roots (Lenfle and
Loch, 2010, p. 33) in the atomic bomb Manhattan project
(Morris, 1994, p. 18) and the ballistic missile projects,
Atlas and Polaris (Kerzner, 2013). The term “modern
project management” is used by some authors and relates
mostly to the project management approach started in the
1950s and continuing through today (Chen et al., 2011;
Hill, 2004; Lenfle & Loch, 2010; Shenhar, 2001).
Remarkably, from the very beginning of contemporary
project management, projects were, and continue to be,
under similar time pressure (Campos Silva et al., 2012;
Chen et al., 2012; Griffin, 1993, 1997; Herroelen & Leus,
2005; Omorede et al., 2013; Radziszewska-Zielina, 2010;
Zavadskas et al., 2010). Kach and colleagues (2012, p.
377) state: The speed of technological change and
shortened product life cycles have made the time-to-market
requirements for developing new products increasingly
stringent (Kessler and Chakrabarti, Langerak et al., 2010;
Heightened competitive forces have motivated many firms
to move their new products through the design and
manufacturing pipeline at a faster rate, encouraging greater
focus on accelerated development and compressed time
lines (Prasnikar & Skerlj, 2006; Wright et al., 1995).
The above statement for NPD (new product
development) projects can be applied to most projects,
whatever their nature. In our current, turbulent times, the
pressure of time seems to increase to an ever greater
extent. Project managers and their teams experience
similar pressure to athletes: to beat the record and to go
faster and faster. The first word, “Citius”, of the Olympic
hendiatris1 seems to dominate projects managed by
1 Hendiatris is a figure of speech in which three words are used
to
emphasize one idea, for example, Wine, women, and song.
Hendiatris is
often used to create mottos for organizations; for example, The
motto at
West Point is “Duty, Honor, Country.” see K. Wilson and J.
Wauson, the
AMA handbook of business writing: the ultimate guide to style,
grammar,
Inzinerine Ekonomika-Engineering Economics, 2014, 25(5),
538–548
- 539 -
companies today. The majority of project stakeholders
(executives, sponsors, clients, managers) expect new
projects to be completed faster than ever.
Moreover, companies are always careful about
spending money. Therefore, they also want to know
where to invest their typically limited funds. This issue
also arises when deciding where to invest to shorten the
time of future projects.
This paper gives new insight into the dilemma of
where and when to invest limited company funds to
achieve the best approach to time reduction of future
projects.
(R)evolution in Managing Projects
Project management has evolved throughout history.
This evolution has occurred mostly due to the tools and
techniques applied to single projects and the gradual
improvement of human resource management (Avots,
1969). This situation lasted until the 1990s, when the
number of projects executed by companies increased.
Moreover, companies’ operating environments became
turbulent (Keil & Mahring, 2010). Furthermore, the
influence of project outcomes on the success of an entire
company increased (Baron & Hannan, 2002). As a result,
companies placed a greater emphasis on project
management. To speed up time-to-market, companies
experienced increased pressure to reduce the duration of
projects. The existing methods for reducing the time of
ongoing single projects (e.g., application of modern
scheduling techniques supported by computer technology)
(Brucker et al., 1999; Iacovou & Dexter, 2004) are
significant; however, they are no longer sufficient. A new,
more efficient and revolutionary approach to managing
companies’ portfolios of projects was needed (Cooper et
al., 1999). This need generated new approaches for how to
better manage projects to face the new challenges
appearing in multi-project (Hofman, 2014), dynamic
environments (Spalek, 2013). Accordingly, new concepts
in project management were introduced, focusing on
project environment and knowledge management (del
Cano and de la Cruz, 2002; Ethiraj et al., 2005;
Neverauskas and Stankevicius, 2008; Pemsel & Wiewiora,
2013). Among these concepts is the idea of assessing the
maturity level of project management in the company
(Cooke-Davies, 2007; Fraser et al., 2003; Spalek, 2014;
Tan et al., 2011).
Assessing Maturity: the Purpose
To gain competitive advantage in executing projects,
companies wanted to know how well they manage projects
while taking into consideration different aspects
influencing the effective execution of projects (Kerzner,
2013; Rudzianskaite-Kvaraciejiene et al., 2010). The
assessment outcomes should note the areas for potential
improvement (Ahmad et al., 2013).
This expectation can be fulfilled by project
management maturity assessment. There are several
existing models of maturity assessment; however, their
main purpose remains the same: to identify weak and
usage, punctuation, construction, and formatting (New York:
American
Management Association, 2010, p. 216).
strong areas in an organization (Belt et al., 2009). By
knowing its strengths and weaknesses, a company can
undertake actions to improve activities related to the
management of projects, resulting in an increased maturity
level and improved project outcomes.
The majority of existing models assess project
management maturity level on a scale from 1 to 5, where 1
represents the lowest and 5 the highest level (Khoshgoftar
& Osman, 2009). The assessment is performed in different
areas related to project management. Therefore, the
assessment results in a matrix with maturity scores and
testing areas (Spalek, 2011).
Increasing Maturity: the Investment in the Future
It is critical to understand that an increase of maturity
level will mostly benefit future projects. Increasing by one
maturity level up also has some impact, however limited,
on existing projects. Because the planning phase in each
project is crucial (Wyrozebski & Spalek, 2014), the biggest
possible improvements are associated with future projects.
There is even a well–known quotation saying2:
“Show me how your project starts and I can tell you
how it will end.”
If the level of maturity is increased, e.g., from level 1
to 2, the outcomes of that action will be beneficial in new
projects. For existing projects, it will usually be too late to
have an impact.
Therefore, the decision to assess and then increase the
project management maturity level in a company is an
investment in future projects.
Investment “in maturity” is time consuming and
money intensive; therefore, to achieve the highest possible
time reduction of future projects, it is crucial to decide
where and when (in which sequence) a company
investment should be placed. Moreover, a company’s
investment funds are often very limited, making the issue
even more important. Therefore, it is essential for
companies today to have a road map guiding decision
makers on the following topic:
“In which areas and in what sequence should limited
funds be most effectively invested in my company?”.
The Research Method
The prediction of the future is a complex issue (Glenn
& Gordon, 2003), often involving various methods and
techniques, and thus has a wide record in
publications.(Booth, 2006; Galbraith & Merrill, 1996;
Lacher et al., 1995; Landeta, 2006; Onkal et al., 2013).
To predict reduction of the future time of projects,
questionnaire-based cross-impact analysis was used
following the ideas presented by Fabiana Scapolo and Ian
Miles (2006, p. 680–681). The method included the
following steps:
data analysis and conclusions.
2 Author unknown, also exists as: “Show me how your project
starts and I
can tell you how it will finish” or “Show me how your project
starts and I
show you how it will end”.
Seweryn Spalek. Finding a New Way to Increase Project
Management Efficiency in Terms of Time Reduction
- 540 -
Three Industries: Construction, Information
Technology and Machinery
The research presented in this article was part of a
larger effort supported by the National Science Centre,
focusing on world-wide studies of maturity in project
management in the chosen industries. The overall research
was designed in two major steps.
The first step was to conduct quantitative empirical
studies on project management maturity levels in three types
of industries: machinery, construction and information
technology. Data from 447 global companies, mostly
medium- and large-sized ones, was collected. Ninety-eight
per cent of them earned over € 2,000,000 per year, and 99,5
% of them employed over 49 people.
The second step, which is discussed in this study, was
designed to investigate the relationship between the
increase in maturity level in project management and the
predicted duration of forthcoming projects.
The Assessment
For the purpose of this study, a model was used that
assesses the company’s project management maturity in
four areas (Spalek, 2011):
, 2011);
2000);
Kjaer, 2012);
2011).
The description of the maturity assessment areas is
shown in table 1.
Table 1
Project Management Maturity Assessment Areas
ID Area Description
1. Human Resources staffing, career paths, motivation, training,
team work
2. Methods (incl. Tools &
Techniques)
methods, tools, techniques and means used for project planning
and execution; risk, requir ements, scope, costs, time
and quality management
3. Environment organizational structures, top management
support, stakeholders’ management, company culture
4. Knowledge Management lessons learned approach, gathering
data and experience for on-going operations and future
references
In the applied project management maturity model the
results of the assessment are reported from level 1 to 5:
3: Appliance;
-improvement.
The experts were asked to express their opinion on an
increase of maturity level by one increment (from 1 to 2,
from 2 to 3, etc.) and how it influences the time reduction
of future projects in their companies. The possible impact
was measured on a scale from 1 to 5, as shown in table 2.
The assessment was made separately in each testing area.
Table 2
The Impact on Time Reduction on Future Projects
Impact Level Description
1 No influence
2 1–10 %
3 11–20 %
4 21–30 %
5 over 30 %
In our study, the experts were practitioners from the
investigated companies. The invitation to participate in this
study was sent to 308 chosen experts as a follow-up to the
major global study on project management maturity. The
experts were chosen based on the demographic information
obtained in the first step of the overall research. They were
experienced managers that had at least five years of
experience and possessed a deep knowledge of the projects
executed in their companies. Moreover, the invitations
were sent to experts from companies that reported a
maturity level of at least 2 in each of the testing areas.
The response rate was 63 %. Such a high rate was
obtained as there were individually approached named
persons who expressed, in the first step of overall research,
their willingness to participate in the second step of the
studies. Non-response bias was tested by comparing the
demographic data of participating and non-participating
experts. No significant difference was found, proving that
survey respondents represent the overall sample accurately.
Results and Discussion
Data from 39 information technology, 48 construction
and 107 machinery industry global companies was
collected. The reliability of data was checked using
Cronbach’s alpha, resulting in a value of over 0,9 in each
testing area.
Data analysis using mean, median and mode values
was performed. The equality of variances was tested using
Levene's test and the equality of means using a t-test, and
satisfactory results were obtained as the significance for
Levene’s test was greater than 0,05. Additionally,
Spearman's rho correlation coefficients and factor analysis
using rotated component matrix were calculated for further
rigid data analyses. The data analysis was performed using
Statistical Package for the Social Sciences (IBM SPSS
build V21.0.0).
The results revealed differences in the predicted
impact of change in maturity level on the duration of future
projects. This level of impact depended on the specific
change in the designated area of assessment (e.g., a change
from level 1 to 2 in the knowledge management area) and
varied between industries.
The Impact on Future Projects: by Maturity Area
and Type of Industry
The data analysis revealed that the dispersion of the
acquired data is low; consequently, the mean value was
chosen to explain the results. Using the mean value allows
Inzinerine Ekonomika-Engineering Economics, 2014, 25(5),
538–548
- 541 -
the results to be presented more clearly, without going into
deep statistical details and allows the development of a
full, more comprehensive picture. The mean values of
impact on the future projects are shown in table 3.
The Impact on Future Projects by Industry (CONS, IND, IT)
and Change of Maturity Level in the Areas of Methods (M),
Human Resources (HR), Project Environment (E) and
Knowledge Management (KM).
Table 3
Statistics (Mean Value of Impact on Future Projects)
M
1–2
M
2–3
M
3–4
M
4–5
HR
1–2
HR
2–3
HR
3–4
HR
4–5
E
1–2
E
2–3
E
3–4
E
4–5
KM
1–2
KM
2–3
KM
3–4
KM
4–5
CONS 3,96 3,96 3,21 2,46 3,96 3,96 3,21 2,46 3,21 3,21 2,46
1,71 3,21 3,21 2,46 1,71
IND 3,88 3,88 3,16 2,44 3,88 3,88 3,16 2,44 3,16 3,16 2,44 1,72
3,16 3,16 2,44 1,72
IT 3,90 3,90 3,15 2,41 3,90 3,90 3,15 2,41 3,87 3,87 3,13 2,38
3,87 3,87 3,13 2,38
The impact on future projects depends on the type of
industry. The highest impact levels (3,96) were observed
for the change from level 1 to 2 and from 2 to 3 in the
methods (M) and human resources (HR) areas in the
construction industry (CONS). The lowest impact (1.71)
also appeared in the construction industry; however, it was
observed in the areas of environment (E) and knowledge
management (KM) for the change of maturity from level 4
to 5. Note, in each type of the studied industries, the
potential impact on future projects is the highest if the
company is at the initial (1) or standardized (2) level of
maturity in project management and wants to increase it by
going one level up. This observation is true for each
assessment area: methods, human resources, environment
and knowledge management.
When a company reports already having appliance (3)
or system management (4), maturity levels and wants to
increase it by one level, the impact on future projects’
duration subsequently decreases. However, this reduction
is greater in the construction and machinery industries than
in information technology companies. Therefore, which
project management maturity area the company should first
invest funds in to reduce the future project’s duration
depends on the type of industry. Moreover, the investment
sequence depends on the current level of maturity in the
company in each testing area, meaning that for a chosen
industry, one should consider a different roadmap, showing
where and in which sequence the investment in project
management maturity should be placed.
Different Industries, Different Approach?
This study on the influence of the increase of project
management maturity on future projects’ time reduction
was focused on three types of industries:
that has projects that are, to some extent, inherited in its
long history. The projects associated with these sectors are
described and considered by numerous authors (Davies et
al., 2009; Dominguez et al., 2009).
which are admittedly spread throughout the globe. The IT
projects are described and discussed for many different
types, such as agile (Thomke and Reinertsen, 1998) or
Internet projects (Mahadevan, 2000).
background of the above two industries as well as many
others, is present in many countries and is a backbone
industry for the other sectors. Therefore, its importance for
the global economy is very high. However, a limited amount
of research in this particular sector can be found in the
literature. The examples are mostly qualitative case studies
describing new product development (NPD) practices
(Ahmad et al., 2013; Huang et al., 2004; Matsui et al.,
2008), which are crucial for machinery industry companies.
The Investment Road Map: The Idea
Based on the factor analysis (as shown in Table 4), a
road map is proposed showing the investment path in
maturity areas, which should result in the biggest pay-offs
in reduction of time in future projects. Analysing the
groups of factors in the table, the proposed roadmaps for
the companies was built. This road map operates in the
areas of methods and techniques (M), human resources
(HR), project environment (E) and project knowledge
management (KM), as well as the associated change in
level of maturity (e.g., from 2 to 3), which is noted, for
example, as follows: M 2–3 (the change in maturity from
level 2 to 3 in the area of methods and techniques).
In general, note that at the beginning of the road map,
the investment has the biggest impact on the duration of
future projects and subsequently decreases along the way.
Table 4
Factor Analysis
Rotated Component Matrixa,b
Component
1 2 3
M2-3 ,964 ,245 -,088
HR1-2 ,964 ,245 -,088
HR2-3 ,964 ,245 -,088
M1-2 ,964 ,245 -,088
HR3-4 ,953 ,265 ,146
E1-2 ,953 ,265 ,146
KM2-3 ,953 ,265 ,146
KM1-2 ,953 ,265 ,146
E2-3 ,953 ,265 ,146
M3-4 ,953 ,265 ,146
M4-5 ,719 ,253 ,648
HR4-5 ,719 ,253 ,648
E3-4 ,719 ,253 ,648
KM3-4 ,719 ,253 ,648
KM4-5 -,019 ,093 ,992
E4-5 -,019 ,093 ,992
Extraction Method: Principal Component Analysis.
Rotation Method: Varimax with Kaiser Normalization.
a. BRANCH=CONS; b. Rotation converged in 18 iterations
Rotated Component Matrixa,b
Component
1 2 3
HR1-2 ,964 ,250 -,074
HR2-3 ,964 ,250 -,074
Seweryn Spalek. Finding a New Way to Increase Project
Management Efficiency in Terms of Time Reduction
- 542 -
Rotated Component Matrixa,b
Component
1 2 3
M1-2 ,964 ,250 -,074
M2-3 ,964 ,250 -,074
E2-3 ,945 ,265 ,191
KM2-3 ,945 ,265 ,191
E1-2 ,945 ,265 ,191
M3-4 ,945 ,265 ,191
KM1-2 ,945 ,265 ,191
HR3-4 ,945 ,265 ,191
KM4-5 -,102 ,049 ,990
E4-5 -,102 ,049 ,990
KM3-4 ,641 ,226 ,733
HR4-5 ,641 ,226 ,733
M4-5 ,641 ,226 ,733
E3-4 ,641 ,226 ,733
Extraction Method: Principal Component Analysis.
Rotation Method: Varimax with Kaiser Normalization.
a. BRANCH=IND; b. Rotation converged in 18 iterations.
Rotated Component Matrixa,b
Component
1 2 3
HR1-2 ,947 ,148 ,272
HR2-3 ,947 ,148 ,272
M1-2 ,947 ,148 ,272
M2-3 ,947 ,148 ,272
KM2-3 ,934 ,190 ,297
E2-3 ,934 ,190 ,297
E1-2 ,934 ,190 ,297
KM1-2 ,934 ,190 ,297
HR3-4 ,817 ,227 ,519
M3-4 ,817 ,227 ,519
E3-4 ,783 ,284 ,543
KM3-4 ,783 ,284 ,543
HR4-5 ,288 ,327 ,891
M4-5 ,288 ,327 ,891
E4-5 ,254 ,387 ,872
KM4-5 ,254 ,387 ,872
Extraction Method: Principal Component Analysis.
Rotation Method: Varimax with Kaiser Normalization.
a. BRANCH=IT; b. Rotation converged in 9 iterations.
The Investment Road Map: Construction Industry
The construction sector is one of the largest industries
traditionally associated with using project management.
The proposed road map revealed that the biggest pay-off is
associated with an increase of maturity level from 1 to 2
and from 2 to 3 in the methods (M 1–2, M 2–3) and human
resources areas (HR 1–2, HR 2–3).
The road map can be described in the following four
steps:
Step One
Assuming that the company is at an initial (1) maturity
level in all areas, the first step in investment should be an
increase of maturity in the methods (M) and human
resources areas (HR) until they reach the level 3.
Step Two
Then, in the second step, the investment should be
placed in gradually reaching level 3 in the environment and
knowledge management areas (E 1–2, E 2–3, KM 1–2,
KM 2–3), and the increase in methods and human
resources should continually increase until they reach level
4 (HR 3–4, M 3–4).
Step Three
The third step should include activities improving the
maturity in the environment and knowledge management
areas until they report level 4 (E 3–4, KM 3–4) and the
methods and human resources areas until level 5 (M 4–5,
HR 4–5).
Step Four
Finally, in the fourth step, the increase should be from
level 4 to 5 in the environment and knowledge
management areas (E 4–5, KM 4–5).
Figure 1 shows the investment road map for the
construction industry.
Figure 1. Investment road map for the construction industry
M 1–2,
M 2–3,
HR 1–2,
HR 2–3
E 1–2,
E 2–3,
KM 1–2,
KM 2–3,
HR 3–4,
M 3–4
E 3–4,
KM 3–4,
M 4–5,
HR 4–5
E 4–5,
KM 4–5
STEP 1 STEP 2 STEP 3 STEP 4
Inzinerine Ekonomika-Engineering Economics, 2014, 25(5),
538–548
- 543 -
Comparing Steps in Construction Companies: the
Reduction of Impact
Remarkably, if assuming that in the first step, the impact
on reduction of time of future projects is 100, then in the
second step, it equals 81; in the third, 62; and in the fourth,
43.
This information is useful for investments in a specific
company, as companies in the same industry differ from one
another. After performing the first step, the total investment
and detailed impact on a project’s duration can be measured.
Then, knowing the predicted reduction of impact, one can
estimate the possible outcomes in the second step toward the
investment effort and decide if it is worth it to proceed. The
same approach can be performed before step three and four.
Following this advice means, of course, that time gaps are
needed between successive steps to reassess the situation.
The Investment Road Map: Information Technology
After construction, the second industry traditionally
associated with the project management sector is
information technology (IT). Moreover, both industries
report a long project management application history.
The investment road map for information technology
consists of six steps.
Step One
In step one, the investment in increasing project
management maturity levels should be performed to go from
level 1 to 2 and from 2 to 3 in the methods and human
resources areas (M 1–2, M 2–3, HR 1–2, HR 2–3).
Step Two
After the first investments, the company should consider
investments to increase the level of maturity from 1 to 2 and
then from 2 to 3 in the remaining two areas: environment
and knowledge management (E 1–2, E 2–3, KM 1–2, KM
2–3).
Step Three
In the third step, the project management maturity level
should be increased from 3 to 4 in the methods and human
resources areas (M 3–4, HR 3–4).
Step Four
In this step, as in step three, one goes up from level 3 to
4 in the environment and knowledge management areas (E
3–4, KM 3–4).
Step Five
The fifth step is designated for improvement in the
methods and human resources areas from level 4 to 5 (M 4–
5, HR 4–5).
Step Six
In the last step, the investment should be placed to
increase the maturity level from 4 to 5 in the areas of
environment and knowledge management (E 4–5, KM 4–5).
Figure 2 shows the investment road map for information
technology companies.
Figure 2. Investment road map for information technology
companies
Comparing Steps in IT Companies: The Reduction of
Impact
The highest potential impact on future projects in the
IT industry occurs when investing in the areas indicated in
the first step and then gradually decreases.
Assuming that the impact in the first step equals 100,
the impact on future projects’ duration of investment in
step two is 99. Accordingly, in step three, the duration is
81; in step four, 80; in step five, 62; and, finally, in step
six, 61.
Despite a relatively greater number of steps in
comparison to the construction industry, the differences
between some pairs of steps (1 and 2, 3 and 4, 5 and 6) are
small. Thus, the decision to continue the investment after
each step is of a different nature than in the construction
industry where differences are bigger.
The Investment Road Map: Machinery Industry
The products of the machinery industry are the
machines, tools, parts and devices used by the other
industries. This industry, like construction and IT, also has
a wide representation among companies world-wide.
M 1-2,
M 2-3,
HR 1-2,
HR 2-3
E 1-2,
E 2-3,
KM 1-2,
KM 2-3
M 3-4,
HR 3-4
E 3-4,
KM 3-4
STEP 1 STEP 2 STEP 3 STEP 4
M 4-5,
HR 4-5
STEP 5 STEP 6
E 4-5,
KM 4-5
Seweryn Spalek. Finding a New Way to Increase Project
Management Efficiency in Terms of Time Reduction
- 544 -
However, a limited amount of project management related
research exists for this sector.
The investment in project management maturity in the
machinery industry should be considered in the following
four steps:
Step One
In the first step, the investment in an increase of
maturity levels from 1 to 2 and, successively, from 2 to 3
should be considered in the areas of methods and human
resources (M 1–2, M 2–3, HR 1–2, HR 2–3).
Step Two
The next investments should be focused on further
increases in the methods and human resources areas up to
level 4 and, in parallel, they should be focused on further
increases in the areas of environment and knowledge
management from levels 1 to 3 (M 3–4, HR 3–4, E 1-2, E
2–3, KM 1–2, KM 2–3).
Step Three
In step three, an increase of project management
maturity up to level 4 is advised in the environment and
knowledge management areas (E 3–4, KM 3–4).
Additionally, investment in the methods and human areas
is suggested until they reach level 5 (M 4–5, HR 4–5).
Step Four
This final step is dedicated to the environment and
knowledge management areas to reach a level 5 of project
management maturity (E 4–5, KM 4–5).
Figure 3 shows the investment road map for the
machinery industry.
Figure 3. Investment road map for the machinery industry
Comparing Steps in Machinery Industry Companies:
the Reduction of Impact
If one assumes that the possible impact on future
project time reduction in the machinery industry equals 100
as a result of performing step 1, the execution of step 2 will
thus result in an impact level of 81. For steps 3 and 4, there
is a further reduction of impact to 64 and 44, respectively.
After performing each step and comparing the effort
undertaken to the reported project outcomes, this
information can be used to decide whether to continue with
further investments in increasing maturity levels.
Conclusions
The Traditional vs. Agile Approach to Managing
Projects
The outcomes for the construction and machinery
industries are alike, whereas the results of the study in
information technology companies differs. This could be
the result of similarities between the type of projects
undertaken by both the construction and machinery
industry and the different projects undertaken by IT
companies. The construction and machinery industry
companies execute projects in a more traditional approach,
whereas IT projects have a greater tendency to migrate
toward agility in project management. The concepts of
traditional vs. agile approach in project management are
widely discussed by (Fernandez & Fernandez, 2008;
Shenhar & Dvir, 1996). That contrast would explain the
major differences between the proposed investment
roadmaps that are associated with either a more traditional
or agile approach to project management.
Construction and Machinery: the Traditional
Approach
In the traditional approach, the general advice is to
invest gradually in all four areas of maturity with some
advance investment in project management standards, tools
and techniques and in the competencies of people involved
in projects. The investment in company structures
supporting project execution or project knowledge
management areas should be considered in direct relation
to progress in the methods and human resources areas.
Information Technology: The Agile Approach
Agility, as defined by its founders3, is less focused on
strict methods and tools and more on knowledge flow,
creating an appropriate working environment and team
building processes (Dingsoyr et al., 2012). Therefore,
3 see: http://agilemanifesto.org/; accessed November 2013.
M 1–2,
M 2–3,
HR 1–2,
HR 2–3
E 1–2,
E 2–3,
KM 1–2,
KM 2–3,
HR 3–4,
M 3–4
KM 4–5
E 4–5
E 3–4,
KM 3–4,
M 4–5,
HR 4–5
STEP 1 STEP 2 STEP 3 STEP 4
Inzinerine Ekonomika-Engineering Economics, 2014, 25(5),
538–548
- 545 -
explaining why the investment in that type of project
should be performed gradually and in parallel in each of
the following areas: methods, human resources,
environment and knowledge management.
Although this study is limited to three industries, the
suggested roadmaps can be used by other industries as
well, especially by a wide range of manufacturing
companies (NAICS, 2012). A company can choose a road
map by assessing the similarities of the projects being
executed to construction and machinery or IT projects.
However, for some sectors, such as healthcare (Adler et
al., 2003) or education (Palacios-Marques et al., 2013),
more studies are needed to develop their specific road
maps systems.
Continuous Improvement? Not Necessary!
The majority of academics and practitioners think that
continuous improvement is vital for a company’s
operations and its survival in the turbulent market. This
approach is also a noticeable concept of increasing project
management maturity levels as a continuous process,
which should result in reaching the highest maturity level
in all assessment areas.
However, based on existing studies of maturity
(Becker et al., 2009; Grant & Pennypacker, 2006; Mullaly
&Thomas, 2010; Pasian, 2011; Rohrbeck, 2010), the vast
majority of companies today report, on average, the second
or third level of maturity in different industries and
assessment areas. Therefore, more effort is put into
discussing how the company should proceed with maturity
improvement to achieve “the top.” However, some doubts
exist if “the top” is even obtainable as there is a risk that
assessment criteria can be changed over time as project
management develops further. The first signs of such an
approach are described in the model proposed by PMI
(2008), in which no levels of maturity are defined. Instead,
maturity is measured using a best practices list, which is
continuously expanded by the PMI. This approach results
in a “never ending” continuous effort to increase project
management maturity in the company.
Continuous improvement, however appropriate in
theory, cannot always be the best solution for a company.
As our study revealed, the impact of the increase of
maturity on the reduction of future projects decreases over
subsequent levels of maturity. The biggest impact occurs
at the very beginning when a company is making its first
steps on the road map. Then, the impact decreases by more
than 50 % in the traditional approach to project
management (represented by construction and machinery
industries) and by approximately 40 % in the agile
approach (represented by information technology
companies). This brings into the question whether
continuous improvement in maturity is effective for the
company in terms of invested funds and achieved
outcomes.
Therefore, there should be time breaks in between
steps on the investment road map to measure, ex post4, the
4 The translation from Latin means "after the fact". The use of
historical
returns has traditionally been the most common way to predict
the
probability of incurring a loss on any given day. Ex-post is the
opposite of
real impact of the increase in project management maturity
on the recorded project’s time reduction.
Based on this study, one knows the size of the
predicted decrease of impact in the next step for traditional
and agile projects. Therefore, one can compare possible
benefits with the estimated effort needed to continue with
the next step on the road map. As a result, one can
conclude that the investment in further progress in project
management maturity does not pay off and the limited
company’s investment funds can be spent on other more
promising and vital company activities.
Limitations and Future Directions
The research is limited to three types of industries,
represented by 194 organisations with 107 belonging to
machinery, 48 to construction and 19 to IT companies. In
quantitative analysis, the size of this sample, especially of
the latter two industries, can be assumed to be rather small.
Therefore, definitive conclusions and generalisations
supporting the outcomes of our study should await a larger
sample, especially of IT and construction industries.
The method of the prediction of the costs of
forthcoming projects by investigating experts’ opinions is
constrained by the quality of the respondents’ judgment, as
is the case in all surveys of experts. Generally, predicting
future outcomes is an extremely difficult issue (Glenn &
Gordon, 2003). However, it was a conscious decision to
use this method, despite its limitations, to advance the
current stage of knowledge.
Some of the limitations of the study can be
strengthened to show the directions for future research.
The mainstream method would be to investigate the other
industries for which projects are a vital part of their
operations with the same method. Therefore, follow-up
research could be dedicated to the automotive, aerospace
or mining sectors.
Moreover, a study on the relationship between
different investment types and an increase in maturity level
would be advised. It would also be desirable for a new
study to investigate the direct influence of different types
of investments on projects’ outcomes.
It may also be worth considering research into
checking whether project management is not
geographically sensitive, as the other recent studies on
project management performance areas suggest.
The results of this study advance the current state of
knowledge in the project management area. However, the
problem of linking investments in project management to
outcomes for an entire company is complex. Hence, the
considerations presented in the paper provide a better
understanding of this complexity in the area of project
duration and could be a trigger point for further studies of
other types of project outcomes.
Acknowledgments
This work was supported by the National Science
Centre grant.
ex-ante, which means "before the event". Source:
http://www.investopedia.com/ retrieved on November 2013.
Seweryn Spalek. Finding a New Way to Increase Project
Management Efficiency in Terms of Time Reduction
- 546 -
References
Adler, P. S., Riley, P., Kwon, S. W., Signer, J., Lee, B., &
Satrasala, R. (2003). Performance improvement capability:
Keys to accelerating performance improvement in hospitals.
California Management Review, 45(2).
http://dx.doi.org/10.2307/41166163
Ahmad, S., Mallick, D. N., & Schroeder, R. G. (2013). New
Product Development: Impact of Project Characteristics and
Development Practices on Performance. Journal of Product
Innovation Management, 30(2), 331–348.
http://dx.doi.org/10.1111/j.1540-5885.2012.01002.x
Avots, I. (1969). Why Does Project Management Fail.
California Management Review, 12/1, 77–82.
http://dx.doi.org/10.2307/41164208
Baron, J. N., & Hannan, M. T. (2002). Organizational blueprints
for success in high-tech start-ups: Lessons from the
Stanford Project on emerging companies. California
Management Review, 44(3). http://dx.doi.org/10.2307/41166130
Basu, R. (2014). Managing quality in projects: An empirical
study. International Journal of Project Management, 32(1),
178–187. http://dx.doi.org/10.1016/j.ijproman.2013.02.003
Becker, J., Knackstedt, R., & Poppelbuss, J. (2009). Developing
Maturity Models for IT Management - A Procedure
Model and its Application. Business & Information Systems
Engineering, 1(3).
Belt, P., Oiva-Kess, A., Harkonen, J., Mottonen, M., & Kess, P.
(2009). Organisational maturity and functional
performance. International Journal of Management and
Enterprise Development, 6(2), 147–164.
http://dx.doi.org/10.1504/IJMED.2009.022624
Booth, H. (2006). Demographic forecasting: 1980 to 2005 in
review. International Journal of Forecasting, 22(3), 547–
581. http://dx.doi.org/10.1016/j.ijforecast.2006.04.001
Brucker, P., Drexl, A., Mohring, R., Neumann, K., & Pesch, E.
(1999). Resource-constrained project scheduling: Notation,
classification, models, and methods. European Journal of
Operational Research, 112(1), 3–41.
http://dx.doi.org/10.1016/S0377-2217(98)00204-5
Campos Silva, D. D., Santiago, L. P., & Silva, P. M. S. (2012).
Impact of Premature Information Transfer on Cost and
Development Time of Projects. IEEE Transactions on
Engineering Management, 59(4), 692–704.
http://dx.doi.org/10.1109/TEM.2012.2187661
Chen, B., Liou, F. M., & Huang, C. P. (2012). Optimal
Financing Mix of Financially Non-Viable Private-Participation
Investment Project with Initial Subsidy. Inzinerine Ekonomika-
Engineering Economics, 23(5), 452–461.
Chen, Y. Q., Liu, J. Y., Li, B., & Lin, B. (2011). Project
delivery system selection of construction projects in China.
Expert Systems with Applications, 38(5), 5456–5462.
http://dx.doi.org/10.1016/j.eswa.2010.10.008
Cooke-Davies, T. (2007). Project Management Maturity Models.
In P. W. G. Morris and J. K. Pinto (Eds.), Wiley Guide to
Managing Projects (pp. 1234–1255). Hoboken, NJ, USA: John
Wiley & Sons. http://dx.doi.org/10.
1002/9780470172391.ch49
Cooper, R. G., Edgett, S. J., & Kleinschmidt, E. J. (1999). New
product portfolio management: Practices and performance.
Journal of Product Innovation Management, 16(4), 333–351.
http://dx.doi.org/10.1016/S0737-6782(99)00005-3
Davies, A., Gann, D., & Douglas, T. (2009). Innovation in
Megaprojects: Systems Integration At London Heathrow
Terminal 5. California Management Review, 51(2).
http://dx.doi.org/10.2307/41166482
del Cano, A., & de la Cruz, M. P. (2002). Integrated
methodology for project risk management. Journal of
Construction
Engineering and Management-Asce, 128(6), 473–485.
http://dx.doi.org/10.1061/(ASCE)0733-9364(2002)128:6(473)
Dingsoyr, T., Nerur, S., Balijepally, V., & Moe, N. B. (2012). A
decade of agile methodologies: Towards explaining agile
software development. Journal of Systems and Software, 85(6).
http://dx.doi.org/10.1016/j.jss.2012.02.033
Dominguez, D., Worch, H., Markard, J., Truffer, B., & Gujer,
W. (2009). Closing the Capability Gap: Strategic Planning
For The Infrastructure Sector. California Management Review,
51(2). http://dx.doi.org/10.2307/41166479
Elbanna, A. (2013). Top management support in multiple-
project environments: an in-practice view. European Journal of
Information Systems, 22(3), 278–294.
http://dx.doi.org/10.1057/ejis.2012.16
Ethiraj, S. K., Kale, P., Krishnan, M. S., & Singh, J. V. (2005).
Where do capabilities come from and how do they matter?
A study in the software services industry. Strategic Management
Journal, 26(1), 25–45.
http://dx.doi.org/10.1002/smj.433
Fernandez, D. J., & Fernandez, J. D. (2008). Agile Project
Management - Agilism Versus Traditional Approaches. Journal
of Computer Information Systems, 49(2), 10–17.
Fraser, P., Farrukh, C., & Gregory, M. (2003). Managing
product development collaborations - a process maturity
approach. Proceedings of the Institution of Mechanical
Engineers Part B-Journal of Engineering Manufacture,
217(11), 1499-1519.
http://dx.doi.org/10.1243/095440503771909890
Galbraith, C. S., & Merrill, G. B. (1996). The politics of
forecasting: Managing the truth. California Management
Review,
38(2). http://dx.doi.org/10.2307/41165831
Inzinerine Ekonomika-Engineering Economics, 2014, 25(5),
538–548
- 547 -
Gary, K., Enquobahrie, A., Ibanez, L., Cheng, P., Yaniv, Z.,
Cleary, K., Kokoori, S., Muffih, B., & Heidenreich, J. (2011).
Agile methods for open source safety-critical software.
Software-Practice & Experience, 41(9).
http://dx.doi.org/10.1002/spe.1075
Gasik, S. (2011). A Model of Project Knowledge Management.
Project Management Journal, 42(3), 23–44.
http://dx.doi.org/10.1002/pmj.20239
Glenn, J. C., & Gordon, T. J. (2003). Futures Research
Methodology. Washington D.C.: The United Nations University.
Grant, K. P., & Pennypacker, J. S. (2006). Project management
maturity: An assessment of project management
capabilities among and between selected industries. IEEE
Transactions on Engineering Management, 53(1), 59–68.
http://dx.doi.org/10.1109/TEM.2005.861802
Griffin, A. (1993). Metrics for Measuring Product Development
Cycle Time. Journal of Product Innovation Management,
10(2), 112–125. http://dx.doi.org/10.1016/0737-6782(93)90003-
9
Griffin, A. (1997). The effect of project and process
characteristics on product development cycle time. Journal of
Marketing Research, 34(1), 24–35.
http://dx.doi.org/10.2307/3152062
Herroelen, W., & Leus, R. (2005). Project scheduling under
uncertainty: Survey and research potentials. European Journal
of Operational Research, 165(2), 289–306.
http://dx.doi.org/10.1016/j.ejor.2004.04.002
Hill, G. M. (2004). Evolving the project management office, a
competency continuum. Information Systems Management,
21(4), 45–51.
http://dx.doi.org/10.1201/1078/44705.21.4.20040901/84187.6
Hofman, M. (2014). Models of PMO functioning in a multi-
project environment. Procedia - Social and Behavioral
Sciences, 119, 46–54.
Huang, X. L., Soutar, G. N., & Brown, A. (2004). Measuring
new product success: an empirical investigation of
Australian SMEs. Industrial Marketing Management, 33(2),
117–123. http://dx.doi.org/10.1016/S0019-
8501(03)00034-8
Iacovou, C. L., & Dexter, A. S. (2004). Turning around runaway
information technology projects. California Management
Review, 46(4). http://dx.doi.org/10.2307/41166275
IOC (2007). The Olympic symbols, 2nd ed.. The Olympic
Museum: International Olympic Committee.
Ji, F., & Sedano, T. (2011). Comparing Extreme Programming
and Waterfall Project Results. IEEE.
Kach, A., Azadegan, A., & Dooley, K. J. (2012). Analyzing the
successful development of a high-novelty innovation
project under a time-pressured schedule. R & D Management,
42(5), 377–400.
Keil, M., & Mahring, M. (2010). Is Your Project Turning into a
Black Hole?. California Management Review, 53(1).
http://dx.doi.org/10.1525/cmr.2010.53.1.6
Kerzner, H. (2013). Project management: a systems approach to
planning, scheduling, and controlling (11 ed.). Hoboken,
NJ: John Wiley & Sons.
Kessler, E. H., and Chakrabarti, A. K. (1996). Innovation speed:
A conceptual model of context, antecedents, and
outcomes. Academy of Management Review, 21(4), 1143–1191.
Khoshgoftar, M., & Osman, O. (2009). Comparison of Maturity
Models. New York: IEEE.
Killen, C. P., & Kjaer, C. (2012). Understanding project
interdependencies: The role of visual representation, culture and
process. International Journal of Project Management, 30(5),
554–566. http://dx.doi.org/10.1016/ j.ijproman.
2012.01.018
Kowalska-Styczen, A., & Sznajd-Weron, K. (2012). Access to
information in word of mouth marketing within a cellular
automata model. Advances in Complex Systems, 15(8), 17
http://dx.doi.org/10.1142/S0219525912500804
Lacher, R. C., Coats, P. K., Sharma, S. C., & Fant, L. F. (1995).
A Neural-Network for Classifying the Financial Health of
a Firm. European Journal of Operational Research, 85(1), 53–
65. http://dx.doi.org/10.1016/0377-2217(93)E0274-2
Landeta, J. (2006). Current validity of the Delphi method in
social sciences. Technological Forecasting and Social
Change, 73(5), 467–482.
http://dx.doi.org/10.1016/j.techfore.2005.09.002
Langerak, F., Griffin, A., & Hultink, E. J. (2010). Balancing
Development Costs and Sales to Optimize the Development
Time of Product Line Additions. Journal of Product Innovation
Management, 27(3), 336–348.
http://dx.doi.org/10.1111/j.1540-5885.2010.00720.x
Lenfle, S., & Loch, C. (2010). Lost Roots: How Project
Management Came to Emphasize Control over Flexibility and
Novelty. California Management Review, 53(1), 32–55.
http://dx.doi.org/10.1525/cmr.2010.53.1.32
Levin, G. (2010). Interpersonal skills for Portfolio, Program,
and Project Managers: Management Concepts.
McDonough, E. F. (2000). Investigation of factors contributing
to the success of cross-functional teams. Journal of
Product Innovation Management, 17(3), 221–235.
http://dx.doi.org/10.1016/S0737-6782(00)00041-2
Mahadevan, B. (2000). Business models for Internet-based E-
commerce: An anatomy. California Management Review,
42(4). http://dx.doi.org/10.2307/41166053
Seweryn Spalek. Finding a New Way to Increase Project
Management Efficiency in Terms of Time Reduction
- 548 -
Matsui, Y., Abdallah, A. B., Sato, O., & Kitanaka, H. (2008).
International Comparison of Manufacturing Practices and
Performance.
Mian, A., Takala, J., & Kekale, T. (2008). Role of
Organizational Culture for Knowledge Sharing in Projects. 2008
Portland International Conference on Management of
Engineering & Technology, Vols 1-5, 962–968.
Morris, P. W. G. (1994). The Management of Projects. London:
Thomas Telford. http://dx.doi.org/10.1680/mop.16934
Mullaly, M. E., & Thomas, J. (2010). Re-thinking project
management maturity. Paper presented at the PMI Research and
Education Conference, Washington, D.C.
NAICS. (2012). North American Industry Classification System
Washington, DC: U.S. Census Bureau.
Neverauskas, B., & Stankevicius, V. (2008). Project
Management: Research and Studies at the Faculty of Economics
and
Management of Kaunas University of Technology. Inzinerine
Ekonomika-Engineering Economics(4), 59–66.
Omorede, A., Thorgren, S., & Wincent, J. (2013). Obsessive
passion, competence, and performance in a project
management context. International Journal of Project
Management, 31(6), 877–888. http://dx.doi.org/10.
1016/j.ijproman.2012.09.002
Onkal, D., Sayim, K. Z., & Gonul, M. S. (2013). Scenarios as
channels of forecast advice. Technological Forecasting and
Social Change, 80(4), 772–788.
http://dx.doi.org/10.1016/j.techfore.2012.08.015
Palacios-Marques, D., Cortes-Grao, R., & Carral, C. L. (2013).
Outstanding knowledge competences and web 2.0
practices for developing successful e-learning project
management. International Journal of Project Management,
31(1), 14–21. http://dx.doi.org/10.1016/j.ijproman.2012.08.002
Pasian, B. L. (2011). Project management maturity: a critical
analysis of existing and emergent contributing factors (pp.
266). Sydney: Faculty of Design, Architecture and Building,
University of Technology.
Pemsel, S., & Wiewiora, A. (2013). Project management office
a knowledge broker in project-based organisations.
International Journal of Project Management, 31(1), 31–42
http://dx.doi.org/10.1016/j.ijproman.2012.03.004
PMI. (2008). Organizational Project Management Maturity
Model (OPM3®), Knowledge Foundation - 2nd Edition (pp.
204). Newtown Square, PA, USA: Project Management
Institute.
Prasnikar, J., & Skerlj, T. (2006). New product development
process and time-to-market in the generic pharmaceutical
industry. Industrial Marketing Management, 35(6), 690–702.
http://dx.doi.org/10.1016/j.indmarman.2005.06.001
Radziszewska-Zielina, E. (2010). Analysis of the Impact of the
Level of Partnering Relations on the Selected Indexes of
Success of Polish Construction Enterprises. Inzinerine
Ekonomika-Engineering Economics, 21(3), 324–335.
Rohrbeck, R. (2010). Towards A Maturity Model For
Organizational Future Orientation. Academy of Management
Proceedings, 2010(1), 1–6.
Rudzianskaite-Kvaraciejiene, R., Apanaviciene, R., &
Butauskas, A. (2010). Evaluation of Road Investment Project
Effectiveness. Inzinerine Ekonomika-Engineering Economics,
21(4), 368–376.
Scapolo, F., & Miles, I. (2006). Eliciting experts' knowledge: A
comparison of two methods. Technological Forecasting
and Social Change, 73(6), 679–704.
http://dx.doi.org/10.1016/j.techfore.2006.03.001
Shenhar, A. J. (2001). One size does not fit all projects:
Exploring classical contingency domains. Management Science,
47(3), 394–414. http://dx.doi.org/10.1287/mnsc.47.3.394.9772
Shenhar, A. J., & Dvir, D. (1996). Toward a typological theory
of project management. Research Policy, 25(4), 607–632.
http://dx.doi.org/10.1016/0048-7333(95)00877-2
Spalek, S. (2011). Managing projects in an industrial
environment. An overview of the project management maturity
models. Paper presented at the 16th Annual International
Conference on Industrial Engineering Theory, Applications
and Practice – IJIE, Stuttgart, Germany.
Spalek, S. (2013). Improving Industrial Engineering
Performance through a Successful Project Management Office.
Inzinerine Ekonomika-Engineering Economics, 24(2), 88–98.
Spalek, S. (2014). Does Investment in Project Management Pay
Off? Industrial Management & Data Systems, 114(5),
832–856. http://dx.doi.org/10.1108/IMDS-10-2013-0447
Tan, W. P., Sauser, B. J., & Ramirez-Marquez, J. E. (2011).
Analyzing Component Importance in Multifunction
Multicapability Systems Developmental Maturity Assessment.
IEEE Transactions on Engineering Management,
58(2), 275–294. http://dx.doi.org/10.1109/TEM.2010.2071877
Thomke, S., & Reinertsen, D. (1998). Agile product
development: Managing development flexibility in uncertain
environments. California Management Review, 41(1).
http://dx.doi.org/10.2307/41165973
Wilson, K., & Wauson, J. (2010). The AMA handbook of
business writing : the ultimate guide to style, grammar, usage,
punctuation, construction, and formatting. New York: American
Management Association.
Wright, R. N., Rosenfield, A. H., & Fowell, A. J. (1995). Report
on Federal Research in Support of the US Construction
Industry. Washington, DC.: National Science and Technology
Council.
Wyrozebski, P., & Spalek, S. (2014). An Investigation of
Planning Practices in Select Companies. Management and
Production Engineering Review, 5(2), 78–87.
http://dx.doi.org/10.2478/mper-2014-0020
Zavadskas, E. K., Turskis, Z., Ustinovichius, L., & Shevchenko,
G. (2010). Attributes Weights Determining Peculiarities
in Multiple Attribute Decision Making Methods. Inzinerine
Ekonomika-Engineering Economics, 21(1), 32–43.
The article has been reviewed.
Received in October, 2014; accepted in December, 2014.
Copyright of Engineering Economics is the property of
Engineering Economics and its
content may not be copied or emailed to multiple sites or posted
to a listserv without the
copyright holder's express written permission. However, users
may print, download, or email
articles for individual use.
Lucrări Ştiinţifice – vol. 55, Supliment /2012, seria Agronomie
145
MIGRANTS’ INTEGRATION PROCESSES IN EU – FIRST
STEPS IN THEIR
NEW HOME COUNTRIES (CASE STUDY: INTEGRA
PROJECT)
Ştefan COLIBABA
1
, Andreea CLEMINTE
2
, Anca COLIBABA
3
, Claudia DINU
4
e-mail: [email protected]
Abstract
Integra is a partnership project which aims work together with
social partners such as migrant communities and
financial institutions from a range of different European
countries to create a Europe wide network of relevant
institutions in order to reach migrants in partner countries to
improve their integration into local society by providing
them with opportunities to gain language skills on basic
financial matters. The first steps for their language integration
into the new society is made through an non formal approach,
based on open interaction, simulation scenarios,
improvisation and creative use of the learning materials,
permanent exchange of questions and answers, reflection time
and feedback opportunities.
Key words: migrant communities, integration, financial
language, simulation scenarios
1
A.I. Cuza University/Fundatia EuroEd, Iasi, Romania
2
Fundatia EuroEd, Iasi, Romania
3
Gr.T.Popa University of Medicine and Pharmacy/Fundatia
EuroEd, Iasi, Romania
4
Gr.T.Popa University of Medicine and Pharmacy, Iasi, Romania
Ever heard of financial integration?
If it„s important for you (as migrant) to
integrate with the local community of your new
home country, then the Migrant Integration Kit
developed during the INTEGRA project contains
financial terminology, a financial glossary, and
sources of financial information that will assist you
by equipping you with the most useful social and
financial phrases which can be helpful in
unfamiliar situations in a new country.
As the main characteristic, Romania remains
an emigration country and becomes not only a
transit country, but also a destination country more
attractive to immigrants. According to Eurostat
forecast, from 2008 - 2060, Romania will have at
least a net immigration rate of 18.4 per thousand
(1.84%). Unlike the Romanian migration
quantified at approximately 10% of Romanian
people, migration phenomenon in Romania is
relatively modest. Data available at the end of
2010 shows that legal immigration holds 0.3% of
the total population (total non-EU immigrants /
total population). According to the National
Commission for Prognosis, in 2013-2015, the
number of immigrants is likely to increase to
200,000 to 300,000 immigrants, which would
mean 1% - 1.4% of the population.
The INTEGRA project (http://integra-
project.eu) brought together partners from 11
countries (LT, GR, DE, ES, TR, IE, NL, RO, GB,
PL and BY) with the aim to work together with
social partners such as migrant communities and
financial institutes to create a Europe wide network
of relevant institutes in order to reach migrants in
partner countries to improve their integration into
local society by providing them with opportunities
to gain language skills on basic financial matters.
Within the context, the partnership managed to
develop the following activities:
1. Research
needs analysis in partner countries produced
to find out about the problems and
experiences that migrants face in a new
country because they do not speak the host
country language and are not familiar even
with the basic norms of everyday life (results
are uploaded on the project website under the
heading "Summary")
good practice examples in each partner
country collected following the template
developed by the coordinating institution on
the financial language training and country
specific financial and banking operations
(results are uploaded on the project website
under the heading "Summary")
comparative analysis produced on the life
situation of migrants in the old and new EU
mailto:[email protected]
http://integra-project.eu/
Universitatea de Ştiinţe Agricole şi Medicină Veterinară Iaşi
146
countries ( results are uploaded on the project
website under the heading "Summary")
2. Contacts and training programs
Contacts established and cooperation
agreements with migrant communities in
partner countries signed
Contacts established and cooperation
agreements with the social partners –
financial, non-governmental and state
institutions working with migrants, signed
The training methodologies and programs for
training representatives from migrant
communities and migrants as final
beneficiaries developed
Collection of the materials and work on the
creation of the active in the future portal
www.integra-project.eu with the assistance
from social partners are underway
3. CD – Migrant Integration KIT
Useful phrases: a list of essential useful
words and phrases in English, Lithuanian,
German, Dutch, Polish, Greek, Spanish,
Romanian, Belorussian and Turkish that
could enhance not only your language but
also general skills for better adaptation to
local society of your new country and labour
market.
Simulations: dialogues on different situations
dealing with financial and social welfare
issues for simulating real life situations and
in such a way as to develop your skills and
confidence in managing your personal matters
in your new country.
Country specific financial tips: specific
information and advise on how to deal with
everyday financial needs in partner countries.
Useful info
- Links to financial institutions or other
financial information sources in all partner
countries (Lithuania, Poland, Germany, Uk,
Ireland, Greece, Spain, Netherlands, Romania,
Belaruss Turkey)
- Links to governmental institutions or other
support organizations working with migrants
in all partner countries (Lithuania, Poland,
Germany, Uk, Ireland, Greece, Spain,
Netherlands, Romania, Belaruss Turkey)
- Links to migrant communities in partner
countries
- Links to other projects or programs working
on migrant integration issues
Info on representatives from migrant
communities. List of contacts of
representatives from migrant communities in
partner countries that you are welcome to get
in touch with.
Good practice examples in partner
countries. Examples of good practices for
improving migrants financial integration from
various projects, activities or actions being
carried out by financial, educational or other
kind of institutions in partner countries, could
help you understand and deal with unfamiliar
situations in your new country
MATERIAL AND METHOD
One of the most important activities of the
project was the organisation and implementation of
the trainings together with language professionals
and financial experts to representatives of migrant
communities in order to cascade that training to
ultimate beneficiaries-migrants from the partner
countries.
Trainings for representatives -
instructors from migrant communities
organized, who will later cascade the acquired
knowledge and gained skills to the final
beneficiaries – migrants from partner countries.
Community representatives were selected
according to the pre-agreed criteria (one of the
most important – good local language skills and
good knowledge of national culture). In each
partner country 8-10 persons were trained. The
most active representatives (3-5 per country) were
included into the European network of trainers
Tthe trainings (training time-10 hours) were
meant for training the instructors on how to use the
developed by the project financial language
teaching program and methodology, based on
elements of drama and introduce the project
website containing the collected teaching/learning
materials and useful info. Every potential instructor
was equipped with a CD containing materials and
methodology guidelines to be used for teaching
final beneficiaries.
Trainings for final beneficiaries –
migrants from partner countries organized with
migrant community representatives acting as
„teachers – instructors“.
Each partner country-10 migrants (average
3 migrants per community), 16 hours training
program (2 hours for project presentation,
introduction into the project website, 12 hours for
trainings following the program , 2 hours for
reflections and summing up).
Trainings were run by the migrant
community representatives - instructors, who have
already integrated in the new environment.
The trainings were developed after the
following Methodology and Guidelines, which has
been elaborated to support the migrant
representatives on how to conduct six (language
skills) workshops’ with migrant communities:
http://www.integra-project.eu/
Lucrări Ştiinţifice – vol. 55, Supliment /2012, seria Agronomie
147
Training session one
1. Carry out an induction in relation to the overall
project.
2. Introduce ‘Representative’ aims – what the
representatives are aiming to accomplish by
conducting the ‘Six Language Skills Workshops’
with migrant communities. These aims are:
To train members of migrant communities to
develop better skills and confidence in managing
personal financial matters;
To develop migrant communities’ basic language
skills for dealing with financial matters.
The financial areas are:
Claiming Social Benefit;
How to use the Website;
Opening a Bank Account;
Exchange and Transfer of Money;
Paying for Services or Products;
Job Related Information;
Negotiating Payments for Accommodation;
Reporting a Stolen Bank Card by Telephone;
Borrowing Money and Getting Credit.
3. Ethos of a Trainer Facilitator.
4. Training in how to conduct Drama Games and
Exercises.
5. Functions of Drama Games and Exercises.
Training session two
1. Website Training for the Representatives.
2. Discussion of content for the first two
Language Skills Workshops i.e. Claiming Social
Benefit and Opening a Bank Account.
3. Representatives themselves practice running /
facilitating under supervision the following drama
games and exercises from workshops one and two
of the Language Skills Workshops. The games
are: Name Game, Culture Shock and Energy
Circle. Also do work on functions of the exercises.
4. Representatives are provided with feedback
from the trainer in relation to the above.
5. Introductory training in Image Work and
Improvisation for the representatives. Look at
Complete the Image and Image of the Word. Work
on functions.
Training session three
1. Representatives themselves again practice
running or facilitating under supervision the
following drama games and exercises from
workshops one and two of the Language Skills
Workshops. The games are: Name Game, Culture
Shock, Energy Circle and Getting to Know You.
2. Representatives are provided with feedback
from the trainer in relation to the above.
3. Representatives themselves practice running
or facilitating under supervision the following
drama games and exercises from workshops two,
three, four and five. The games are: Walk Clap,
Bomb and Shield, Falling and Columbian Hand
Hypnosis.
4. Representatives are provided with feedback
from the trainer in relation to the above.
5. Training in Image Work and Improvisation for
the representatives. Look at Complete the Image,
Image of the Word, and Image of the Hour.
6. Training in ‘How to Read a Script’.
7. Discussion of content for numbers three, four,
five and six from the Language Skills Workshops.
Training session four
1. Representatives themselves practice
running or facilitating under supervision a
short version of workshops Two and Three
from the Language Skills workshops.
2. Representatives are provided with
feedback from the trainer in relation to the
above..
3. Training in Image Work and Improvisation
for the representatives.
4. Training in ‘How to Read a Script’.
After TRAINING SESSION FOUR the two
representatives should ideally go into the
community and conduct (pilot) Workshops One
and Two from the Language Skills workshops with
their migrant communities.
Training session five
1. Discussion and feedback for the
representative’s workshops one and two
conducted with the migrant community.
Representatives discuss with the trainer how the
workshops went.
2. Representatives themselves practice running
or facilitating under supervision a short version of
‘Workshops Four, Five and Six re the Six
Language Skills Workshop Series.
3. Representatives are provided with feedback
from the trainer in relation to the above.
4. Training in Image Work and Improvisation for
the representatives.
5. Training in ‘How to Read a Script’.
Training session six:
1. Reflection on overall training activity.
2. Provide final pointers and support.
3. Opportunity to practice runs a guided
workshop – to be chosen by the representatives.
RESULTS AND DISCUSSIONS
In figures the results of the training process
were:
28 training sessions with 104
hours of training for migrant communities‟
representatives
58 sessions with 195 hours of
trainings with final beneficiaries.
Number of trainers, who trained
representatives: 15
Number of trained representatives:
60
Universitatea de Ştiinţe Agricole şi Medicină Veterinară Iaşi
148
Number of trained final
beneficiaries: 275
Migrant communities involved:
from Afghanistan , Somalia, Russia, Bulgaria,
Belarus, Romania, Lithuania, Palestinia,
Poland , Iraq , Syria, Israel, Tunisia, Portugal,
South Africa, Germany, Sweden, Ireland,
Norway, UK, Denmark, Morocco, Algeria,
Jordan, Taiwan, France, Greece, Moldova,
Nigeria, Senegal, Mali, Cameroon, Pakistan,
Philippines, Ethiopia, Ukraine, India, Eritrea,
Turkey, Armenia, and from Spanish/Latin
American community
Taking into consideration the reflections of
the participants on the trainings, the results were:
What was innovative about the trainings?
adults representing communities of
foreigners in Romania was new and exciting
-formal approach which
is much more encouraging and effective; it
helps people get rid of inhibitions and it
connects them directly to real life situations,
which is actually what is relevant to them.
How much did trainees benefit from the
trainings?
suggested for the training are the real benefit
for people who struggle with a new language
in various cultural, economic and social
contexts. The spot-on activities organized
during the training were a frame for future
practice based on the materials offered in
the Glossary and set of Usual Phrases.
developed teaching techniques, especialy by
using drama and role play activities
What new skills and competences were
gained?
were the interactive techniques for working
with participants, the use of drama and
simulation techniques, role play.
communication and cultural mediation
skills and their specific financial and
banking language.
other competences mentioned were:
groups
forms / materials
communities will get to know each other more
quickly and will interact easier; a feeling of
group belonging was stimulated
Do they feel more confident now in dealing
with financial matters?
fact that after the training I was able to go to
the bank and speak in Romanian”
Romanian”
numbers, dates used in dialogs”
CONCLUSIONS
All the partners proofed the fact that both
trainings were very successful and useful for the
participants. They were of the opinion that
trainings have shown migrants the way how to start
dealing with financial matters by speaking the
language of the host country. The activities
suggested for the training were the real benefit for
people who struggle with a new language in
various cultural, economic and social contexts.
Combining drama methods with concrete
information on financial matters allowed migrants
to feel more relaxed and be open to the learning
process.
ACKNOWLEGMENTS
This article is based on the development of the trainings,
with all the support materials and methodology,
carried out within the INTEGRA project (LLP
GRUNDTVIG Multilateral, 510258-LLP-1-2010-1-
LT-GRUNDTVIG-GMP), co-funded by the
European Union.
REFERENCES
Iris Alexe, Bogdan Paunescu, 2011 - Studiu asupra
fenomenului imigratiei in Romania. Integrarea
strainilor in societatea Romaneasca, ISBN 978-
973-0-10715-9
Sandu (coord), 2006 - Locuire temporară în străinătate:
Migraţia economică a românilor 1990-2006,
Fundaţia pentru o Societate Deschisă
Violeta Mirinaviciute, 2012 - INTEGRA Project and its
Final Product - Migrant Kit, http://www.integra-
project.eu/news-events/article/150-integra-final-
event-international-conference-migrants-
integration-processes-in-eu-first-steps-in-their-
new-home-countries
***http://www.integra-project.eu
http://www.integra-project.eu/news-events/article/150-integra-
final-event-international-conference-migrants-integration-
processes-in-eu-first-steps-in-their-new-home-countries
http://www.integra-project.eu/news-events/article/150-integra-
final-event-international-conference-migrants-integration-
processes-in-eu-first-steps-in-their-new-home-countries
http://www.integra-project.eu/news-events/article/150-integra-
final-event-international-conference-migrants-integration-
processes-in-eu-first-steps-in-their-new-home-countries
http://www.integra-project.eu/news-events/article/150-integra-
final-event-international-conference-migrants-integration-
processes-in-eu-first-steps-in-their-new-home-countries
http://www.integra-project.eu/news-events/article/150-integra-
final-event-international-conference-migrants-integration-
processes-in-eu-first-steps-in-their-new-home-countries
http://www.integra-project.eu/
Copyright of Agronomy Series of Scientific Research / Lucrari
Stiintifice Seria Agronomie is
the property of University of Agricultural Sciences &
Veterinary Medicine of Iasi and its
content may not be copied or emailed to multiple sites or posted
to a listserv without the
copyright holder's express written permission. However, users
may print, download, or email
articles for individual use.

More Related Content

Similar to 1Acquisition cost of long-lived assets the following items repr.docx

Uop acc 422 final exam guide
Uop acc 422 final exam guideUop acc 422 final exam guide
Uop acc 422 final exam guidemybrands1
 
Number of Pages 2 (Double Spaced)Language Style English (U.S.).docx
Number of Pages 2 (Double Spaced)Language Style English (U.S.).docxNumber of Pages 2 (Double Spaced)Language Style English (U.S.).docx
Number of Pages 2 (Double Spaced)Language Style English (U.S.).docxhopeaustin33688
 
Acc 561 final exam b. done
Acc 561 final exam b. doneAcc 561 final exam b. done
Acc 561 final exam b. donechestcasemo1987
 
ACC 422 Final Exam Guide With EXCEL FILE seek Your Dream/uophelpdotcom
ACC 422 Final Exam Guide With EXCEL FILE seek Your Dream/uophelpdotcomACC 422 Final Exam Guide With EXCEL FILE seek Your Dream/uophelpdotcom
ACC 422 Final Exam Guide With EXCEL FILE seek Your Dream/uophelpdotcomapjk534
 
University of Maryland University CollegeFinal Examination.docx
University of Maryland University CollegeFinal Examination.docxUniversity of Maryland University CollegeFinal Examination.docx
University of Maryland University CollegeFinal Examination.docxdickonsondorris
 
ACC 422 Final Exam Guide With EXCEL FILE seek Your Dream/acc422martdotcom
ACC 422 Final Exam Guide With EXCEL FILE seek Your Dream/acc422martdotcomACC 422 Final Exam Guide With EXCEL FILE seek Your Dream/acc422martdotcom
ACC 422 Final Exam Guide With EXCEL FILE seek Your Dream/acc422martdotcomapjk538
 
ACC 422 Final Exam Guide With EXCEL FILE seek Your Dream/snaptutorialdotcom
ACC 422 Final Exam Guide With EXCEL FILE seek Your Dream/snaptutorialdotcomACC 422 Final Exam Guide With EXCEL FILE seek Your Dream/snaptutorialdotcom
ACC 422 Final Exam Guide With EXCEL FILE seek Your Dream/snaptutorialdotcomapjk536
 
Instructions1. For the questions requiring a written explanatio.docx
Instructions1. For the questions requiring a written explanatio.docxInstructions1. For the questions requiring a written explanatio.docx
Instructions1. For the questions requiring a written explanatio.docxnormanibarber20063
 
1. (TCO 4) Which of the following is true regarding the eval.docx
1. (TCO 4) Which of the following is true regarding the eval.docx1. (TCO 4) Which of the following is true regarding the eval.docx
1. (TCO 4) Which of the following is true regarding the eval.docxdorishigh
 
ACC 251 Intro to Managerial AccountingChapters 9 through 12 .docx
ACC 251 Intro to Managerial AccountingChapters 9 through 12 .docxACC 251 Intro to Managerial AccountingChapters 9 through 12 .docx
ACC 251 Intro to Managerial AccountingChapters 9 through 12 .docxnettletondevon
 
Fin 571 final exam
Fin 571 final examFin 571 final exam
Fin 571 final examsmith54655
 
Fin 571 final exam
Fin 571 final examFin 571 final exam
Fin 571 final examliam111221
 
Fin 571 final exam
Fin 571 final examFin 571 final exam
Fin 571 final examnbvghytr657
 
Bus 475 guide 1 54) When customers access a Web site and make purchases, t...
Bus 475 guide 1    54) When customers access a Web site and make purchases, t...Bus 475 guide 1    54) When customers access a Web site and make purchases, t...
Bus 475 guide 1 54) When customers access a Web site and make purchases, t...jackkumaran
 
Bus 475 guide 1 58) The management cockpit best exemplifies which type of s...
Bus 475 guide 1   58) The management cockpit best exemplifies which type of s...Bus 475 guide 1   58) The management cockpit best exemplifies which type of s...
Bus 475 guide 1 58) The management cockpit best exemplifies which type of s...jackkumaran
 
Bus 475 guide 1 67) At 8% compounded annually, how long will it take $750 t...
Bus 475 guide 1   67) At 8% compounded annually, how long will it take $750 t...Bus 475 guide 1   67) At 8% compounded annually, how long will it take $750 t...
Bus 475 guide 1 67) At 8% compounded annually, how long will it take $750 t...jackkumaran
 
Bus 475 guide 1 56) Which of the following is not a source for external dat...
Bus 475 guide 1   56) Which of the following is not a source for external dat...Bus 475 guide 1   56) Which of the following is not a source for external dat...
Bus 475 guide 1 56) Which of the following is not a source for external dat...jackkumaran
 
Bus 475 guide 1 50) Which one of the following statements concerning producti...
Bus 475 guide 1 50) Which one of the following statements concerning producti...Bus 475 guide 1 50) Which one of the following statements concerning producti...
Bus 475 guide 1 50) Which one of the following statements concerning producti...jackkumaran
 
Bus 475 guide 1 61) Which of the following is not a reason that managers need...
Bus 475 guide 1 61) Which of the following is not a reason that managers need...Bus 475 guide 1 61) Which of the following is not a reason that managers need...
Bus 475 guide 1 61) Which of the following is not a reason that managers need...jackkumaran
 
Bus 475 guide 1 43) Which of the following statements is true? A. If A and B...
Bus 475 guide 1 43) Which of the following statements is true?  A. If A and B...Bus 475 guide 1 43) Which of the following statements is true?  A. If A and B...
Bus 475 guide 1 43) Which of the following statements is true? A. If A and B...jackkumaran
 

Similar to 1Acquisition cost of long-lived assets the following items repr.docx (20)

Uop acc 422 final exam guide
Uop acc 422 final exam guideUop acc 422 final exam guide
Uop acc 422 final exam guide
 
Number of Pages 2 (Double Spaced)Language Style English (U.S.).docx
Number of Pages 2 (Double Spaced)Language Style English (U.S.).docxNumber of Pages 2 (Double Spaced)Language Style English (U.S.).docx
Number of Pages 2 (Double Spaced)Language Style English (U.S.).docx
 
Acc 561 final exam b. done
Acc 561 final exam b. doneAcc 561 final exam b. done
Acc 561 final exam b. done
 
ACC 422 Final Exam Guide With EXCEL FILE seek Your Dream/uophelpdotcom
ACC 422 Final Exam Guide With EXCEL FILE seek Your Dream/uophelpdotcomACC 422 Final Exam Guide With EXCEL FILE seek Your Dream/uophelpdotcom
ACC 422 Final Exam Guide With EXCEL FILE seek Your Dream/uophelpdotcom
 
University of Maryland University CollegeFinal Examination.docx
University of Maryland University CollegeFinal Examination.docxUniversity of Maryland University CollegeFinal Examination.docx
University of Maryland University CollegeFinal Examination.docx
 
ACC 422 Final Exam Guide With EXCEL FILE seek Your Dream/acc422martdotcom
ACC 422 Final Exam Guide With EXCEL FILE seek Your Dream/acc422martdotcomACC 422 Final Exam Guide With EXCEL FILE seek Your Dream/acc422martdotcom
ACC 422 Final Exam Guide With EXCEL FILE seek Your Dream/acc422martdotcom
 
ACC 422 Final Exam Guide With EXCEL FILE seek Your Dream/snaptutorialdotcom
ACC 422 Final Exam Guide With EXCEL FILE seek Your Dream/snaptutorialdotcomACC 422 Final Exam Guide With EXCEL FILE seek Your Dream/snaptutorialdotcom
ACC 422 Final Exam Guide With EXCEL FILE seek Your Dream/snaptutorialdotcom
 
Instructions1. For the questions requiring a written explanatio.docx
Instructions1. For the questions requiring a written explanatio.docxInstructions1. For the questions requiring a written explanatio.docx
Instructions1. For the questions requiring a written explanatio.docx
 
1. (TCO 4) Which of the following is true regarding the eval.docx
1. (TCO 4) Which of the following is true regarding the eval.docx1. (TCO 4) Which of the following is true regarding the eval.docx
1. (TCO 4) Which of the following is true regarding the eval.docx
 
ACC 251 Intro to Managerial AccountingChapters 9 through 12 .docx
ACC 251 Intro to Managerial AccountingChapters 9 through 12 .docxACC 251 Intro to Managerial AccountingChapters 9 through 12 .docx
ACC 251 Intro to Managerial AccountingChapters 9 through 12 .docx
 
Fin 571 final exam
Fin 571 final examFin 571 final exam
Fin 571 final exam
 
Fin 571 final exam
Fin 571 final examFin 571 final exam
Fin 571 final exam
 
Fin 571 final exam
Fin 571 final examFin 571 final exam
Fin 571 final exam
 
Bus 475 guide 1 54) When customers access a Web site and make purchases, t...
Bus 475 guide 1    54) When customers access a Web site and make purchases, t...Bus 475 guide 1    54) When customers access a Web site and make purchases, t...
Bus 475 guide 1 54) When customers access a Web site and make purchases, t...
 
Bus 475 guide 1 58) The management cockpit best exemplifies which type of s...
Bus 475 guide 1   58) The management cockpit best exemplifies which type of s...Bus 475 guide 1   58) The management cockpit best exemplifies which type of s...
Bus 475 guide 1 58) The management cockpit best exemplifies which type of s...
 
Bus 475 guide 1 67) At 8% compounded annually, how long will it take $750 t...
Bus 475 guide 1   67) At 8% compounded annually, how long will it take $750 t...Bus 475 guide 1   67) At 8% compounded annually, how long will it take $750 t...
Bus 475 guide 1 67) At 8% compounded annually, how long will it take $750 t...
 
Bus 475 guide 1 56) Which of the following is not a source for external dat...
Bus 475 guide 1   56) Which of the following is not a source for external dat...Bus 475 guide 1   56) Which of the following is not a source for external dat...
Bus 475 guide 1 56) Which of the following is not a source for external dat...
 
Bus 475 guide 1 50) Which one of the following statements concerning producti...
Bus 475 guide 1 50) Which one of the following statements concerning producti...Bus 475 guide 1 50) Which one of the following statements concerning producti...
Bus 475 guide 1 50) Which one of the following statements concerning producti...
 
Bus 475 guide 1 61) Which of the following is not a reason that managers need...
Bus 475 guide 1 61) Which of the following is not a reason that managers need...Bus 475 guide 1 61) Which of the following is not a reason that managers need...
Bus 475 guide 1 61) Which of the following is not a reason that managers need...
 
Bus 475 guide 1 43) Which of the following statements is true? A. If A and B...
Bus 475 guide 1 43) Which of the following statements is true?  A. If A and B...Bus 475 guide 1 43) Which of the following statements is true?  A. If A and B...
Bus 475 guide 1 43) Which of the following statements is true? A. If A and B...
 

More from felicidaddinwoodie

Business UseWeek 1 Assignment #1Instructions1. Plea.docx
Business UseWeek 1 Assignment #1Instructions1. Plea.docxBusiness UseWeek 1 Assignment #1Instructions1. Plea.docx
Business UseWeek 1 Assignment #1Instructions1. Plea.docxfelicidaddinwoodie
 
Business UsePALADIN ASSIGNMENT ScenarioYou are give.docx
Business UsePALADIN ASSIGNMENT ScenarioYou are give.docxBusiness UsePALADIN ASSIGNMENT ScenarioYou are give.docx
Business UsePALADIN ASSIGNMENT ScenarioYou are give.docxfelicidaddinwoodie
 
Business UsePractical Connection WorkThis work is a writte.docx
Business UsePractical Connection WorkThis work is a writte.docxBusiness UsePractical Connection WorkThis work is a writte.docx
Business UsePractical Connection WorkThis work is a writte.docxfelicidaddinwoodie
 
Business System AnalystSUMMARY· Cognos Business.docx
Business System AnalystSUMMARY· Cognos Business.docxBusiness System AnalystSUMMARY· Cognos Business.docx
Business System AnalystSUMMARY· Cognos Business.docxfelicidaddinwoodie
 
Business StrategyOrganizations have to develop an international .docx
Business StrategyOrganizations have to develop an international .docxBusiness StrategyOrganizations have to develop an international .docx
Business StrategyOrganizations have to develop an international .docxfelicidaddinwoodie
 
Business StrategyGroup BCase Study- KFC Business Analysis.docx
Business StrategyGroup BCase Study- KFC Business Analysis.docxBusiness StrategyGroup BCase Study- KFC Business Analysis.docx
Business StrategyGroup BCase Study- KFC Business Analysis.docxfelicidaddinwoodie
 
Business Strategy Differentiation, Cost Leadership, a.docx
Business Strategy Differentiation, Cost Leadership, a.docxBusiness Strategy Differentiation, Cost Leadership, a.docx
Business Strategy Differentiation, Cost Leadership, a.docxfelicidaddinwoodie
 
Business Research Methods, 11e, CooperSchindler1case.docx
Business Research Methods, 11e, CooperSchindler1case.docxBusiness Research Methods, 11e, CooperSchindler1case.docx
Business Research Methods, 11e, CooperSchindler1case.docxfelicidaddinwoodie
 
Business RequirementsReference number Document Control.docx
Business RequirementsReference number Document Control.docxBusiness RequirementsReference number Document Control.docx
Business RequirementsReference number Document Control.docxfelicidaddinwoodie
 
Business ProposalThe Business Proposal is the major writing .docx
Business ProposalThe Business Proposal is the major writing .docxBusiness ProposalThe Business Proposal is the major writing .docx
Business ProposalThe Business Proposal is the major writing .docxfelicidaddinwoodie
 
Business ProjectProject Progress Evaluation Feedback Form .docx
Business ProjectProject Progress Evaluation Feedback Form .docxBusiness ProjectProject Progress Evaluation Feedback Form .docx
Business ProjectProject Progress Evaluation Feedback Form .docxfelicidaddinwoodie
 
BUSINESS PROCESSES IN THE FUNCTION OF COST MANAGEMENT IN H.docx
BUSINESS PROCESSES IN THE FUNCTION OF COST MANAGEMENT IN H.docxBUSINESS PROCESSES IN THE FUNCTION OF COST MANAGEMENT IN H.docx
BUSINESS PROCESSES IN THE FUNCTION OF COST MANAGEMENT IN H.docxfelicidaddinwoodie
 
Business Process Management JournalBusiness process manageme.docx
Business Process Management JournalBusiness process manageme.docxBusiness Process Management JournalBusiness process manageme.docx
Business Process Management JournalBusiness process manageme.docxfelicidaddinwoodie
 
Business Process DiagramACCESS for ELL.docx
Business Process DiagramACCESS for ELL.docxBusiness Process DiagramACCESS for ELL.docx
Business Process DiagramACCESS for ELL.docxfelicidaddinwoodie
 
Business Plan[Your Name], OwnerPurdue GlobalBUSINESS PLANDate.docx
Business Plan[Your Name], OwnerPurdue GlobalBUSINESS PLANDate.docxBusiness Plan[Your Name], OwnerPurdue GlobalBUSINESS PLANDate.docx
Business Plan[Your Name], OwnerPurdue GlobalBUSINESS PLANDate.docxfelicidaddinwoodie
 
Business PlanCover Page  Name of Project, Contact Info, Da.docx
Business PlanCover Page  Name of Project, Contact Info, Da.docxBusiness PlanCover Page  Name of Project, Contact Info, Da.docx
Business PlanCover Page  Name of Project, Contact Info, Da.docxfelicidaddinwoodie
 
Business Planning and Program Planning A strategic plan.docx
Business Planning and Program Planning          A strategic plan.docxBusiness Planning and Program Planning          A strategic plan.docx
Business Planning and Program Planning A strategic plan.docxfelicidaddinwoodie
 
Business Plan In your assigned journal, describe the entity you wil.docx
Business Plan In your assigned journal, describe the entity you wil.docxBusiness Plan In your assigned journal, describe the entity you wil.docx
Business Plan In your assigned journal, describe the entity you wil.docxfelicidaddinwoodie
 
Business Plan Part IVPart IV of the Business PlanPart IV of .docx
Business Plan Part IVPart IV of the Business PlanPart IV of .docxBusiness Plan Part IVPart IV of the Business PlanPart IV of .docx
Business Plan Part IVPart IV of the Business PlanPart IV of .docxfelicidaddinwoodie
 
BUSINESS PLAN FORMAT          Whether you plan to apply for a bu.docx
BUSINESS PLAN FORMAT          Whether you plan to apply for a bu.docxBUSINESS PLAN FORMAT          Whether you plan to apply for a bu.docx
BUSINESS PLAN FORMAT          Whether you plan to apply for a bu.docxfelicidaddinwoodie
 

More from felicidaddinwoodie (20)

Business UseWeek 1 Assignment #1Instructions1. Plea.docx
Business UseWeek 1 Assignment #1Instructions1. Plea.docxBusiness UseWeek 1 Assignment #1Instructions1. Plea.docx
Business UseWeek 1 Assignment #1Instructions1. Plea.docx
 
Business UsePALADIN ASSIGNMENT ScenarioYou are give.docx
Business UsePALADIN ASSIGNMENT ScenarioYou are give.docxBusiness UsePALADIN ASSIGNMENT ScenarioYou are give.docx
Business UsePALADIN ASSIGNMENT ScenarioYou are give.docx
 
Business UsePractical Connection WorkThis work is a writte.docx
Business UsePractical Connection WorkThis work is a writte.docxBusiness UsePractical Connection WorkThis work is a writte.docx
Business UsePractical Connection WorkThis work is a writte.docx
 
Business System AnalystSUMMARY· Cognos Business.docx
Business System AnalystSUMMARY· Cognos Business.docxBusiness System AnalystSUMMARY· Cognos Business.docx
Business System AnalystSUMMARY· Cognos Business.docx
 
Business StrategyOrganizations have to develop an international .docx
Business StrategyOrganizations have to develop an international .docxBusiness StrategyOrganizations have to develop an international .docx
Business StrategyOrganizations have to develop an international .docx
 
Business StrategyGroup BCase Study- KFC Business Analysis.docx
Business StrategyGroup BCase Study- KFC Business Analysis.docxBusiness StrategyGroup BCase Study- KFC Business Analysis.docx
Business StrategyGroup BCase Study- KFC Business Analysis.docx
 
Business Strategy Differentiation, Cost Leadership, a.docx
Business Strategy Differentiation, Cost Leadership, a.docxBusiness Strategy Differentiation, Cost Leadership, a.docx
Business Strategy Differentiation, Cost Leadership, a.docx
 
Business Research Methods, 11e, CooperSchindler1case.docx
Business Research Methods, 11e, CooperSchindler1case.docxBusiness Research Methods, 11e, CooperSchindler1case.docx
Business Research Methods, 11e, CooperSchindler1case.docx
 
Business RequirementsReference number Document Control.docx
Business RequirementsReference number Document Control.docxBusiness RequirementsReference number Document Control.docx
Business RequirementsReference number Document Control.docx
 
Business ProposalThe Business Proposal is the major writing .docx
Business ProposalThe Business Proposal is the major writing .docxBusiness ProposalThe Business Proposal is the major writing .docx
Business ProposalThe Business Proposal is the major writing .docx
 
Business ProjectProject Progress Evaluation Feedback Form .docx
Business ProjectProject Progress Evaluation Feedback Form .docxBusiness ProjectProject Progress Evaluation Feedback Form .docx
Business ProjectProject Progress Evaluation Feedback Form .docx
 
BUSINESS PROCESSES IN THE FUNCTION OF COST MANAGEMENT IN H.docx
BUSINESS PROCESSES IN THE FUNCTION OF COST MANAGEMENT IN H.docxBUSINESS PROCESSES IN THE FUNCTION OF COST MANAGEMENT IN H.docx
BUSINESS PROCESSES IN THE FUNCTION OF COST MANAGEMENT IN H.docx
 
Business Process Management JournalBusiness process manageme.docx
Business Process Management JournalBusiness process manageme.docxBusiness Process Management JournalBusiness process manageme.docx
Business Process Management JournalBusiness process manageme.docx
 
Business Process DiagramACCESS for ELL.docx
Business Process DiagramACCESS for ELL.docxBusiness Process DiagramACCESS for ELL.docx
Business Process DiagramACCESS for ELL.docx
 
Business Plan[Your Name], OwnerPurdue GlobalBUSINESS PLANDate.docx
Business Plan[Your Name], OwnerPurdue GlobalBUSINESS PLANDate.docxBusiness Plan[Your Name], OwnerPurdue GlobalBUSINESS PLANDate.docx
Business Plan[Your Name], OwnerPurdue GlobalBUSINESS PLANDate.docx
 
Business PlanCover Page  Name of Project, Contact Info, Da.docx
Business PlanCover Page  Name of Project, Contact Info, Da.docxBusiness PlanCover Page  Name of Project, Contact Info, Da.docx
Business PlanCover Page  Name of Project, Contact Info, Da.docx
 
Business Planning and Program Planning A strategic plan.docx
Business Planning and Program Planning          A strategic plan.docxBusiness Planning and Program Planning          A strategic plan.docx
Business Planning and Program Planning A strategic plan.docx
 
Business Plan In your assigned journal, describe the entity you wil.docx
Business Plan In your assigned journal, describe the entity you wil.docxBusiness Plan In your assigned journal, describe the entity you wil.docx
Business Plan In your assigned journal, describe the entity you wil.docx
 
Business Plan Part IVPart IV of the Business PlanPart IV of .docx
Business Plan Part IVPart IV of the Business PlanPart IV of .docxBusiness Plan Part IVPart IV of the Business PlanPart IV of .docx
Business Plan Part IVPart IV of the Business PlanPart IV of .docx
 
BUSINESS PLAN FORMAT          Whether you plan to apply for a bu.docx
BUSINESS PLAN FORMAT          Whether you plan to apply for a bu.docxBUSINESS PLAN FORMAT          Whether you plan to apply for a bu.docx
BUSINESS PLAN FORMAT          Whether you plan to apply for a bu.docx
 

Recently uploaded

ECONOMIC CONTEXT - LONG FORM TV DRAMA - PPT
ECONOMIC CONTEXT - LONG FORM TV DRAMA - PPTECONOMIC CONTEXT - LONG FORM TV DRAMA - PPT
ECONOMIC CONTEXT - LONG FORM TV DRAMA - PPTiammrhaywood
 
BASLIQ CURRENT LOOKBOOK LOOKBOOK(1) (1).pdf
BASLIQ CURRENT LOOKBOOK  LOOKBOOK(1) (1).pdfBASLIQ CURRENT LOOKBOOK  LOOKBOOK(1) (1).pdf
BASLIQ CURRENT LOOKBOOK LOOKBOOK(1) (1).pdfSoniaTolstoy
 
Paris 2024 Olympic Geographies - an activity
Paris 2024 Olympic Geographies - an activityParis 2024 Olympic Geographies - an activity
Paris 2024 Olympic Geographies - an activityGeoBlogs
 
Introduction to ArtificiaI Intelligence in Higher Education
Introduction to ArtificiaI Intelligence in Higher EducationIntroduction to ArtificiaI Intelligence in Higher Education
Introduction to ArtificiaI Intelligence in Higher Educationpboyjonauth
 
SOCIAL AND HISTORICAL CONTEXT - LFTVD.pptx
SOCIAL AND HISTORICAL CONTEXT - LFTVD.pptxSOCIAL AND HISTORICAL CONTEXT - LFTVD.pptx
SOCIAL AND HISTORICAL CONTEXT - LFTVD.pptxiammrhaywood
 
Employee wellbeing at the workplace.pptx
Employee wellbeing at the workplace.pptxEmployee wellbeing at the workplace.pptx
Employee wellbeing at the workplace.pptxNirmalaLoungPoorunde1
 
POINT- BIOCHEMISTRY SEM 2 ENZYMES UNIT 5.pptx
POINT- BIOCHEMISTRY SEM 2 ENZYMES UNIT 5.pptxPOINT- BIOCHEMISTRY SEM 2 ENZYMES UNIT 5.pptx
POINT- BIOCHEMISTRY SEM 2 ENZYMES UNIT 5.pptxSayali Powar
 
Class 11 Legal Studies Ch-1 Concept of State .pdf
Class 11 Legal Studies Ch-1 Concept of State .pdfClass 11 Legal Studies Ch-1 Concept of State .pdf
Class 11 Legal Studies Ch-1 Concept of State .pdfakmcokerachita
 
A Critique of the Proposed National Education Policy Reform
A Critique of the Proposed National Education Policy ReformA Critique of the Proposed National Education Policy Reform
A Critique of the Proposed National Education Policy ReformChameera Dedduwage
 
Software Engineering Methodologies (overview)
Software Engineering Methodologies (overview)Software Engineering Methodologies (overview)
Software Engineering Methodologies (overview)eniolaolutunde
 
Organic Name Reactions for the students and aspirants of Chemistry12th.pptx
Organic Name Reactions  for the students and aspirants of Chemistry12th.pptxOrganic Name Reactions  for the students and aspirants of Chemistry12th.pptx
Organic Name Reactions for the students and aspirants of Chemistry12th.pptxVS Mahajan Coaching Centre
 
_Math 4-Q4 Week 5.pptx Steps in Collecting Data
_Math 4-Q4 Week 5.pptx Steps in Collecting Data_Math 4-Q4 Week 5.pptx Steps in Collecting Data
_Math 4-Q4 Week 5.pptx Steps in Collecting DataJhengPantaleon
 
Final demo Grade 9 for demo Plan dessert.pptx
Final demo Grade 9 for demo Plan dessert.pptxFinal demo Grade 9 for demo Plan dessert.pptx
Final demo Grade 9 for demo Plan dessert.pptxAvyJaneVismanos
 
Painted Grey Ware.pptx, PGW Culture of India
Painted Grey Ware.pptx, PGW Culture of IndiaPainted Grey Ware.pptx, PGW Culture of India
Painted Grey Ware.pptx, PGW Culture of IndiaVirag Sontakke
 
EPANDING THE CONTENT OF AN OUTLINE using notes.pptx
EPANDING THE CONTENT OF AN OUTLINE using notes.pptxEPANDING THE CONTENT OF AN OUTLINE using notes.pptx
EPANDING THE CONTENT OF AN OUTLINE using notes.pptxRaymartEstabillo3
 
Science lesson Moon for 4th quarter lesson
Science lesson Moon for 4th quarter lessonScience lesson Moon for 4th quarter lesson
Science lesson Moon for 4th quarter lessonJericReyAuditor
 
Call Girls in Dwarka Mor Delhi Contact Us 9654467111
Call Girls in Dwarka Mor Delhi Contact Us 9654467111Call Girls in Dwarka Mor Delhi Contact Us 9654467111
Call Girls in Dwarka Mor Delhi Contact Us 9654467111Sapana Sha
 
Blooming Together_ Growing a Community Garden Worksheet.docx
Blooming Together_ Growing a Community Garden Worksheet.docxBlooming Together_ Growing a Community Garden Worksheet.docx
Blooming Together_ Growing a Community Garden Worksheet.docxUnboundStockton
 

Recently uploaded (20)

ECONOMIC CONTEXT - LONG FORM TV DRAMA - PPT
ECONOMIC CONTEXT - LONG FORM TV DRAMA - PPTECONOMIC CONTEXT - LONG FORM TV DRAMA - PPT
ECONOMIC CONTEXT - LONG FORM TV DRAMA - PPT
 
BASLIQ CURRENT LOOKBOOK LOOKBOOK(1) (1).pdf
BASLIQ CURRENT LOOKBOOK  LOOKBOOK(1) (1).pdfBASLIQ CURRENT LOOKBOOK  LOOKBOOK(1) (1).pdf
BASLIQ CURRENT LOOKBOOK LOOKBOOK(1) (1).pdf
 
Paris 2024 Olympic Geographies - an activity
Paris 2024 Olympic Geographies - an activityParis 2024 Olympic Geographies - an activity
Paris 2024 Olympic Geographies - an activity
 
Introduction to ArtificiaI Intelligence in Higher Education
Introduction to ArtificiaI Intelligence in Higher EducationIntroduction to ArtificiaI Intelligence in Higher Education
Introduction to ArtificiaI Intelligence in Higher Education
 
SOCIAL AND HISTORICAL CONTEXT - LFTVD.pptx
SOCIAL AND HISTORICAL CONTEXT - LFTVD.pptxSOCIAL AND HISTORICAL CONTEXT - LFTVD.pptx
SOCIAL AND HISTORICAL CONTEXT - LFTVD.pptx
 
Employee wellbeing at the workplace.pptx
Employee wellbeing at the workplace.pptxEmployee wellbeing at the workplace.pptx
Employee wellbeing at the workplace.pptx
 
POINT- BIOCHEMISTRY SEM 2 ENZYMES UNIT 5.pptx
POINT- BIOCHEMISTRY SEM 2 ENZYMES UNIT 5.pptxPOINT- BIOCHEMISTRY SEM 2 ENZYMES UNIT 5.pptx
POINT- BIOCHEMISTRY SEM 2 ENZYMES UNIT 5.pptx
 
Class 11 Legal Studies Ch-1 Concept of State .pdf
Class 11 Legal Studies Ch-1 Concept of State .pdfClass 11 Legal Studies Ch-1 Concept of State .pdf
Class 11 Legal Studies Ch-1 Concept of State .pdf
 
A Critique of the Proposed National Education Policy Reform
A Critique of the Proposed National Education Policy ReformA Critique of the Proposed National Education Policy Reform
A Critique of the Proposed National Education Policy Reform
 
Software Engineering Methodologies (overview)
Software Engineering Methodologies (overview)Software Engineering Methodologies (overview)
Software Engineering Methodologies (overview)
 
Organic Name Reactions for the students and aspirants of Chemistry12th.pptx
Organic Name Reactions  for the students and aspirants of Chemistry12th.pptxOrganic Name Reactions  for the students and aspirants of Chemistry12th.pptx
Organic Name Reactions for the students and aspirants of Chemistry12th.pptx
 
Model Call Girl in Tilak Nagar Delhi reach out to us at 🔝9953056974🔝
Model Call Girl in Tilak Nagar Delhi reach out to us at 🔝9953056974🔝Model Call Girl in Tilak Nagar Delhi reach out to us at 🔝9953056974🔝
Model Call Girl in Tilak Nagar Delhi reach out to us at 🔝9953056974🔝
 
_Math 4-Q4 Week 5.pptx Steps in Collecting Data
_Math 4-Q4 Week 5.pptx Steps in Collecting Data_Math 4-Q4 Week 5.pptx Steps in Collecting Data
_Math 4-Q4 Week 5.pptx Steps in Collecting Data
 
Final demo Grade 9 for demo Plan dessert.pptx
Final demo Grade 9 for demo Plan dessert.pptxFinal demo Grade 9 for demo Plan dessert.pptx
Final demo Grade 9 for demo Plan dessert.pptx
 
Painted Grey Ware.pptx, PGW Culture of India
Painted Grey Ware.pptx, PGW Culture of IndiaPainted Grey Ware.pptx, PGW Culture of India
Painted Grey Ware.pptx, PGW Culture of India
 
EPANDING THE CONTENT OF AN OUTLINE using notes.pptx
EPANDING THE CONTENT OF AN OUTLINE using notes.pptxEPANDING THE CONTENT OF AN OUTLINE using notes.pptx
EPANDING THE CONTENT OF AN OUTLINE using notes.pptx
 
TataKelola dan KamSiber Kecerdasan Buatan v022.pdf
TataKelola dan KamSiber Kecerdasan Buatan v022.pdfTataKelola dan KamSiber Kecerdasan Buatan v022.pdf
TataKelola dan KamSiber Kecerdasan Buatan v022.pdf
 
Science lesson Moon for 4th quarter lesson
Science lesson Moon for 4th quarter lessonScience lesson Moon for 4th quarter lesson
Science lesson Moon for 4th quarter lesson
 
Call Girls in Dwarka Mor Delhi Contact Us 9654467111
Call Girls in Dwarka Mor Delhi Contact Us 9654467111Call Girls in Dwarka Mor Delhi Contact Us 9654467111
Call Girls in Dwarka Mor Delhi Contact Us 9654467111
 
Blooming Together_ Growing a Community Garden Worksheet.docx
Blooming Together_ Growing a Community Garden Worksheet.docxBlooming Together_ Growing a Community Garden Worksheet.docx
Blooming Together_ Growing a Community Garden Worksheet.docx
 

1Acquisition cost of long-lived assets the following items repr.docx

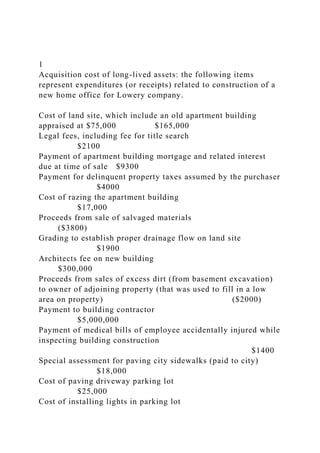
  • 1. 1 Acquisition cost of long-lived assets: the following items represent expenditures (or receipts) related to construction of a new home office for Lowery company. Cost of land site, which include an old apartment building appraised at $75,000 $165,000 Legal fees, including fee for title search $2100 Payment of apartment building mortgage and related interest due at time of sale $9300 Payment for delinquent property taxes assumed by the purchaser $4000 Cost of razing the apartment building $17,000 Proceeds from sale of salvaged materials ($3800) Grading to establish proper drainage flow on land site $1900 Architects fee on new building $300,000 Proceeds from sales of excess dirt (from basement excavation) to owner of adjoining property (that was used to fill in a low area on property) ($2000) Payment to building contractor $5,000,000 Payment of medical bills of employee accidentally injured while inspecting building construction $1400 Special assessment for paving city sidewalks (paid to city) $18,000 Cost of paving driveway parking lot $25,000 Cost of installing lights in parking lot
  • 2. $9200 Premium for insurance on building during construction $7500 Cost of open house party to celebrate the opening of new building $8000 Required From the given data, calculate the proper balances for land, building, and land improvements accounts of Lowery Company. 2 Depreciation method: on January 2, Roth Inc. purchased a laser cutting machine to be used in the fabrication of a part for one of its key products. The machine cost $80,000, and its estimated useful life was four years or 1 million cuttings, after which it could be sold for $5000. Required Calculate the depreciation expense for each year of the machines useful life under each of the following depreciation methods: a. straight-line b. double declining balance c. Units of production. Assume annual production and cuttings of: a. 200,000 b. 350,000 c. 260,000 d. 190,000 3 Depreciation method: on January 2, 2012, Alvarez Company
  • 3. purchased an electroplating machine to help manufacture a part for one of its key products. The machine cost $218,700 and was estimated to have a useful life of six years or 700,000 pleadings, after which it could be sold for $23,400. Required a. calculate each year’s depreciation expense for the period 2012-2017 under each of the following depreciation methods: 1. straight-line 2. double declining balance 3. Units of production. (Assume annual production in pleadings of: i. 140,000 ii. 180,000 iii. 100,000 iv. 110,000 v. 80,000 vi. 90,000 b. Assume that the machine was purchased on September 1, 2012. Calculate each year’s depreciation expense for the period 2012 through 2018 under each of the following depreciation methods: 1. straight-line 2. double declining balance
  • 4. 4 Accounting for planting and intangible assets: selected transactions of Continental publishers Inc., for 2013 are given below: Jan 2: paid $90,000 to purchase copyrights to a series of romantic novels. The copyrights expire in 40 years, although sales of the novels are expected to stop after 10 years. Mar 1: discovered a satellite dish antenna has been destroyed by lightning. The losses covered by insurance and a claim is found today. The antenna cost $9180 when installed on July 1, 2012. And was being depreciated for over 12 years with the $900 salvage value. Straight-line depreciation was last recorded on December 31, 2012. Continental expects to receive an insurance settlement of $8100 Apr 1: paid $120,000 to remodel space to create an employee exercise area on the lower level in a least building. The buildings remaining useful life is 40 years; the lease on the building expires in 12 years. Jul 1: paid $270,000 to acquire a patent on a new publishing
  • 5. process. The patent has a remaining legal life of 15 years. Continental estimates to new process will be utilized for six years before it becomes obsolete. Nov 1: paid $63,000 to obtain a four-year franchise to sell a new series of computerized do-it-yourself manuals. Required: a. Prepare journal entries to record these transactions. b. Prepare the December 31 journal entries to record depreciation and amortization expense for assets acquired during the year. Continental uses straight-line depreciation and amortization. 5 Contingent liabilities: determine which of the following transactions represent contingent liabilities for Kelly leasing and indicate the proper accounting treatment for the company’s fiscal year-end, by placing the letter of the correct accounting treatment in the space provided A. accrue liability and disclose in the financial statement notes B. disclose the financial statement footnotes only C. no disclosure 1. Kelly leasing was sued by a customer who claimed the equipment they least was not up to standards described by Koby. Kobe stands by its claims and can support all the item specifications. Koby plans to vigorously defend itself and believes the chances of losing the lawsuit a remote. 2. A government audit of Koby found that the company is in violation of several work safety regulations. Koby has been notified that it will be assessed a fine of $25,000. Koby has agreed to make the safety changes so that it will be in compliance with the regulations.
  • 6. 3. Koby leasing has been served a lawsuit by a customer that claims he was injured from one of the products leased from Koby. Koby plans to defend itself in court, but his lawyers believe there is a 50-50 chance that they will lose and be forced to pay $50,000. 6 Recording payroll and payroll taxes: Beamon Corporation had the following payroll for April: Officer salaries $32,000 Sales salaries $67,000 Federal income taxes withheld $19,000 FICA taxes withheld $7500 Health insurance premiums withheld $1600 Union dues withheld $1200 Salaries (including above) subject to federal unemployment taxes$55,000 Salaries (including above) subject to state unemployment taxes $60,000 Required prepare journal entries on April 30 to record: a. Accrual of the monthly payroll. b. Payment of the net payroll. c. Accrual of employer’s payroll taxes. (Assume that FICA tax matches the amount withheld, if the federal unemployment tax is 0.6%, and the state unemployment tax is 5.4%.) d. Payment of all liabilities related to this payroll. (Assume that all are settled at the same time)
  • 7. -538- Inzinerine Ekonomika-Engineering Economics, 2014, 25(5), 538–548 Finding a New Way to Increase Project Management Efficiency in Terms of Time Reduction Seweryn Spalek Silesian University of Technology Gliwice, Poland E-mail. [email protected] http://dx.doi.org/10.5755/j01.ee.25.5.8419 There are three basic constraints called ‘the golden triangle’ in each project: time, budget and scope. Researchers and practitioners are trying to find a way to increase the efficacy of the project’s outcomes in terms of shortening the project’s duration, lowering budgetary costs and meeting the scope. Although several publications have been written on that topic, there is still no common solution in place. However, more in- depth research related to the specific type of projects or industries is being conducted and this paper seeks to incorporate additional knowledge into that contemporary field.
  • 8. Furthermore, this is of growing importance in modern, turbulent times, where the expectations of profiting from lessons learned are ever increasing. Following the current market demands, in the article a new, innovative approach is proposed to manage the expectation that future projects will have a shorter duration. Therefore, the idea of creating specific roadmaps is proposed, which should help the decision makers improve the efficacy of project management in the company, where the process of such improvement is measured using the maturity levels assessment concept. Based on the world-wide quantitative studies in the construction, information technology and machinery industries, specific roadmaps for each industry were determined. The purpose of these roadmaps is to indicate the most effective investment sequence in the increase of project management maturity, which should result in a decrease of future projects’ duration. Moreover, discussions on the limitations of such investments are examined. Keywords: Investment, Time pressure, Company, Projects, Improvement, PM, Implementation of Strategies, Knowledge, Innovation. Introduction Three of the world’s most recognized Latin words,
  • 9. “Citius, Altius, Fortius,” meaning “Faster, Higher, Stronger”, have been the Olympic motto since 1894. At the time: Pierre de Coubertin proposed the motto, having borrowed it from his friend Henri Didon, a Dominican priest who taught sport close to Paris (IOC, 2007, p. 5). These three words encourage the athlete to give his or her best during competition. To better understand the motto, we can compare it with the Olympic creed: “The most important thing in life is not the triumph, but the fight; the essential thing is not to have won, but to have fought well.” Together, the Olympic motto and the creed represent an ideal that Coubertin believed in and promoted as an important life lesson that could be gained from participation in sport and the Olympic Games: that giving one’s best and striving for personal excellence was a worthwhile goal. It is a lesson that can still be applied equally today, not just to athletes but to each one of us (IOC, 2007, p. 5). Modern project management has its roots (Lenfle and
  • 10. Loch, 2010, p. 33) in the atomic bomb Manhattan project (Morris, 1994, p. 18) and the ballistic missile projects, Atlas and Polaris (Kerzner, 2013). The term “modern project management” is used by some authors and relates mostly to the project management approach started in the 1950s and continuing through today (Chen et al., 2011; Hill, 2004; Lenfle & Loch, 2010; Shenhar, 2001). Remarkably, from the very beginning of contemporary project management, projects were, and continue to be, under similar time pressure (Campos Silva et al., 2012; Chen et al., 2012; Griffin, 1993, 1997; Herroelen & Leus, 2005; Omorede et al., 2013; Radziszewska-Zielina, 2010; Zavadskas et al., 2010). Kach and colleagues (2012, p. 377) state: The speed of technological change and shortened product life cycles have made the time-to-market requirements for developing new products increasingly stringent (Kessler and Chakrabarti, Langerak et al., 2010; Heightened competitive forces have motivated many firms
  • 11. to move their new products through the design and manufacturing pipeline at a faster rate, encouraging greater focus on accelerated development and compressed time lines (Prasnikar & Skerlj, 2006; Wright et al., 1995). The above statement for NPD (new product development) projects can be applied to most projects, whatever their nature. In our current, turbulent times, the pressure of time seems to increase to an ever greater extent. Project managers and their teams experience similar pressure to athletes: to beat the record and to go faster and faster. The first word, “Citius”, of the Olympic hendiatris1 seems to dominate projects managed by 1 Hendiatris is a figure of speech in which three words are used to emphasize one idea, for example, Wine, women, and song. Hendiatris is often used to create mottos for organizations; for example, The motto at West Point is “Duty, Honor, Country.” see K. Wilson and J. Wauson, the
  • 12. AMA handbook of business writing: the ultimate guide to style, grammar, Inzinerine Ekonomika-Engineering Economics, 2014, 25(5), 538–548 - 539 - companies today. The majority of project stakeholders (executives, sponsors, clients, managers) expect new projects to be completed faster than ever. Moreover, companies are always careful about spending money. Therefore, they also want to know where to invest their typically limited funds. This issue also arises when deciding where to invest to shorten the time of future projects. This paper gives new insight into the dilemma of where and when to invest limited company funds to achieve the best approach to time reduction of future projects. (R)evolution in Managing Projects Project management has evolved throughout history.
  • 13. This evolution has occurred mostly due to the tools and techniques applied to single projects and the gradual improvement of human resource management (Avots, 1969). This situation lasted until the 1990s, when the number of projects executed by companies increased. Moreover, companies’ operating environments became turbulent (Keil & Mahring, 2010). Furthermore, the influence of project outcomes on the success of an entire company increased (Baron & Hannan, 2002). As a result, companies placed a greater emphasis on project management. To speed up time-to-market, companies experienced increased pressure to reduce the duration of projects. The existing methods for reducing the time of ongoing single projects (e.g., application of modern scheduling techniques supported by computer technology) (Brucker et al., 1999; Iacovou & Dexter, 2004) are significant; however, they are no longer sufficient. A new, more efficient and revolutionary approach to managing companies’ portfolios of projects was needed (Cooper et
  • 14. al., 1999). This need generated new approaches for how to better manage projects to face the new challenges appearing in multi-project (Hofman, 2014), dynamic environments (Spalek, 2013). Accordingly, new concepts in project management were introduced, focusing on project environment and knowledge management (del Cano and de la Cruz, 2002; Ethiraj et al., 2005; Neverauskas and Stankevicius, 2008; Pemsel & Wiewiora, 2013). Among these concepts is the idea of assessing the maturity level of project management in the company (Cooke-Davies, 2007; Fraser et al., 2003; Spalek, 2014; Tan et al., 2011). Assessing Maturity: the Purpose To gain competitive advantage in executing projects, companies wanted to know how well they manage projects while taking into consideration different aspects influencing the effective execution of projects (Kerzner, 2013; Rudzianskaite-Kvaraciejiene et al., 2010). The
  • 15. assessment outcomes should note the areas for potential improvement (Ahmad et al., 2013). This expectation can be fulfilled by project management maturity assessment. There are several existing models of maturity assessment; however, their main purpose remains the same: to identify weak and usage, punctuation, construction, and formatting (New York: American Management Association, 2010, p. 216). strong areas in an organization (Belt et al., 2009). By knowing its strengths and weaknesses, a company can undertake actions to improve activities related to the management of projects, resulting in an increased maturity level and improved project outcomes. The majority of existing models assess project management maturity level on a scale from 1 to 5, where 1 represents the lowest and 5 the highest level (Khoshgoftar & Osman, 2009). The assessment is performed in different areas related to project management. Therefore, the
  • 16. assessment results in a matrix with maturity scores and testing areas (Spalek, 2011). Increasing Maturity: the Investment in the Future It is critical to understand that an increase of maturity level will mostly benefit future projects. Increasing by one maturity level up also has some impact, however limited, on existing projects. Because the planning phase in each project is crucial (Wyrozebski & Spalek, 2014), the biggest possible improvements are associated with future projects. There is even a well–known quotation saying2: “Show me how your project starts and I can tell you how it will end.” If the level of maturity is increased, e.g., from level 1 to 2, the outcomes of that action will be beneficial in new projects. For existing projects, it will usually be too late to have an impact. Therefore, the decision to assess and then increase the project management maturity level in a company is an investment in future projects.
  • 17. Investment “in maturity” is time consuming and money intensive; therefore, to achieve the highest possible time reduction of future projects, it is crucial to decide where and when (in which sequence) a company investment should be placed. Moreover, a company’s investment funds are often very limited, making the issue even more important. Therefore, it is essential for companies today to have a road map guiding decision makers on the following topic: “In which areas and in what sequence should limited funds be most effectively invested in my company?”. The Research Method The prediction of the future is a complex issue (Glenn & Gordon, 2003), often involving various methods and techniques, and thus has a wide record in publications.(Booth, 2006; Galbraith & Merrill, 1996; Lacher et al., 1995; Landeta, 2006; Onkal et al., 2013). To predict reduction of the future time of projects, questionnaire-based cross-impact analysis was used
  • 18. following the ideas presented by Fabiana Scapolo and Ian Miles (2006, p. 680–681). The method included the following steps: data analysis and conclusions. 2 Author unknown, also exists as: “Show me how your project starts and I can tell you how it will finish” or “Show me how your project starts and I show you how it will end”. Seweryn Spalek. Finding a New Way to Increase Project Management Efficiency in Terms of Time Reduction - 540 - Three Industries: Construction, Information Technology and Machinery
  • 19. The research presented in this article was part of a larger effort supported by the National Science Centre, focusing on world-wide studies of maturity in project management in the chosen industries. The overall research was designed in two major steps. The first step was to conduct quantitative empirical studies on project management maturity levels in three types of industries: machinery, construction and information technology. Data from 447 global companies, mostly medium- and large-sized ones, was collected. Ninety-eight per cent of them earned over € 2,000,000 per year, and 99,5 % of them employed over 49 people. The second step, which is discussed in this study, was designed to investigate the relationship between the increase in maturity level in project management and the predicted duration of forthcoming projects. The Assessment For the purpose of this study, a model was used that assesses the company’s project management maturity in
  • 20. four areas (Spalek, 2011): , 2011); 2000); Kjaer, 2012); 2011). The description of the maturity assessment areas is shown in table 1. Table 1 Project Management Maturity Assessment Areas ID Area Description 1. Human Resources staffing, career paths, motivation, training, team work 2. Methods (incl. Tools & Techniques) methods, tools, techniques and means used for project planning and execution; risk, requir ements, scope, costs, time and quality management
  • 21. 3. Environment organizational structures, top management support, stakeholders’ management, company culture 4. Knowledge Management lessons learned approach, gathering data and experience for on-going operations and future references In the applied project management maturity model the results of the assessment are reported from level 1 to 5: 3: Appliance; -improvement. The experts were asked to express their opinion on an increase of maturity level by one increment (from 1 to 2, from 2 to 3, etc.) and how it influences the time reduction of future projects in their companies. The possible impact was measured on a scale from 1 to 5, as shown in table 2. The assessment was made separately in each testing area. Table 2
  • 22. The Impact on Time Reduction on Future Projects Impact Level Description 1 No influence 2 1–10 % 3 11–20 % 4 21–30 % 5 over 30 % In our study, the experts were practitioners from the investigated companies. The invitation to participate in this study was sent to 308 chosen experts as a follow-up to the major global study on project management maturity. The experts were chosen based on the demographic information obtained in the first step of the overall research. They were experienced managers that had at least five years of experience and possessed a deep knowledge of the projects executed in their companies. Moreover, the invitations were sent to experts from companies that reported a maturity level of at least 2 in each of the testing areas. The response rate was 63 %. Such a high rate was obtained as there were individually approached named
  • 23. persons who expressed, in the first step of overall research, their willingness to participate in the second step of the studies. Non-response bias was tested by comparing the demographic data of participating and non-participating experts. No significant difference was found, proving that survey respondents represent the overall sample accurately. Results and Discussion Data from 39 information technology, 48 construction and 107 machinery industry global companies was collected. The reliability of data was checked using Cronbach’s alpha, resulting in a value of over 0,9 in each testing area. Data analysis using mean, median and mode values was performed. The equality of variances was tested using Levene's test and the equality of means using a t-test, and satisfactory results were obtained as the significance for Levene’s test was greater than 0,05. Additionally, Spearman's rho correlation coefficients and factor analysis using rotated component matrix were calculated for further
  • 24. rigid data analyses. The data analysis was performed using Statistical Package for the Social Sciences (IBM SPSS build V21.0.0). The results revealed differences in the predicted impact of change in maturity level on the duration of future projects. This level of impact depended on the specific change in the designated area of assessment (e.g., a change from level 1 to 2 in the knowledge management area) and varied between industries. The Impact on Future Projects: by Maturity Area and Type of Industry The data analysis revealed that the dispersion of the acquired data is low; consequently, the mean value was chosen to explain the results. Using the mean value allows Inzinerine Ekonomika-Engineering Economics, 2014, 25(5), 538–548 - 541 - the results to be presented more clearly, without going into
  • 25. deep statistical details and allows the development of a full, more comprehensive picture. The mean values of impact on the future projects are shown in table 3. The Impact on Future Projects by Industry (CONS, IND, IT) and Change of Maturity Level in the Areas of Methods (M), Human Resources (HR), Project Environment (E) and Knowledge Management (KM). Table 3 Statistics (Mean Value of Impact on Future Projects) M 1–2 M 2–3 M 3–4 M 4–5 HR
  • 27. 2–3 KM 3–4 KM 4–5 CONS 3,96 3,96 3,21 2,46 3,96 3,96 3,21 2,46 3,21 3,21 2,46 1,71 3,21 3,21 2,46 1,71 IND 3,88 3,88 3,16 2,44 3,88 3,88 3,16 2,44 3,16 3,16 2,44 1,72 3,16 3,16 2,44 1,72 IT 3,90 3,90 3,15 2,41 3,90 3,90 3,15 2,41 3,87 3,87 3,13 2,38 3,87 3,87 3,13 2,38 The impact on future projects depends on the type of industry. The highest impact levels (3,96) were observed for the change from level 1 to 2 and from 2 to 3 in the methods (M) and human resources (HR) areas in the construction industry (CONS). The lowest impact (1.71) also appeared in the construction industry; however, it was observed in the areas of environment (E) and knowledge management (KM) for the change of maturity from level 4 to 5. Note, in each type of the studied industries, the
  • 28. potential impact on future projects is the highest if the company is at the initial (1) or standardized (2) level of maturity in project management and wants to increase it by going one level up. This observation is true for each assessment area: methods, human resources, environment and knowledge management. When a company reports already having appliance (3) or system management (4), maturity levels and wants to increase it by one level, the impact on future projects’ duration subsequently decreases. However, this reduction is greater in the construction and machinery industries than in information technology companies. Therefore, which project management maturity area the company should first invest funds in to reduce the future project’s duration depends on the type of industry. Moreover, the investment sequence depends on the current level of maturity in the company in each testing area, meaning that for a chosen industry, one should consider a different roadmap, showing where and in which sequence the investment in project
  • 29. management maturity should be placed. Different Industries, Different Approach? This study on the influence of the increase of project management maturity on future projects’ time reduction was focused on three types of industries: that has projects that are, to some extent, inherited in its long history. The projects associated with these sectors are described and considered by numerous authors (Davies et al., 2009; Dominguez et al., 2009). which are admittedly spread throughout the globe. The IT projects are described and discussed for many different types, such as agile (Thomke and Reinertsen, 1998) or Internet projects (Mahadevan, 2000). background of the above two industries as well as many others, is present in many countries and is a backbone industry for the other sectors. Therefore, its importance for the global economy is very high. However, a limited amount
  • 30. of research in this particular sector can be found in the literature. The examples are mostly qualitative case studies describing new product development (NPD) practices (Ahmad et al., 2013; Huang et al., 2004; Matsui et al., 2008), which are crucial for machinery industry companies. The Investment Road Map: The Idea Based on the factor analysis (as shown in Table 4), a road map is proposed showing the investment path in maturity areas, which should result in the biggest pay-offs in reduction of time in future projects. Analysing the groups of factors in the table, the proposed roadmaps for the companies was built. This road map operates in the areas of methods and techniques (M), human resources (HR), project environment (E) and project knowledge management (KM), as well as the associated change in level of maturity (e.g., from 2 to 3), which is noted, for example, as follows: M 2–3 (the change in maturity from level 2 to 3 in the area of methods and techniques). In general, note that at the beginning of the road map,
  • 31. the investment has the biggest impact on the duration of future projects and subsequently decreases along the way. Table 4 Factor Analysis Rotated Component Matrixa,b Component 1 2 3 M2-3 ,964 ,245 -,088 HR1-2 ,964 ,245 -,088 HR2-3 ,964 ,245 -,088 M1-2 ,964 ,245 -,088 HR3-4 ,953 ,265 ,146 E1-2 ,953 ,265 ,146 KM2-3 ,953 ,265 ,146 KM1-2 ,953 ,265 ,146 E2-3 ,953 ,265 ,146 M3-4 ,953 ,265 ,146
  • 32. M4-5 ,719 ,253 ,648 HR4-5 ,719 ,253 ,648 E3-4 ,719 ,253 ,648 KM3-4 ,719 ,253 ,648 KM4-5 -,019 ,093 ,992 E4-5 -,019 ,093 ,992 Extraction Method: Principal Component Analysis. Rotation Method: Varimax with Kaiser Normalization. a. BRANCH=CONS; b. Rotation converged in 18 iterations Rotated Component Matrixa,b Component 1 2 3 HR1-2 ,964 ,250 -,074 HR2-3 ,964 ,250 -,074 Seweryn Spalek. Finding a New Way to Increase Project Management Efficiency in Terms of Time Reduction - 542 -
  • 33. Rotated Component Matrixa,b Component 1 2 3 M1-2 ,964 ,250 -,074 M2-3 ,964 ,250 -,074 E2-3 ,945 ,265 ,191 KM2-3 ,945 ,265 ,191 E1-2 ,945 ,265 ,191 M3-4 ,945 ,265 ,191 KM1-2 ,945 ,265 ,191 HR3-4 ,945 ,265 ,191 KM4-5 -,102 ,049 ,990 E4-5 -,102 ,049 ,990 KM3-4 ,641 ,226 ,733 HR4-5 ,641 ,226 ,733 M4-5 ,641 ,226 ,733 E3-4 ,641 ,226 ,733 Extraction Method: Principal Component Analysis.
  • 34. Rotation Method: Varimax with Kaiser Normalization. a. BRANCH=IND; b. Rotation converged in 18 iterations. Rotated Component Matrixa,b Component 1 2 3 HR1-2 ,947 ,148 ,272 HR2-3 ,947 ,148 ,272 M1-2 ,947 ,148 ,272 M2-3 ,947 ,148 ,272 KM2-3 ,934 ,190 ,297 E2-3 ,934 ,190 ,297 E1-2 ,934 ,190 ,297 KM1-2 ,934 ,190 ,297 HR3-4 ,817 ,227 ,519 M3-4 ,817 ,227 ,519 E3-4 ,783 ,284 ,543 KM3-4 ,783 ,284 ,543
  • 35. HR4-5 ,288 ,327 ,891 M4-5 ,288 ,327 ,891 E4-5 ,254 ,387 ,872 KM4-5 ,254 ,387 ,872 Extraction Method: Principal Component Analysis. Rotation Method: Varimax with Kaiser Normalization. a. BRANCH=IT; b. Rotation converged in 9 iterations. The Investment Road Map: Construction Industry The construction sector is one of the largest industries traditionally associated with using project management. The proposed road map revealed that the biggest pay-off is associated with an increase of maturity level from 1 to 2 and from 2 to 3 in the methods (M 1–2, M 2–3) and human resources areas (HR 1–2, HR 2–3). The road map can be described in the following four steps: Step One Assuming that the company is at an initial (1) maturity level in all areas, the first step in investment should be an
  • 36. increase of maturity in the methods (M) and human resources areas (HR) until they reach the level 3. Step Two Then, in the second step, the investment should be placed in gradually reaching level 3 in the environment and knowledge management areas (E 1–2, E 2–3, KM 1–2, KM 2–3), and the increase in methods and human resources should continually increase until they reach level 4 (HR 3–4, M 3–4). Step Three The third step should include activities improving the maturity in the environment and knowledge management areas until they report level 4 (E 3–4, KM 3–4) and the methods and human resources areas until level 5 (M 4–5, HR 4–5). Step Four Finally, in the fourth step, the increase should be from level 4 to 5 in the environment and knowledge
  • 37. management areas (E 4–5, KM 4–5). Figure 1 shows the investment road map for the construction industry. Figure 1. Investment road map for the construction industry M 1–2, M 2–3, HR 1–2,
  • 38. HR 2–3 E 1–2, E 2–3, KM 1–2, KM 2–3, HR 3–4, M 3–4 E 3–4, KM 3–4, M 4–5, HR 4–5 E 4–5, KM 4–5 STEP 1 STEP 2 STEP 3 STEP 4 Inzinerine Ekonomika-Engineering Economics, 2014, 25(5), 538–548 - 543 -
  • 39. Comparing Steps in Construction Companies: the Reduction of Impact Remarkably, if assuming that in the first step, the impact on reduction of time of future projects is 100, then in the second step, it equals 81; in the third, 62; and in the fourth, 43. This information is useful for investments in a specific company, as companies in the same industry differ from one another. After performing the first step, the total investment and detailed impact on a project’s duration can be measured. Then, knowing the predicted reduction of impact, one can estimate the possible outcomes in the second step toward the investment effort and decide if it is worth it to proceed. The same approach can be performed before step three and four. Following this advice means, of course, that time gaps are needed between successive steps to reassess the situation. The Investment Road Map: Information Technology After construction, the second industry traditionally associated with the project management sector is
  • 40. information technology (IT). Moreover, both industries report a long project management application history. The investment road map for information technology consists of six steps. Step One In step one, the investment in increasing project management maturity levels should be performed to go from level 1 to 2 and from 2 to 3 in the methods and human resources areas (M 1–2, M 2–3, HR 1–2, HR 2–3). Step Two After the first investments, the company should consider investments to increase the level of maturity from 1 to 2 and then from 2 to 3 in the remaining two areas: environment and knowledge management (E 1–2, E 2–3, KM 1–2, KM 2–3). Step Three In the third step, the project management maturity level should be increased from 3 to 4 in the methods and human
  • 41. resources areas (M 3–4, HR 3–4). Step Four In this step, as in step three, one goes up from level 3 to 4 in the environment and knowledge management areas (E 3–4, KM 3–4). Step Five The fifth step is designated for improvement in the methods and human resources areas from level 4 to 5 (M 4– 5, HR 4–5). Step Six In the last step, the investment should be placed to increase the maturity level from 4 to 5 in the areas of environment and knowledge management (E 4–5, KM 4–5). Figure 2 shows the investment road map for information technology companies.
  • 42. Figure 2. Investment road map for information technology companies Comparing Steps in IT Companies: The Reduction of Impact The highest potential impact on future projects in the IT industry occurs when investing in the areas indicated in the first step and then gradually decreases. Assuming that the impact in the first step equals 100, the impact on future projects’ duration of investment in step two is 99. Accordingly, in step three, the duration is 81; in step four, 80; in step five, 62; and, finally, in step six, 61. Despite a relatively greater number of steps in comparison to the construction industry, the differences between some pairs of steps (1 and 2, 3 and 4, 5 and 6) are small. Thus, the decision to continue the investment after
  • 43. each step is of a different nature than in the construction industry where differences are bigger. The Investment Road Map: Machinery Industry The products of the machinery industry are the machines, tools, parts and devices used by the other industries. This industry, like construction and IT, also has a wide representation among companies world-wide. M 1-2, M 2-3, HR 1-2, HR 2-3 E 1-2, E 2-3, KM 1-2, KM 2-3 M 3-4, HR 3-4 E 3-4,
  • 44. KM 3-4 STEP 1 STEP 2 STEP 3 STEP 4 M 4-5, HR 4-5 STEP 5 STEP 6 E 4-5, KM 4-5 Seweryn Spalek. Finding a New Way to Increase Project Management Efficiency in Terms of Time Reduction - 544 - However, a limited amount of project management related research exists for this sector. The investment in project management maturity in the machinery industry should be considered in the following four steps: Step One In the first step, the investment in an increase of
  • 45. maturity levels from 1 to 2 and, successively, from 2 to 3 should be considered in the areas of methods and human resources (M 1–2, M 2–3, HR 1–2, HR 2–3). Step Two The next investments should be focused on further increases in the methods and human resources areas up to level 4 and, in parallel, they should be focused on further increases in the areas of environment and knowledge management from levels 1 to 3 (M 3–4, HR 3–4, E 1-2, E 2–3, KM 1–2, KM 2–3). Step Three In step three, an increase of project management maturity up to level 4 is advised in the environment and knowledge management areas (E 3–4, KM 3–4). Additionally, investment in the methods and human areas is suggested until they reach level 5 (M 4–5, HR 4–5). Step Four This final step is dedicated to the environment and knowledge management areas to reach a level 5 of project
  • 46. management maturity (E 4–5, KM 4–5). Figure 3 shows the investment road map for the machinery industry. Figure 3. Investment road map for the machinery industry Comparing Steps in Machinery Industry Companies: the Reduction of Impact If one assumes that the possible impact on future project time reduction in the machinery industry equals 100 as a result of performing step 1, the execution of step 2 will thus result in an impact level of 81. For steps 3 and 4, there is a further reduction of impact to 64 and 44, respectively. After performing each step and comparing the effort
  • 47. undertaken to the reported project outcomes, this information can be used to decide whether to continue with further investments in increasing maturity levels. Conclusions The Traditional vs. Agile Approach to Managing Projects The outcomes for the construction and machinery industries are alike, whereas the results of the study in information technology companies differs. This could be the result of similarities between the type of projects undertaken by both the construction and machinery industry and the different projects undertaken by IT companies. The construction and machinery industry companies execute projects in a more traditional approach, whereas IT projects have a greater tendency to migrate toward agility in project management. The concepts of traditional vs. agile approach in project management are widely discussed by (Fernandez & Fernandez, 2008;
  • 48. Shenhar & Dvir, 1996). That contrast would explain the major differences between the proposed investment roadmaps that are associated with either a more traditional or agile approach to project management. Construction and Machinery: the Traditional Approach In the traditional approach, the general advice is to invest gradually in all four areas of maturity with some advance investment in project management standards, tools and techniques and in the competencies of people involved in projects. The investment in company structures supporting project execution or project knowledge management areas should be considered in direct relation to progress in the methods and human resources areas. Information Technology: The Agile Approach Agility, as defined by its founders3, is less focused on strict methods and tools and more on knowledge flow, creating an appropriate working environment and team building processes (Dingsoyr et al., 2012). Therefore,
  • 49. 3 see: http://agilemanifesto.org/; accessed November 2013. M 1–2, M 2–3, HR 1–2, HR 2–3 E 1–2, E 2–3, KM 1–2, KM 2–3, HR 3–4, M 3–4 KM 4–5 E 4–5 E 3–4, KM 3–4, M 4–5, HR 4–5
  • 50. STEP 1 STEP 2 STEP 3 STEP 4 Inzinerine Ekonomika-Engineering Economics, 2014, 25(5), 538–548 - 545 - explaining why the investment in that type of project should be performed gradually and in parallel in each of the following areas: methods, human resources, environment and knowledge management. Although this study is limited to three industries, the suggested roadmaps can be used by other industries as well, especially by a wide range of manufacturing companies (NAICS, 2012). A company can choose a road map by assessing the similarities of the projects being executed to construction and machinery or IT projects. However, for some sectors, such as healthcare (Adler et al., 2003) or education (Palacios-Marques et al., 2013), more studies are needed to develop their specific road maps systems.
  • 51. Continuous Improvement? Not Necessary! The majority of academics and practitioners think that continuous improvement is vital for a company’s operations and its survival in the turbulent market. This approach is also a noticeable concept of increasing project management maturity levels as a continuous process, which should result in reaching the highest maturity level in all assessment areas. However, based on existing studies of maturity (Becker et al., 2009; Grant & Pennypacker, 2006; Mullaly &Thomas, 2010; Pasian, 2011; Rohrbeck, 2010), the vast majority of companies today report, on average, the second or third level of maturity in different industries and assessment areas. Therefore, more effort is put into discussing how the company should proceed with maturity improvement to achieve “the top.” However, some doubts exist if “the top” is even obtainable as there is a risk that assessment criteria can be changed over time as project
  • 52. management develops further. The first signs of such an approach are described in the model proposed by PMI (2008), in which no levels of maturity are defined. Instead, maturity is measured using a best practices list, which is continuously expanded by the PMI. This approach results in a “never ending” continuous effort to increase project management maturity in the company. Continuous improvement, however appropriate in theory, cannot always be the best solution for a company. As our study revealed, the impact of the increase of maturity on the reduction of future projects decreases over subsequent levels of maturity. The biggest impact occurs at the very beginning when a company is making its first steps on the road map. Then, the impact decreases by more than 50 % in the traditional approach to project management (represented by construction and machinery industries) and by approximately 40 % in the agile approach (represented by information technology companies). This brings into the question whether
  • 53. continuous improvement in maturity is effective for the company in terms of invested funds and achieved outcomes. Therefore, there should be time breaks in between steps on the investment road map to measure, ex post4, the 4 The translation from Latin means "after the fact". The use of historical returns has traditionally been the most common way to predict the probability of incurring a loss on any given day. Ex-post is the opposite of real impact of the increase in project management maturity on the recorded project’s time reduction. Based on this study, one knows the size of the predicted decrease of impact in the next step for traditional and agile projects. Therefore, one can compare possible benefits with the estimated effort needed to continue with the next step on the road map. As a result, one can conclude that the investment in further progress in project
  • 54. management maturity does not pay off and the limited company’s investment funds can be spent on other more promising and vital company activities. Limitations and Future Directions The research is limited to three types of industries, represented by 194 organisations with 107 belonging to machinery, 48 to construction and 19 to IT companies. In quantitative analysis, the size of this sample, especially of the latter two industries, can be assumed to be rather small. Therefore, definitive conclusions and generalisations supporting the outcomes of our study should await a larger sample, especially of IT and construction industries. The method of the prediction of the costs of forthcoming projects by investigating experts’ opinions is constrained by the quality of the respondents’ judgment, as is the case in all surveys of experts. Generally, predicting future outcomes is an extremely difficult issue (Glenn & Gordon, 2003). However, it was a conscious decision to use this method, despite its limitations, to advance the current stage of knowledge.
  • 55. Some of the limitations of the study can be strengthened to show the directions for future research. The mainstream method would be to investigate the other industries for which projects are a vital part of their operations with the same method. Therefore, follow-up research could be dedicated to the automotive, aerospace or mining sectors. Moreover, a study on the relationship between different investment types and an increase in maturity level would be advised. It would also be desirable for a new study to investigate the direct influence of different types of investments on projects’ outcomes. It may also be worth considering research into checking whether project management is not geographically sensitive, as the other recent studies on project management performance areas suggest. The results of this study advance the current state of knowledge in the project management area. However, the
  • 56. problem of linking investments in project management to outcomes for an entire company is complex. Hence, the considerations presented in the paper provide a better understanding of this complexity in the area of project duration and could be a trigger point for further studies of other types of project outcomes. Acknowledgments This work was supported by the National Science Centre grant. ex-ante, which means "before the event". Source: http://www.investopedia.com/ retrieved on November 2013. Seweryn Spalek. Finding a New Way to Increase Project Management Efficiency in Terms of Time Reduction - 546 - References Adler, P. S., Riley, P., Kwon, S. W., Signer, J., Lee, B., & Satrasala, R. (2003). Performance improvement capability:
  • 57. Keys to accelerating performance improvement in hospitals. California Management Review, 45(2). http://dx.doi.org/10.2307/41166163 Ahmad, S., Mallick, D. N., & Schroeder, R. G. (2013). New Product Development: Impact of Project Characteristics and Development Practices on Performance. Journal of Product Innovation Management, 30(2), 331–348. http://dx.doi.org/10.1111/j.1540-5885.2012.01002.x Avots, I. (1969). Why Does Project Management Fail. California Management Review, 12/1, 77–82. http://dx.doi.org/10.2307/41164208 Baron, J. N., & Hannan, M. T. (2002). Organizational blueprints for success in high-tech start-ups: Lessons from the Stanford Project on emerging companies. California Management Review, 44(3). http://dx.doi.org/10.2307/41166130 Basu, R. (2014). Managing quality in projects: An empirical study. International Journal of Project Management, 32(1), 178–187. http://dx.doi.org/10.1016/j.ijproman.2013.02.003 Becker, J., Knackstedt, R., & Poppelbuss, J. (2009). Developing Maturity Models for IT Management - A Procedure Model and its Application. Business & Information Systems Engineering, 1(3).
  • 58. Belt, P., Oiva-Kess, A., Harkonen, J., Mottonen, M., & Kess, P. (2009). Organisational maturity and functional performance. International Journal of Management and Enterprise Development, 6(2), 147–164. http://dx.doi.org/10.1504/IJMED.2009.022624 Booth, H. (2006). Demographic forecasting: 1980 to 2005 in review. International Journal of Forecasting, 22(3), 547– 581. http://dx.doi.org/10.1016/j.ijforecast.2006.04.001 Brucker, P., Drexl, A., Mohring, R., Neumann, K., & Pesch, E. (1999). Resource-constrained project scheduling: Notation, classification, models, and methods. European Journal of Operational Research, 112(1), 3–41. http://dx.doi.org/10.1016/S0377-2217(98)00204-5 Campos Silva, D. D., Santiago, L. P., & Silva, P. M. S. (2012). Impact of Premature Information Transfer on Cost and Development Time of Projects. IEEE Transactions on Engineering Management, 59(4), 692–704. http://dx.doi.org/10.1109/TEM.2012.2187661 Chen, B., Liou, F. M., & Huang, C. P. (2012). Optimal Financing Mix of Financially Non-Viable Private-Participation Investment Project with Initial Subsidy. Inzinerine Ekonomika- Engineering Economics, 23(5), 452–461. Chen, Y. Q., Liu, J. Y., Li, B., & Lin, B. (2011). Project delivery system selection of construction projects in China.
  • 59. Expert Systems with Applications, 38(5), 5456–5462. http://dx.doi.org/10.1016/j.eswa.2010.10.008 Cooke-Davies, T. (2007). Project Management Maturity Models. In P. W. G. Morris and J. K. Pinto (Eds.), Wiley Guide to Managing Projects (pp. 1234–1255). Hoboken, NJ, USA: John Wiley & Sons. http://dx.doi.org/10. 1002/9780470172391.ch49 Cooper, R. G., Edgett, S. J., & Kleinschmidt, E. J. (1999). New product portfolio management: Practices and performance. Journal of Product Innovation Management, 16(4), 333–351. http://dx.doi.org/10.1016/S0737-6782(99)00005-3 Davies, A., Gann, D., & Douglas, T. (2009). Innovation in Megaprojects: Systems Integration At London Heathrow Terminal 5. California Management Review, 51(2). http://dx.doi.org/10.2307/41166482 del Cano, A., & de la Cruz, M. P. (2002). Integrated methodology for project risk management. Journal of Construction Engineering and Management-Asce, 128(6), 473–485. http://dx.doi.org/10.1061/(ASCE)0733-9364(2002)128:6(473) Dingsoyr, T., Nerur, S., Balijepally, V., & Moe, N. B. (2012). A decade of agile methodologies: Towards explaining agile software development. Journal of Systems and Software, 85(6). http://dx.doi.org/10.1016/j.jss.2012.02.033
  • 60. Dominguez, D., Worch, H., Markard, J., Truffer, B., & Gujer, W. (2009). Closing the Capability Gap: Strategic Planning For The Infrastructure Sector. California Management Review, 51(2). http://dx.doi.org/10.2307/41166479 Elbanna, A. (2013). Top management support in multiple- project environments: an in-practice view. European Journal of Information Systems, 22(3), 278–294. http://dx.doi.org/10.1057/ejis.2012.16 Ethiraj, S. K., Kale, P., Krishnan, M. S., & Singh, J. V. (2005). Where do capabilities come from and how do they matter? A study in the software services industry. Strategic Management Journal, 26(1), 25–45. http://dx.doi.org/10.1002/smj.433 Fernandez, D. J., & Fernandez, J. D. (2008). Agile Project Management - Agilism Versus Traditional Approaches. Journal of Computer Information Systems, 49(2), 10–17. Fraser, P., Farrukh, C., & Gregory, M. (2003). Managing product development collaborations - a process maturity approach. Proceedings of the Institution of Mechanical Engineers Part B-Journal of Engineering Manufacture, 217(11), 1499-1519. http://dx.doi.org/10.1243/095440503771909890 Galbraith, C. S., & Merrill, G. B. (1996). The politics of forecasting: Managing the truth. California Management
  • 61. Review, 38(2). http://dx.doi.org/10.2307/41165831 Inzinerine Ekonomika-Engineering Economics, 2014, 25(5), 538–548 - 547 - Gary, K., Enquobahrie, A., Ibanez, L., Cheng, P., Yaniv, Z., Cleary, K., Kokoori, S., Muffih, B., & Heidenreich, J. (2011). Agile methods for open source safety-critical software. Software-Practice & Experience, 41(9). http://dx.doi.org/10.1002/spe.1075 Gasik, S. (2011). A Model of Project Knowledge Management. Project Management Journal, 42(3), 23–44. http://dx.doi.org/10.1002/pmj.20239 Glenn, J. C., & Gordon, T. J. (2003). Futures Research Methodology. Washington D.C.: The United Nations University. Grant, K. P., & Pennypacker, J. S. (2006). Project management maturity: An assessment of project management capabilities among and between selected industries. IEEE Transactions on Engineering Management, 53(1), 59–68. http://dx.doi.org/10.1109/TEM.2005.861802 Griffin, A. (1993). Metrics for Measuring Product Development Cycle Time. Journal of Product Innovation Management,
  • 62. 10(2), 112–125. http://dx.doi.org/10.1016/0737-6782(93)90003- 9 Griffin, A. (1997). The effect of project and process characteristics on product development cycle time. Journal of Marketing Research, 34(1), 24–35. http://dx.doi.org/10.2307/3152062 Herroelen, W., & Leus, R. (2005). Project scheduling under uncertainty: Survey and research potentials. European Journal of Operational Research, 165(2), 289–306. http://dx.doi.org/10.1016/j.ejor.2004.04.002 Hill, G. M. (2004). Evolving the project management office, a competency continuum. Information Systems Management, 21(4), 45–51. http://dx.doi.org/10.1201/1078/44705.21.4.20040901/84187.6 Hofman, M. (2014). Models of PMO functioning in a multi- project environment. Procedia - Social and Behavioral Sciences, 119, 46–54. Huang, X. L., Soutar, G. N., & Brown, A. (2004). Measuring new product success: an empirical investigation of Australian SMEs. Industrial Marketing Management, 33(2), 117–123. http://dx.doi.org/10.1016/S0019- 8501(03)00034-8 Iacovou, C. L., & Dexter, A. S. (2004). Turning around runaway information technology projects. California Management
  • 63. Review, 46(4). http://dx.doi.org/10.2307/41166275 IOC (2007). The Olympic symbols, 2nd ed.. The Olympic Museum: International Olympic Committee. Ji, F., & Sedano, T. (2011). Comparing Extreme Programming and Waterfall Project Results. IEEE. Kach, A., Azadegan, A., & Dooley, K. J. (2012). Analyzing the successful development of a high-novelty innovation project under a time-pressured schedule. R & D Management, 42(5), 377–400. Keil, M., & Mahring, M. (2010). Is Your Project Turning into a Black Hole?. California Management Review, 53(1). http://dx.doi.org/10.1525/cmr.2010.53.1.6 Kerzner, H. (2013). Project management: a systems approach to planning, scheduling, and controlling (11 ed.). Hoboken, NJ: John Wiley & Sons. Kessler, E. H., and Chakrabarti, A. K. (1996). Innovation speed: A conceptual model of context, antecedents, and outcomes. Academy of Management Review, 21(4), 1143–1191. Khoshgoftar, M., & Osman, O. (2009). Comparison of Maturity Models. New York: IEEE. Killen, C. P., & Kjaer, C. (2012). Understanding project interdependencies: The role of visual representation, culture and process. International Journal of Project Management, 30(5),
  • 64. 554–566. http://dx.doi.org/10.1016/ j.ijproman. 2012.01.018 Kowalska-Styczen, A., & Sznajd-Weron, K. (2012). Access to information in word of mouth marketing within a cellular automata model. Advances in Complex Systems, 15(8), 17 http://dx.doi.org/10.1142/S0219525912500804 Lacher, R. C., Coats, P. K., Sharma, S. C., & Fant, L. F. (1995). A Neural-Network for Classifying the Financial Health of a Firm. European Journal of Operational Research, 85(1), 53– 65. http://dx.doi.org/10.1016/0377-2217(93)E0274-2 Landeta, J. (2006). Current validity of the Delphi method in social sciences. Technological Forecasting and Social Change, 73(5), 467–482. http://dx.doi.org/10.1016/j.techfore.2005.09.002 Langerak, F., Griffin, A., & Hultink, E. J. (2010). Balancing Development Costs and Sales to Optimize the Development Time of Product Line Additions. Journal of Product Innovation Management, 27(3), 336–348. http://dx.doi.org/10.1111/j.1540-5885.2010.00720.x Lenfle, S., & Loch, C. (2010). Lost Roots: How Project Management Came to Emphasize Control over Flexibility and Novelty. California Management Review, 53(1), 32–55. http://dx.doi.org/10.1525/cmr.2010.53.1.32 Levin, G. (2010). Interpersonal skills for Portfolio, Program,
  • 65. and Project Managers: Management Concepts. McDonough, E. F. (2000). Investigation of factors contributing to the success of cross-functional teams. Journal of Product Innovation Management, 17(3), 221–235. http://dx.doi.org/10.1016/S0737-6782(00)00041-2 Mahadevan, B. (2000). Business models for Internet-based E- commerce: An anatomy. California Management Review, 42(4). http://dx.doi.org/10.2307/41166053 Seweryn Spalek. Finding a New Way to Increase Project Management Efficiency in Terms of Time Reduction - 548 - Matsui, Y., Abdallah, A. B., Sato, O., & Kitanaka, H. (2008). International Comparison of Manufacturing Practices and Performance. Mian, A., Takala, J., & Kekale, T. (2008). Role of Organizational Culture for Knowledge Sharing in Projects. 2008 Portland International Conference on Management of Engineering & Technology, Vols 1-5, 962–968. Morris, P. W. G. (1994). The Management of Projects. London: Thomas Telford. http://dx.doi.org/10.1680/mop.16934 Mullaly, M. E., & Thomas, J. (2010). Re-thinking project management maturity. Paper presented at the PMI Research and
  • 66. Education Conference, Washington, D.C. NAICS. (2012). North American Industry Classification System Washington, DC: U.S. Census Bureau. Neverauskas, B., & Stankevicius, V. (2008). Project Management: Research and Studies at the Faculty of Economics and Management of Kaunas University of Technology. Inzinerine Ekonomika-Engineering Economics(4), 59–66. Omorede, A., Thorgren, S., & Wincent, J. (2013). Obsessive passion, competence, and performance in a project management context. International Journal of Project Management, 31(6), 877–888. http://dx.doi.org/10. 1016/j.ijproman.2012.09.002 Onkal, D., Sayim, K. Z., & Gonul, M. S. (2013). Scenarios as channels of forecast advice. Technological Forecasting and Social Change, 80(4), 772–788. http://dx.doi.org/10.1016/j.techfore.2012.08.015 Palacios-Marques, D., Cortes-Grao, R., & Carral, C. L. (2013). Outstanding knowledge competences and web 2.0 practices for developing successful e-learning project management. International Journal of Project Management, 31(1), 14–21. http://dx.doi.org/10.1016/j.ijproman.2012.08.002 Pasian, B. L. (2011). Project management maturity: a critical analysis of existing and emergent contributing factors (pp.
  • 67. 266). Sydney: Faculty of Design, Architecture and Building, University of Technology. Pemsel, S., & Wiewiora, A. (2013). Project management office a knowledge broker in project-based organisations. International Journal of Project Management, 31(1), 31–42 http://dx.doi.org/10.1016/j.ijproman.2012.03.004 PMI. (2008). Organizational Project Management Maturity Model (OPM3®), Knowledge Foundation - 2nd Edition (pp. 204). Newtown Square, PA, USA: Project Management Institute. Prasnikar, J., & Skerlj, T. (2006). New product development process and time-to-market in the generic pharmaceutical industry. Industrial Marketing Management, 35(6), 690–702. http://dx.doi.org/10.1016/j.indmarman.2005.06.001 Radziszewska-Zielina, E. (2010). Analysis of the Impact of the Level of Partnering Relations on the Selected Indexes of Success of Polish Construction Enterprises. Inzinerine Ekonomika-Engineering Economics, 21(3), 324–335. Rohrbeck, R. (2010). Towards A Maturity Model For Organizational Future Orientation. Academy of Management Proceedings, 2010(1), 1–6. Rudzianskaite-Kvaraciejiene, R., Apanaviciene, R., & Butauskas, A. (2010). Evaluation of Road Investment Project Effectiveness. Inzinerine Ekonomika-Engineering Economics,
  • 68. 21(4), 368–376. Scapolo, F., & Miles, I. (2006). Eliciting experts' knowledge: A comparison of two methods. Technological Forecasting and Social Change, 73(6), 679–704. http://dx.doi.org/10.1016/j.techfore.2006.03.001 Shenhar, A. J. (2001). One size does not fit all projects: Exploring classical contingency domains. Management Science, 47(3), 394–414. http://dx.doi.org/10.1287/mnsc.47.3.394.9772 Shenhar, A. J., & Dvir, D. (1996). Toward a typological theory of project management. Research Policy, 25(4), 607–632. http://dx.doi.org/10.1016/0048-7333(95)00877-2 Spalek, S. (2011). Managing projects in an industrial environment. An overview of the project management maturity models. Paper presented at the 16th Annual International Conference on Industrial Engineering Theory, Applications and Practice – IJIE, Stuttgart, Germany. Spalek, S. (2013). Improving Industrial Engineering Performance through a Successful Project Management Office. Inzinerine Ekonomika-Engineering Economics, 24(2), 88–98. Spalek, S. (2014). Does Investment in Project Management Pay Off? Industrial Management & Data Systems, 114(5), 832–856. http://dx.doi.org/10.1108/IMDS-10-2013-0447 Tan, W. P., Sauser, B. J., & Ramirez-Marquez, J. E. (2011). Analyzing Component Importance in Multifunction
  • 69. Multicapability Systems Developmental Maturity Assessment. IEEE Transactions on Engineering Management, 58(2), 275–294. http://dx.doi.org/10.1109/TEM.2010.2071877 Thomke, S., & Reinertsen, D. (1998). Agile product development: Managing development flexibility in uncertain environments. California Management Review, 41(1). http://dx.doi.org/10.2307/41165973 Wilson, K., & Wauson, J. (2010). The AMA handbook of business writing : the ultimate guide to style, grammar, usage, punctuation, construction, and formatting. New York: American Management Association. Wright, R. N., Rosenfield, A. H., & Fowell, A. J. (1995). Report on Federal Research in Support of the US Construction Industry. Washington, DC.: National Science and Technology Council. Wyrozebski, P., & Spalek, S. (2014). An Investigation of Planning Practices in Select Companies. Management and Production Engineering Review, 5(2), 78–87. http://dx.doi.org/10.2478/mper-2014-0020 Zavadskas, E. K., Turskis, Z., Ustinovichius, L., & Shevchenko, G. (2010). Attributes Weights Determining Peculiarities in Multiple Attribute Decision Making Methods. Inzinerine Ekonomika-Engineering Economics, 21(1), 32–43.
  • 70. The article has been reviewed. Received in October, 2014; accepted in December, 2014. Copyright of Engineering Economics is the property of Engineering Economics and its content may not be copied or emailed to multiple sites or posted to a listserv without the copyright holder's express written permission. However, users may print, download, or email articles for individual use. Lucrări Ştiinţifice – vol. 55, Supliment /2012, seria Agronomie 145 MIGRANTS’ INTEGRATION PROCESSES IN EU – FIRST STEPS IN THEIR NEW HOME COUNTRIES (CASE STUDY: INTEGRA PROJECT) Ştefan COLIBABA 1 , Andreea CLEMINTE
  • 71. 2 , Anca COLIBABA 3 , Claudia DINU 4 e-mail: [email protected] Abstract Integra is a partnership project which aims work together with social partners such as migrant communities and financial institutions from a range of different European countries to create a Europe wide network of relevant institutions in order to reach migrants in partner countries to improve their integration into local society by providing them with opportunities to gain language skills on basic financial matters. The first steps for their language integration into the new society is made through an non formal approach, based on open interaction, simulation scenarios, improvisation and creative use of the learning materials, permanent exchange of questions and answers, reflection time and feedback opportunities. Key words: migrant communities, integration, financial
  • 72. language, simulation scenarios 1 A.I. Cuza University/Fundatia EuroEd, Iasi, Romania 2 Fundatia EuroEd, Iasi, Romania 3 Gr.T.Popa University of Medicine and Pharmacy/Fundatia EuroEd, Iasi, Romania 4 Gr.T.Popa University of Medicine and Pharmacy, Iasi, Romania Ever heard of financial integration? If it„s important for you (as migrant) to integrate with the local community of your new home country, then the Migrant Integration Kit developed during the INTEGRA project contains financial terminology, a financial glossary, and sources of financial information that will assist you by equipping you with the most useful social and financial phrases which can be helpful in
  • 73. unfamiliar situations in a new country. As the main characteristic, Romania remains an emigration country and becomes not only a transit country, but also a destination country more attractive to immigrants. According to Eurostat forecast, from 2008 - 2060, Romania will have at least a net immigration rate of 18.4 per thousand (1.84%). Unlike the Romanian migration quantified at approximately 10% of Romanian people, migration phenomenon in Romania is relatively modest. Data available at the end of 2010 shows that legal immigration holds 0.3% of the total population (total non-EU immigrants / total population). According to the National Commission for Prognosis, in 2013-2015, the number of immigrants is likely to increase to 200,000 to 300,000 immigrants, which would mean 1% - 1.4% of the population.
  • 74. The INTEGRA project (http://integra- project.eu) brought together partners from 11 countries (LT, GR, DE, ES, TR, IE, NL, RO, GB, PL and BY) with the aim to work together with social partners such as migrant communities and financial institutes to create a Europe wide network of relevant institutes in order to reach migrants in partner countries to improve their integration into local society by providing them with opportunities to gain language skills on basic financial matters. Within the context, the partnership managed to develop the following activities: 1. Research needs analysis in partner countries produced to find out about the problems and experiences that migrants face in a new country because they do not speak the host country language and are not familiar even with the basic norms of everyday life (results
  • 75. are uploaded on the project website under the heading "Summary") good practice examples in each partner country collected following the template developed by the coordinating institution on the financial language training and country specific financial and banking operations (results are uploaded on the project website under the heading "Summary") comparative analysis produced on the life situation of migrants in the old and new EU mailto:[email protected] http://integra-project.eu/ http://integra-project.eu/ Universitatea de Ştiinţe Agricole şi Medicină Veterinară Iaşi 146 countries ( results are uploaded on the project website under the heading "Summary")
  • 76. 2. Contacts and training programs Contacts established and cooperation agreements with migrant communities in partner countries signed Contacts established and cooperation agreements with the social partners – financial, non-governmental and state institutions working with migrants, signed The training methodologies and programs for training representatives from migrant communities and migrants as final beneficiaries developed Collection of the materials and work on the creation of the active in the future portal www.integra-project.eu with the assistance from social partners are underway 3. CD – Migrant Integration KIT Useful phrases: a list of essential useful words and phrases in English, Lithuanian, German, Dutch, Polish, Greek, Spanish, Romanian, Belorussian and Turkish that
  • 77. could enhance not only your language but also general skills for better adaptation to local society of your new country and labour market. Simulations: dialogues on different situations dealing with financial and social welfare issues for simulating real life situations and in such a way as to develop your skills and confidence in managing your personal matters in your new country. Country specific financial tips: specific information and advise on how to deal with everyday financial needs in partner countries. Useful info - Links to financial institutions or other financial information sources in all partner countries (Lithuania, Poland, Germany, Uk, Ireland, Greece, Spain, Netherlands, Romania, Belaruss Turkey)
  • 78. - Links to governmental institutions or other support organizations working with migrants in all partner countries (Lithuania, Poland, Germany, Uk, Ireland, Greece, Spain, Netherlands, Romania, Belaruss Turkey) - Links to migrant communities in partner countries - Links to other projects or programs working on migrant integration issues Info on representatives from migrant communities. List of contacts of representatives from migrant communities in partner countries that you are welcome to get in touch with. Good practice examples in partner countries. Examples of good practices for improving migrants financial integration from various projects, activities or actions being carried out by financial, educational or other
  • 79. kind of institutions in partner countries, could help you understand and deal with unfamiliar situations in your new country MATERIAL AND METHOD One of the most important activities of the project was the organisation and implementation of the trainings together with language professionals and financial experts to representatives of migrant communities in order to cascade that training to ultimate beneficiaries-migrants from the partner countries. Trainings for representatives - instructors from migrant communities organized, who will later cascade the acquired knowledge and gained skills to the final beneficiaries – migrants from partner countries. Community representatives were selected according to the pre-agreed criteria (one of the most important – good local language skills and good knowledge of national culture). In each partner country 8-10 persons were trained. The most active representatives (3-5 per country) were included into the European network of trainers Tthe trainings (training time-10 hours) were meant for training the instructors on how to use the developed by the project financial language
  • 80. teaching program and methodology, based on elements of drama and introduce the project website containing the collected teaching/learning materials and useful info. Every potential instructor was equipped with a CD containing materials and methodology guidelines to be used for teaching final beneficiaries. Trainings for final beneficiaries – migrants from partner countries organized with migrant community representatives acting as „teachers – instructors“. Each partner country-10 migrants (average 3 migrants per community), 16 hours training program (2 hours for project presentation, introduction into the project website, 12 hours for trainings following the program , 2 hours for reflections and summing up). Trainings were run by the migrant community representatives - instructors, who have already integrated in the new environment. The trainings were developed after the following Methodology and Guidelines, which has been elaborated to support the migrant representatives on how to conduct six (language skills) workshops’ with migrant communities: http://www.integra-project.eu/ Lucrări Ştiinţifice – vol. 55, Supliment /2012, seria Agronomie
  • 81. 147 Training session one 1. Carry out an induction in relation to the overall project. 2. Introduce ‘Representative’ aims – what the representatives are aiming to accomplish by conducting the ‘Six Language Skills Workshops’ with migrant communities. These aims are: To train members of migrant communities to develop better skills and confidence in managing personal financial matters; To develop migrant communities’ basic language skills for dealing with financial matters. The financial areas are: Claiming Social Benefit; How to use the Website; Opening a Bank Account; Exchange and Transfer of Money; Paying for Services or Products; Job Related Information; Negotiating Payments for Accommodation; Reporting a Stolen Bank Card by Telephone; Borrowing Money and Getting Credit. 3. Ethos of a Trainer Facilitator. 4. Training in how to conduct Drama Games and Exercises. 5. Functions of Drama Games and Exercises. Training session two 1. Website Training for the Representatives. 2. Discussion of content for the first two
  • 82. Language Skills Workshops i.e. Claiming Social Benefit and Opening a Bank Account. 3. Representatives themselves practice running / facilitating under supervision the following drama games and exercises from workshops one and two of the Language Skills Workshops. The games are: Name Game, Culture Shock and Energy Circle. Also do work on functions of the exercises. 4. Representatives are provided with feedback from the trainer in relation to the above. 5. Introductory training in Image Work and Improvisation for the representatives. Look at Complete the Image and Image of the Word. Work on functions. Training session three 1. Representatives themselves again practice running or facilitating under supervision the following drama games and exercises from workshops one and two of the Language Skills Workshops. The games are: Name Game, Culture Shock, Energy Circle and Getting to Know You. 2. Representatives are provided with feedback from the trainer in relation to the above. 3. Representatives themselves practice running or facilitating under supervision the following drama games and exercises from workshops two, three, four and five. The games are: Walk Clap, Bomb and Shield, Falling and Columbian Hand Hypnosis. 4. Representatives are provided with feedback from the trainer in relation to the above. 5. Training in Image Work and Improvisation for the representatives. Look at Complete the Image, Image of the Word, and Image of the Hour.
  • 83. 6. Training in ‘How to Read a Script’. 7. Discussion of content for numbers three, four, five and six from the Language Skills Workshops. Training session four 1. Representatives themselves practice running or facilitating under supervision a short version of workshops Two and Three from the Language Skills workshops. 2. Representatives are provided with feedback from the trainer in relation to the above.. 3. Training in Image Work and Improvisation for the representatives. 4. Training in ‘How to Read a Script’. After TRAINING SESSION FOUR the two representatives should ideally go into the community and conduct (pilot) Workshops One and Two from the Language Skills workshops with their migrant communities. Training session five 1. Discussion and feedback for the representative’s workshops one and two conducted with the migrant community. Representatives discuss with the trainer how the workshops went. 2. Representatives themselves practice running or facilitating under supervision a short version of ‘Workshops Four, Five and Six re the Six Language Skills Workshop Series. 3. Representatives are provided with feedback from the trainer in relation to the above. 4. Training in Image Work and Improvisation for
  • 84. the representatives. 5. Training in ‘How to Read a Script’. Training session six: 1. Reflection on overall training activity. 2. Provide final pointers and support. 3. Opportunity to practice runs a guided workshop – to be chosen by the representatives. RESULTS AND DISCUSSIONS In figures the results of the training process were: 28 training sessions with 104 hours of training for migrant communities‟ representatives 58 sessions with 195 hours of trainings with final beneficiaries. Number of trainers, who trained representatives: 15 Number of trained representatives: 60 Universitatea de Ştiinţe Agricole şi Medicină Veterinară Iaşi
  • 85. 148 Number of trained final beneficiaries: 275 Migrant communities involved: from Afghanistan , Somalia, Russia, Bulgaria, Belarus, Romania, Lithuania, Palestinia, Poland , Iraq , Syria, Israel, Tunisia, Portugal, South Africa, Germany, Sweden, Ireland, Norway, UK, Denmark, Morocco, Algeria, Jordan, Taiwan, France, Greece, Moldova, Nigeria, Senegal, Mali, Cameroon, Pakistan, Philippines, Ethiopia, Ukraine, India, Eritrea, Turkey, Armenia, and from Spanish/Latin American community Taking into consideration the reflections of the participants on the trainings, the results were: What was innovative about the trainings?
  • 86. adults representing communities of foreigners in Romania was new and exciting -formal approach which is much more encouraging and effective; it helps people get rid of inhibitions and it connects them directly to real life situations, which is actually what is relevant to them. How much did trainees benefit from the trainings? suggested for the training are the real benefit for people who struggle with a new language in various cultural, economic and social contexts. The spot-on activities organized during the training were a frame for future practice based on the materials offered in the Glossary and set of Usual Phrases. developed teaching techniques, especialy by
  • 87. using drama and role play activities What new skills and competences were gained? were the interactive techniques for working with participants, the use of drama and simulation techniques, role play. communication and cultural mediation skills and their specific financial and banking language. other competences mentioned were: groups forms / materials communities will get to know each other more
  • 88. quickly and will interact easier; a feeling of group belonging was stimulated Do they feel more confident now in dealing with financial matters? fact that after the training I was able to go to the bank and speak in Romanian” Romanian” numbers, dates used in dialogs” CONCLUSIONS All the partners proofed the fact that both trainings were very successful and useful for the participants. They were of the opinion that trainings have shown migrants the way how to start dealing with financial matters by speaking the language of the host country. The activities
  • 89. suggested for the training were the real benefit for people who struggle with a new language in various cultural, economic and social contexts. Combining drama methods with concrete information on financial matters allowed migrants to feel more relaxed and be open to the learning process. ACKNOWLEGMENTS This article is based on the development of the trainings, with all the support materials and methodology, carried out within the INTEGRA project (LLP GRUNDTVIG Multilateral, 510258-LLP-1-2010-1- LT-GRUNDTVIG-GMP), co-funded by the European Union. REFERENCES Iris Alexe, Bogdan Paunescu, 2011 - Studiu asupra fenomenului imigratiei in Romania. Integrarea strainilor in societatea Romaneasca, ISBN 978- 973-0-10715-9 Sandu (coord), 2006 - Locuire temporară în străinătate:
  • 90. Migraţia economică a românilor 1990-2006, Fundaţia pentru o Societate Deschisă Violeta Mirinaviciute, 2012 - INTEGRA Project and its Final Product - Migrant Kit, http://www.integra- project.eu/news-events/article/150-integra-final- event-international-conference-migrants- integration-processes-in-eu-first-steps-in-their- new-home-countries ***http://www.integra-project.eu http://www.integra-project.eu/news-events/article/150-integra- final-event-international-conference-migrants-integration- processes-in-eu-first-steps-in-their-new-home-countries http://www.integra-project.eu/news-events/article/150-integra- final-event-international-conference-migrants-integration- processes-in-eu-first-steps-in-their-new-home-countries http://www.integra-project.eu/news-events/article/150-integra- final-event-international-conference-migrants-integration- processes-in-eu-first-steps-in-their-new-home-countries http://www.integra-project.eu/news-events/article/150-integra- final-event-international-conference-migrants-integration- processes-in-eu-first-steps-in-their-new-home-countries http://www.integra-project.eu/news-events/article/150-integra- final-event-international-conference-migrants-integration- processes-in-eu-first-steps-in-their-new-home-countries http://www.integra-project.eu/ Copyright of Agronomy Series of Scientific Research / Lucrari Stiintifice Seria Agronomie is
  • 91. the property of University of Agricultural Sciences & Veterinary Medicine of Iasi and its content may not be copied or emailed to multiple sites or posted to a listserv without the copyright holder's express written permission. However, users may print, download, or email articles for individual use.