
Recommended
Recommended
More Related Content
Similar to 1a. PROBLEM 1Millar Company has the following cost rec.docx
Similar to 1a. PROBLEM 1Millar Company has the following cost rec.docx (17)
More from felicidaddinwoodie
More from felicidaddinwoodie (20)
Recently uploaded
Recently uploaded (20)
1a. PROBLEM 1Millar Company has the following cost rec.docx
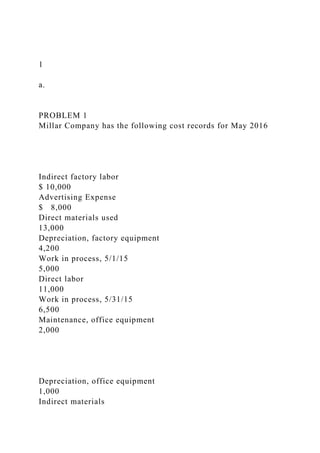
- 1. 1 a. PROBLEM 1 Millar Company has the following cost records for May 2016 Indirect factory labor $ 10,000 Advertising Expense $ 8,000 Direct materials used 13,000 Depreciation, factory equipment 4,200 Work in process, 5/1/15 5,000 Direct labor 11,000 Work in process, 5/31/15 6,500 Maintenance, office equipment 2,000 Depreciation, office equipment 1,000 Indirect materials
- 2. 1,200 Sales Commission 10,000 Office Manager Salary 4,000 Instructions Prepare a cost of goods manufactured schedule for May 2016 MILLAR COMPANY Cost of Goods Manufactured Schedule For the Year Ended May 31, 2016
- 4. PROBLEM 2 Mottle Inc. fixed costs are expected to be $80,000 and variable costs are expected to be $20 per product. Sales price is $40 per product and targeted net income is $300,000 . Instructions a. Determine the required sales in units and dollars to break even. b. Determine the required sales in units to achieve targeted net income of $300,000. PROBLEM 3 Marvin Company estimates that annual manufacturing overhead costs will be $900,000. Estimated annual operating activity bases are: direct labor cost $450,000, direct labor hours 300,000, and machine hours 150,000. a. Compute the predetermined overhead rate using (i) direct labor cost as the activity base (ii) direct labor hours as the activity base and (iii) machine hours as the activity base. b. If Job 101 has 60,000 direct labor hours, compute the
- 5. manufacturing overhead that it should be assigned using the predetermined overhead rate computed in question a. above. c. If Job 102 has 20,000 machine hours, compute the manufacturing overhead that it should be assigned using the predetermined overhead rate computed in question a. above. PROBLEM 4 Blake Johnson has the following cost and production data for the Mixing Department for December 2013 Cost data: Beginning work in process inventory, December 1 Direct Materials $30,000 Conversion Cost $ 6,000 $36,000 Cost incurred during production in December Direct Materials $390,000 Conversion costs $122,000 $512,000 Total Costs $548,000 Production data Completed and transferred out 52,000 Ending work in process 8,000
- 6. Ending work in process was 100% complete as to materials and 25% complete as to conversion costs. Instructions (a) Compute the equivalent units for materials and conversion costs. (b) Determine the unit cost for materials and conversion Note: Can complete solutions in Excel and then paste in spaces below, or can type directly in spaces below. Running head: BUSINESS DECISION-MAKING PROJECT 2 1 BUSINESS DECISION MAKING PROJECT 2 6 Business Decision-Making Project 2 Trisha Shetler QNT/ 275 Negussie Nega December 12,2016
- 7. Identify the types of descriptive statistics that might be best for summarizing the data, if you were to collect a sample. Cross-tabulations and contingency tables Cross tabulations and contingency tables provide an excellent platform to compare data taken from different samples. By looking at the data that has been taken from different organizations, it will not be difficult to spot the performance of the organization as far as motivation of employees is concerned on the table. Exposing such data to the interested parties is one of the most effective methods of informing the audience. The method will go a long way in summarizing the collected data. Graphical representation The use of scatter plots will go a long way in showing how data that would be of use to the entire process was attained. Scatterplots give an overview of the concentration of the population in a specific parameter (Weis & Weis, 2012). The data about the employees who are workers of organizations which have been doing well due to motivation will be recorded on the graphs. From there it will be easy it identify if the employees from Apple are well motivated or not. For example, when a sample of some of the employees in a different organization is taken, it is more likely that the employees are scattered on a plot. The research team might use a different color for employees who are motivated and use a different color for the ones who are not motivated. By so doing, the interested parties or the audience will just need to know what color that represent employees from a particular organization? By using the method, it will be easy to communicate with the audience on the matter. If the data would have been displayed without being summarized on the graph, it is more likely that it would have been difficult for the entire
- 8. audience to understand. Descriptions of conditional distributions In each and every given research, the processing of disclosing the information about data collected by the relevant parties as well as researchers must be carried out. Descriptions about how the data is contributed go a long way in informing the research team of the progress and the results of the entire process. The method is bound to go a long way in helping to summarize the data collected. Analyze the types of inferential statistics that might be best for analyzing the data, if you were to collect a sample. i) Confidence interval To ensure that the claims about the organization in failing to motivate the employees are backed, there must be processes that should be followed (Weis & Weis, 2012). The processes will help in the summarization of data that will contribute to support the problem that has been associated with the organization. In confidence interval, the same process is used to test different population with the aim of coming to a conclusion. The method uses the same process as well as the same population but uses separate experiments. By employing the method in the course of summarizing the data, it will be easy to know if employees at the organization are motivated or not. Putting into consideration that the same only the experiment will be separate, it’s hard to rule out if the process will reach to goals that will be of benefit to the research process. However, the experiments that will be used will be categorized in a way that one experiment tests on the availability of motivation in the employees while the other will be testing of the unavailability of motivation among the employees. i) One sample test of difference One sample test of difference compares the average of a specific sample. The method is used to summarize data and offer results concerning the specific research carried out. The method would be suitable to be used in this test for some
- 9. reasons. The performance of a given number of motivated employees is different from the performance of non-motivated employees. The use of the data will need another data that might have been taken from a different population. It is more probably that employees who are motivated are likely to produce good results. Therefore, by taking a mean of employees who are motivated and taking a mean of employees who are not motivated, the research team will identify the level of motivation that lacks in the organization (Lowry, 2014). The method only concentrates on one sample. Therefore, there needs to be borrowed samples from a previous research or research that might have been done in a different organization for comparison. The mean on just the sample that might be collected in this case might not be of importance to the research since the results needed must be compared with others. The method is allowed to borrow for data from another study as long as the data is credible and complete. ii) Contingency tables A contingency table is a method that is more effective in comparing data from different populations. The table included data from various researches. The data is then compared. By so doing, it becomes easy to different between which data is more variable than the other. For example, if the performance of the motivated employees was recorded on one side of the table and the performance of the employees who are not motivated on the other side, it is easier to notice the difference. The method is the easiest and more accurate compared to the rest. Analyze the role probability or trend analysis might play in helping address the business problem Trend analysis plays a major role in influencing the process of comparing different business data and information. Research information and presentation of results relies heavily on the results as well as the consistency of the trends in information gathered. Strategies are developed to correspond to the trends in line with the basic organization goals. Trend and probability analysis facilitates more understanding on how the organization
- 10. has performed. At the same time, it helps in prediction of whether the current business operations will make the organization prosper or lead to its downfall. Trend analysis can be used to improve the organization through; a) Identification of areas where the organization registers high performance b) Identification of areas where the business is underperforming c) Provision of evidence for the sake of infirming decision making. Probability, on the other hand, assists in assessments through the inclusion of organization data from different departments and comparing the data with other research results. This way, it is easier to form conclusions, make comparisons and more so, determine areas of improvement. The entire market research effort is a necessary path, and very beneficial for most organizations. Apple company should emulate other prospering and coming up organizations in trying to mitigate the problem of lack of employee efficiency and find ways to motivate its personnel, to increase overall productivity. References Lowry, R. (2014). Concepts and applications of inferential statistics. Weiss, N. A., & Weiss, C. A. (2012). Introductory statistics. London: Pearson Education. Bickel, P. J., & Lehmann, E. L. (2012). Descriptive statistics for nonparametric models I. Introduction. In Selected Works
- 11. of EL Lehmann (pp. 465-471). Springer US. Bickel, P. J., & Lehmann, E. L. (2012). Descriptive statistics for nonparametric models II. Location. In Selected Works of EL Lehmann (pp. 473-497). Springer US. Running head: BUSINESS DECISION MAKING 1 BUSINESS DECISION MAKING 6 Business Decision Making Project Part 1 Trisha Shetler QNT/ 275 Negussie Nega December 9, 2016 BUSINESS DECISION MAKING PROJECT PART 1 Name and description of the selected company
- 12. Apple Inc. Apple Inc. was incorporated in 1977. The organization deals with the design, manufacturing, and marketing of telecommunication devices such as mobile phones, personal computers and numerous digital music players to the vast number of consumers it serves. The organization is globally recognized for selling a wide range of software commodities, as well as providing network solutions as well as digital content applications (Need, 2006). The products offered by the organization, include; iPhone, iPod’s, watches and a wide range of digital accessories as well as support offerings. Apple sells to a broad consumer base, in particular through the iTunes store, and the Mac app store. The organization has employees all over the world, with many chains of distributions stores. Effectiveness is highly emphasized on in the organization. The applications which have been unveiled by the organization include; iLife, iWork, and many other software products, which are available for download. The organization, through these aspects, has managed to create a contact with its consumers totally. The customers feel valued, acknowledged and of high value to the organization. Apple pay is another organization’s service, which facilitates payment systems. This system allows users to make payments in the Apple stores that accept contactless payments. The main aim is to take part in purchase and sale without necessarily having to participate in applications on devices. The organization has remained profitable for quite an extended period now and continued with the spirit of innovation. Employees are also encouraged to remain operationally efficient for the sake of organization success. Description of the problem at that company Workplace motivation plays a significant role in any organization. Motivation in the workplace influences performance and determines whether the employees will perform more efficiently or not. Motivation may come from the internal aspect of the personnel and may be affected by the
- 13. workplace environment as well. Motivation, therefore, has an impact on the different aspects of employee performance. The biggest problem in Apple Inc. is the lack of employee motivation in the workplace. Leaders in the entity need to step forward and more so, realize that personnel has to be steered ahead to produce useful results. The staff is highly reluctant to any changes which may be introduced within their respective functional units. Although this might not be present and widely revealed, it is evident that the production and quality of work in the entity has reduced. Most companies do not recognize the factors which affect the motivation of their personnel. Management ends up looking at personnel as just any other tool in the toolbox, which is necessarily required to complete the product in the company and release it to the market (Need, 2006). As organizations continue to become diverse, problems are bound to arise primarily as operations continue. The underlying causes of most of the organization issues are; the lack of proper communication, wrong organization structure, and lack of a chain of command within the entity as well. Employee issues might be the primary cause of organization problems. If personnel is encountered with supervisor issues, personal problems, traumas, company structure and poor working conditions, these aspects are bound to demotivate them. Organizations, just like Apple Company, for instance, need to ensure that they are consistently relevant and more so, that procedure within the entity are not affected by inconsistency in managerial effectiveness within the entity. One research variable from that problem. Organization performance is the best study variable to be used for the particular problem. Considering that motivation has a direct effect on employee performance, the results are bound to dictate just how much efficiency within the entity has been affected by the lack of motivation among personnel at Apple Inc. The methods you would use for collecting a suitable sample
- 14. Organization data can be collected through different approaches such as; a) Interviews Interviews can be structured, semi-structured, or unstructured. The researcher gets to interrogate some staff within the organization. In this case, more quantitative information is sought, about organization performance for instance, and employee satisfaction among other factors. b) Focus groups The use of focus groups is highly preferred especially when there is a need to obtain information in a more reliable manner from a group, rather than from individuals. In such a scenario, the use of focus groups is bound to remain inefficient. Organization staff are prone to be intimidated by their superiors, and might not be open about the problem in the presence of other subjects. The use of focus groups does not provide room for secrecy which compromises the validity of the research data provided. c) Observation Observation is the most efficient means of collecting primary research data (Pan, 2016). Observation involves the use of natural settings. The researcher takes lengthy and a descriptive note of whatever is happening around him. However, there are restrictions to situations which can be observed in their natural environment. This way, such method is prone to lack of research validity in the long run. Observation has numerous advantages since; it can offer a flavor for what is taking place, it gives insight into the bigger picture within the organization, and more so, it can be used to help in designing the rest of the research. d) Self-study Self-study takes the form of a systematic approach, and relies on the following steps; i. Determine the aim of research ii. Determining the permission which might be needed iii. How the observations will be recorded iv. What will be recorded
- 15. v. What will be done with the findings e) Acton research Action research involves the performance of the actual research process, and not just asking about the problem in the entity. Action research in a collection of quantitative data relies on the use of the following framework; collaborative, practical intervention mode and the active involvement in the area of action. How you will know if the data collection method would be valid and reliable. Data testing for reliability and validity can be done through content validity and criterion validity. At this stage research results are compared and weighed against other variables and control experiments to determine their accuracy and efficiency. References Need, W. C. D. H. P. (2006). Human Resource Management: Gaining a competitive advantage. Sahlman, W. A. (2010). The structure and governance of
- 16. venture capital organizations. Journal of financial economics, 27(2), 473-521. Pan, Y. C., & Tan, C. (2016). Three Dimensional Norm-Based Knowledge Management for Knowledge Intensive Business Service Organizations: An Organizational Semiotics Perspective. International Journal of Knowledge Engineering, 2(1), 50-55.