1. How To Plot Transconductance and Even More
By Ruida Yun
gm/Id based methodology is preferred for short-channel length analog circuit design however there is no
GUI support for this method in the current Cadence release. The process can be tedious and requires
much more insight understanding about Cadence. This tutorial will walk through the process on how to
generate the gm/ID curves that can be used as a guide for future designs.
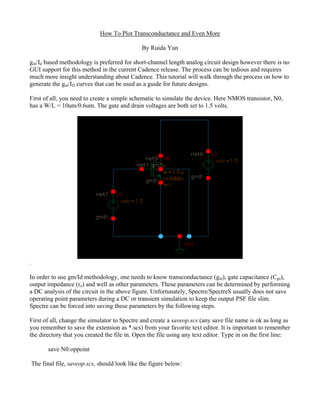
First of all, you need to create a simple schematic to simulate the device. Here NMOS transistor, N0,
has a W/L = 10um/0.6um. The gate and drain voltages are both set to 1.5 volts.
.
In order to use gm/Id methodology, one needs to know transconductance (gm), gate capacitance (Cgs),
output impedance (ro) and well as other parameters. These parameters can be determined by performing
a DC analysis of the circuit in the above figure. Unfortunately, Spectre/SpectreS usually does not save
operating point parameters during a DC or transient simulation to keep the output PSF file slim.
Spectre can be forced into saving these parameters by the following steps.
First of all, change the simulator to Spectre and create a saveop.scs (any save file name is ok as long as
you remember to save the extension as *.scs) from your favorite text editor. It is important to remember
the directory that you created the file in. Open the file using any text editor. Type in on the first line:
save N0:oppoint
The final file, saveop.scs, should look like the figure below:
2. Note that N0 is the instance name of the NMOS you just created. The option oppoint directs Spectre to
save all DC operation point parameters for N0. You can find more about the command save from
Spectre user guide.
Add this file as a model library file just like what you usually do to setup Spectre. Make sure the path
to saveop.scs is correct.
It is important to know that AWD waveform tool was used for this tutorial rather than
wavescan. In order to change from the default waveform tool, in the Analog Design Environment
window, click on the session tab and click on options. On the option that says “waveform tool” select
AWD and save/apply the changes.
3. .
Now, setup a DC simulation and sweep the gate voltage from 0 to 3V. Run the simulation and open the
Results Browser from Analog Design Environment. The results browser can be found in the Analog
Design Environment by clicking on the tools tab and then selecting the results browser.
4. If you go to schematic-> psf/->Run1->dc-dc-> N0, you can see all the DC operating point parameters
are saved and you can plot directly from Cadence. If you would like to plot the gm of the transistor for
instance, right click gm and you should see a graph like this:
5. This is very cool because you can find the gm for different gate voltages; however, you need process the
data to obtain the advanced curves. In order to generate these curves, you have to use OCEAN to save
all these data. The data can be processed using any other software such as Matlab/Octave or Excel later
on.
Go to Analog Design Environment and click menu session, then save script. A window will pop up and
that is the first OCEAN script you are going to use. Please note that this ocean script file will be saved
in your default cadence directory. From the script file, you can find out that all these setups you made
for simulation in here. OcnWaveformTool set the wave viewer to AWD. Command Simulator selects
Spectre as the simulation engineer, so on and so forth.
You have to add few lines to this simple script file to save the DC operating point parameters you are
interested in (copy this text exactly):
selectResult('dc)
plot(getData("N0:gm"))
ocnPrint(?output "~/gmid.dat" ?numberNotation 'scientific
getData("N0:gm"),getData("N0:id"),getData("N0:vdsat"),getData(“N0:cgs”))
Here, ?output means all data will be saved to a file called gmid.dat. You can modify the tag line
"~/gmid.dat" in order to have the gmid.dat file saved any directory of your choice; otherwise the
gmid.dat file will be saved in your root directory:
getData select the parameter you want to save. The resulting ocn file should look like this:
6. *Please note that getData(N0:cgs) is missing a set of quotation marks in the figure above. Please do not
forget to add those in your *.ocn script file.
Now you can load this file and run the simulation again from CIW window by typing:
load(“gmid.ocn”)
Go to the root directory (or where ever you saved the file) and you can find gmid.dat. All the
parameters you want, gm, Cgs, Id, Vdsat (Defined as vd) are saved here as shown in the figure below:
7. The data can then be plotted using any program. A sample figure generated from Matlab is shown
below.