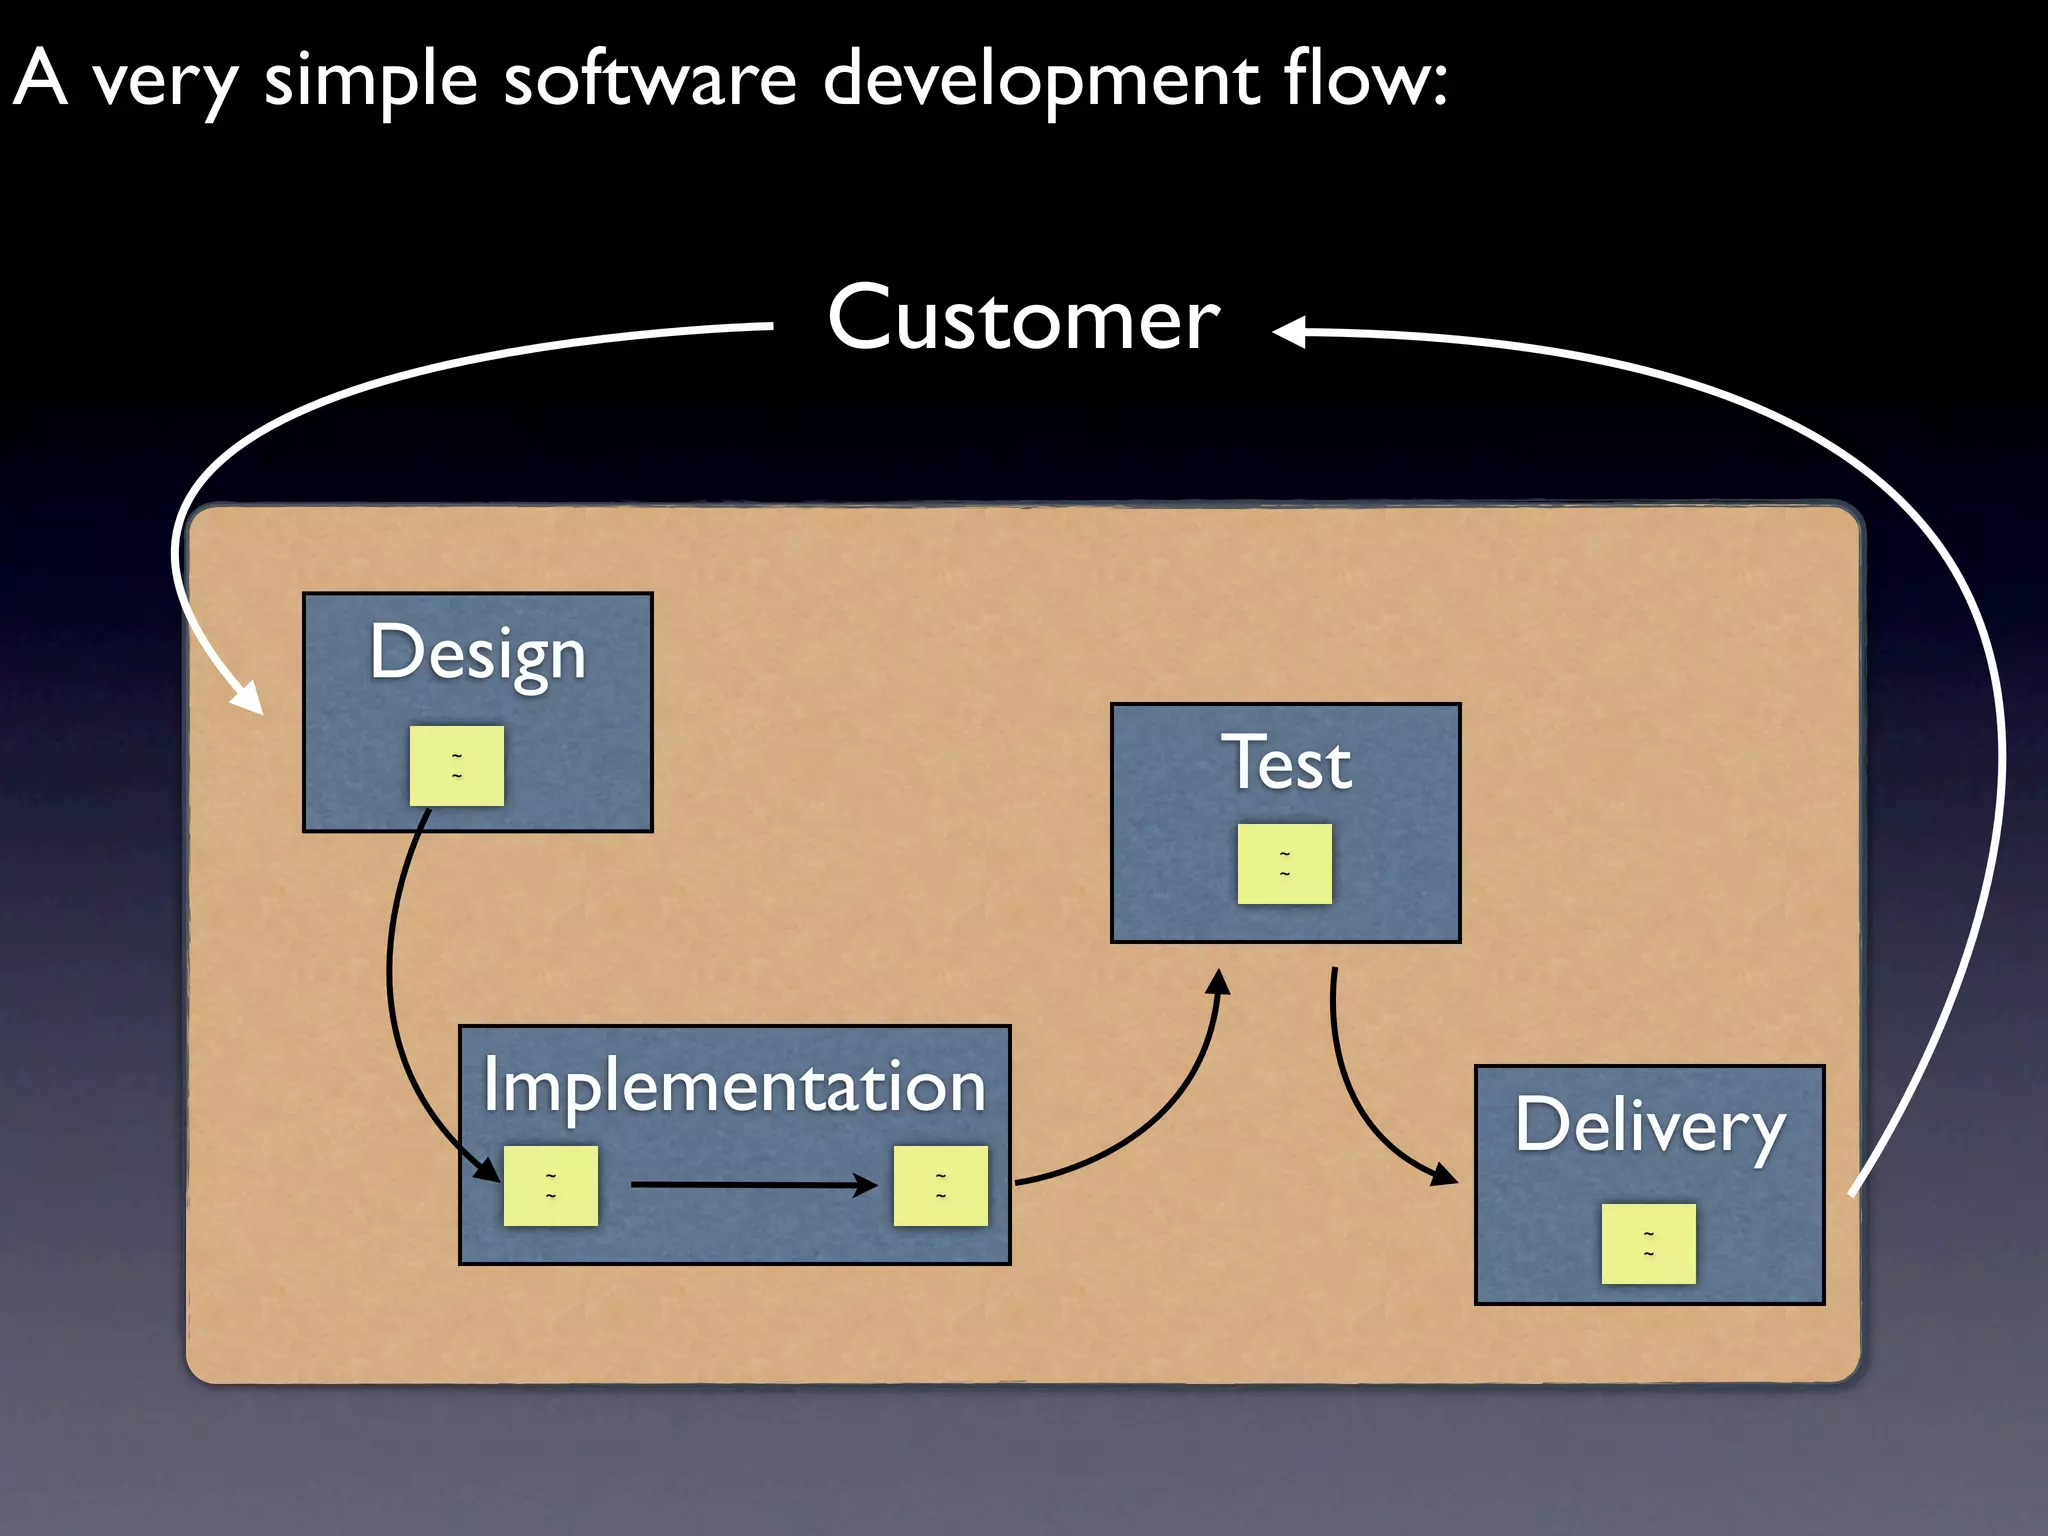
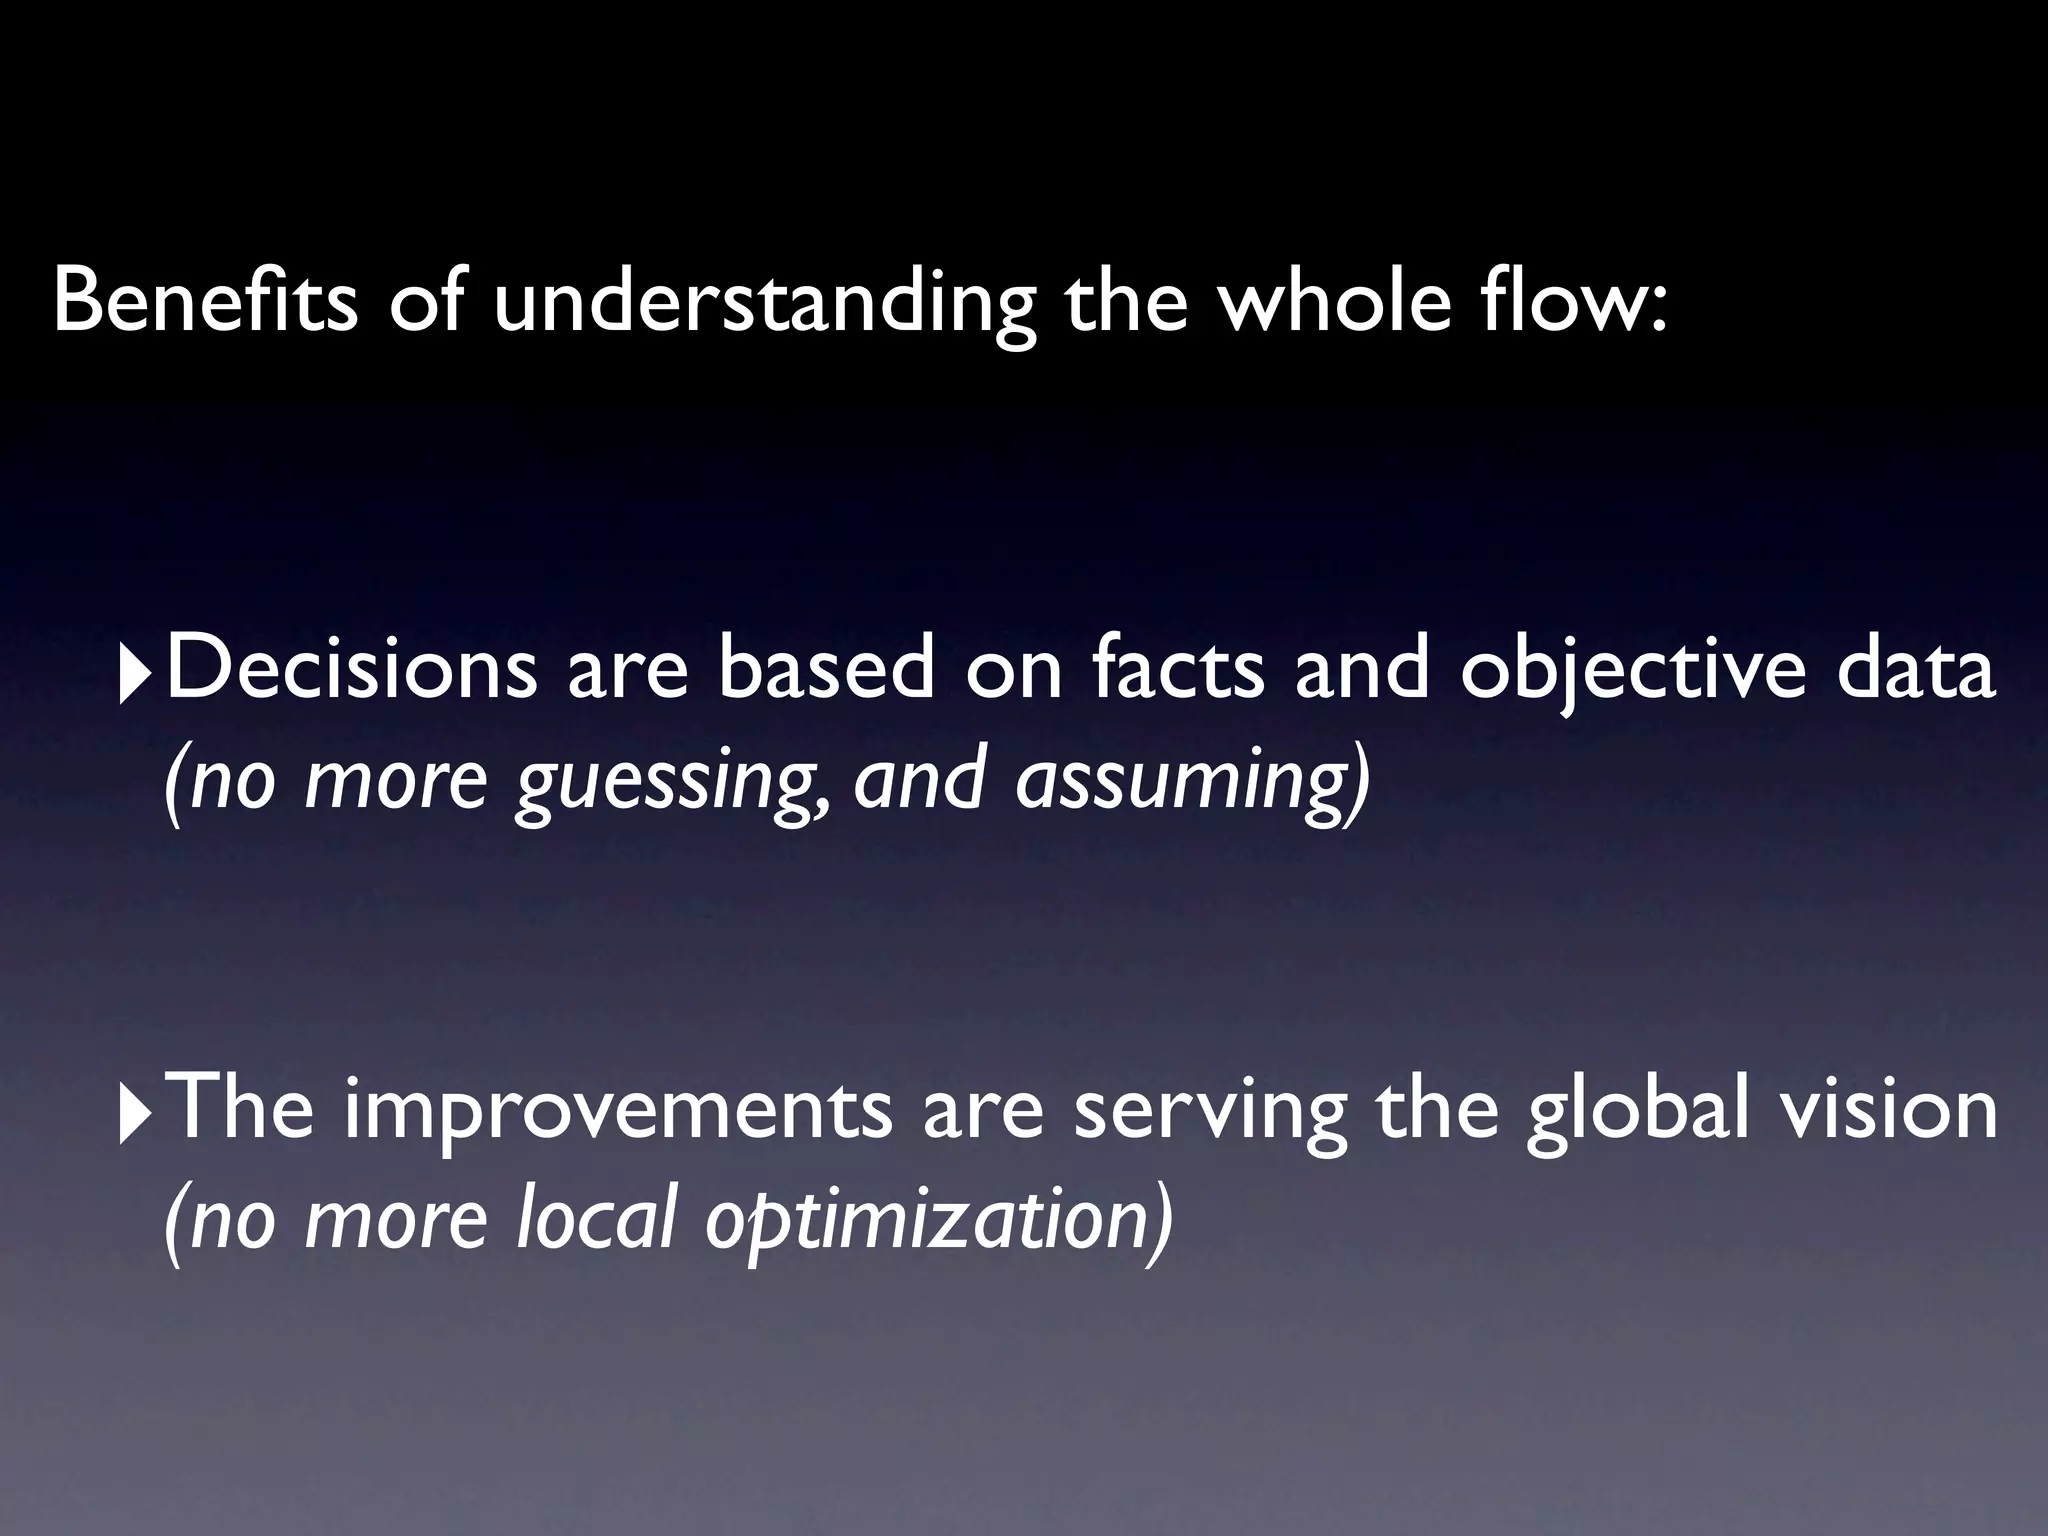
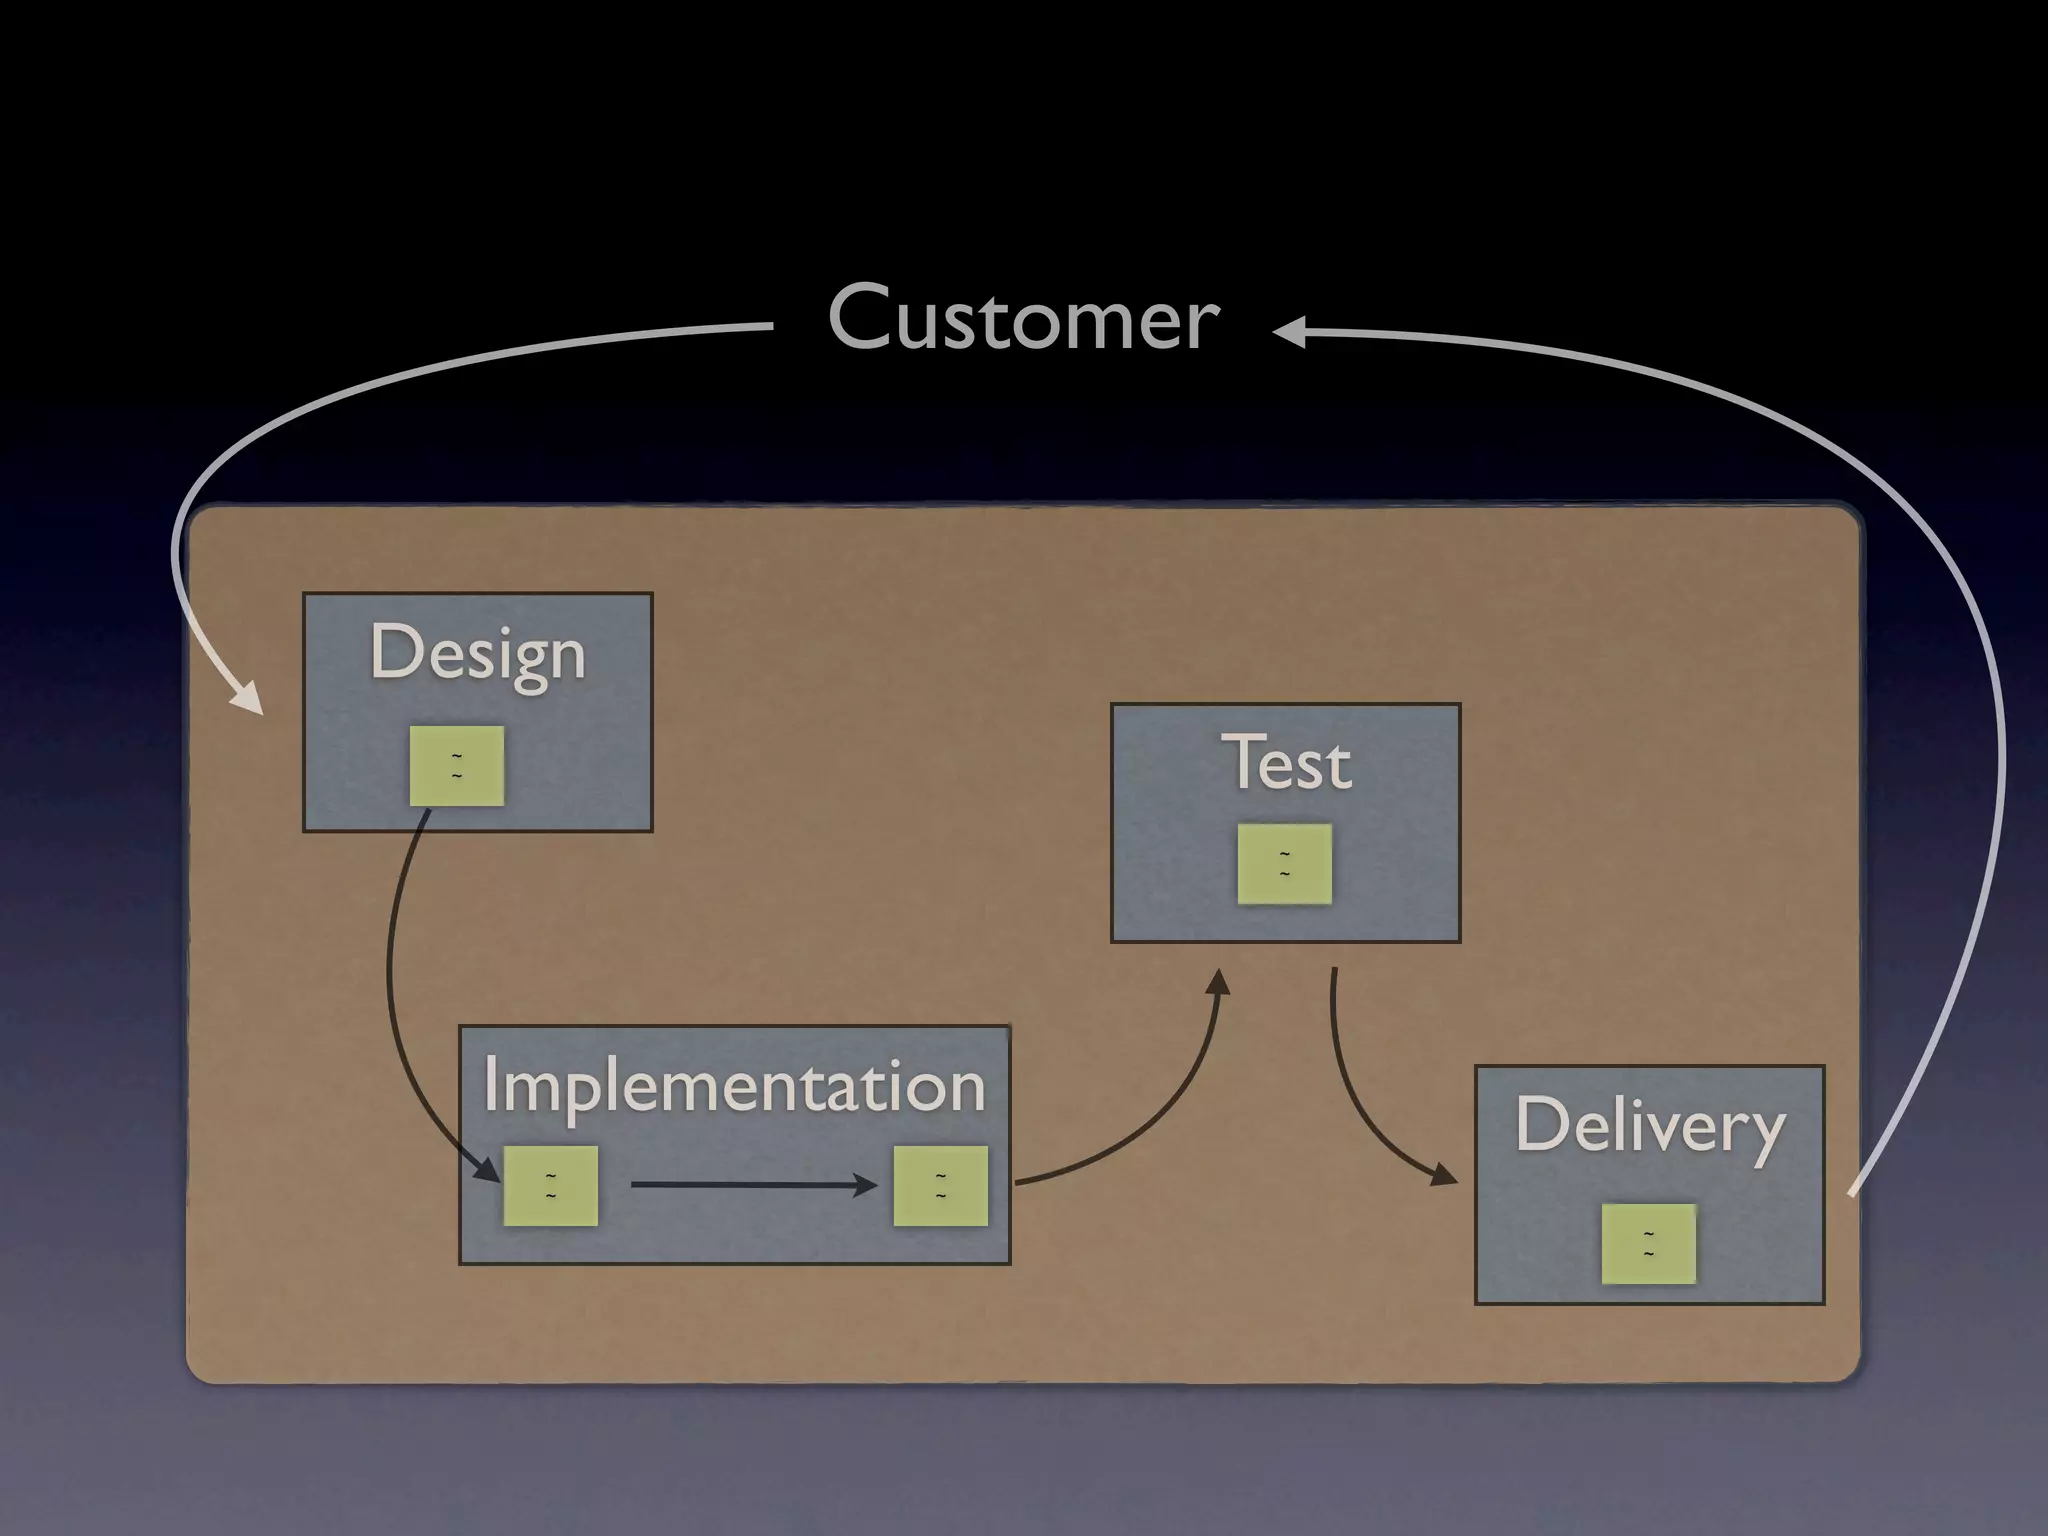
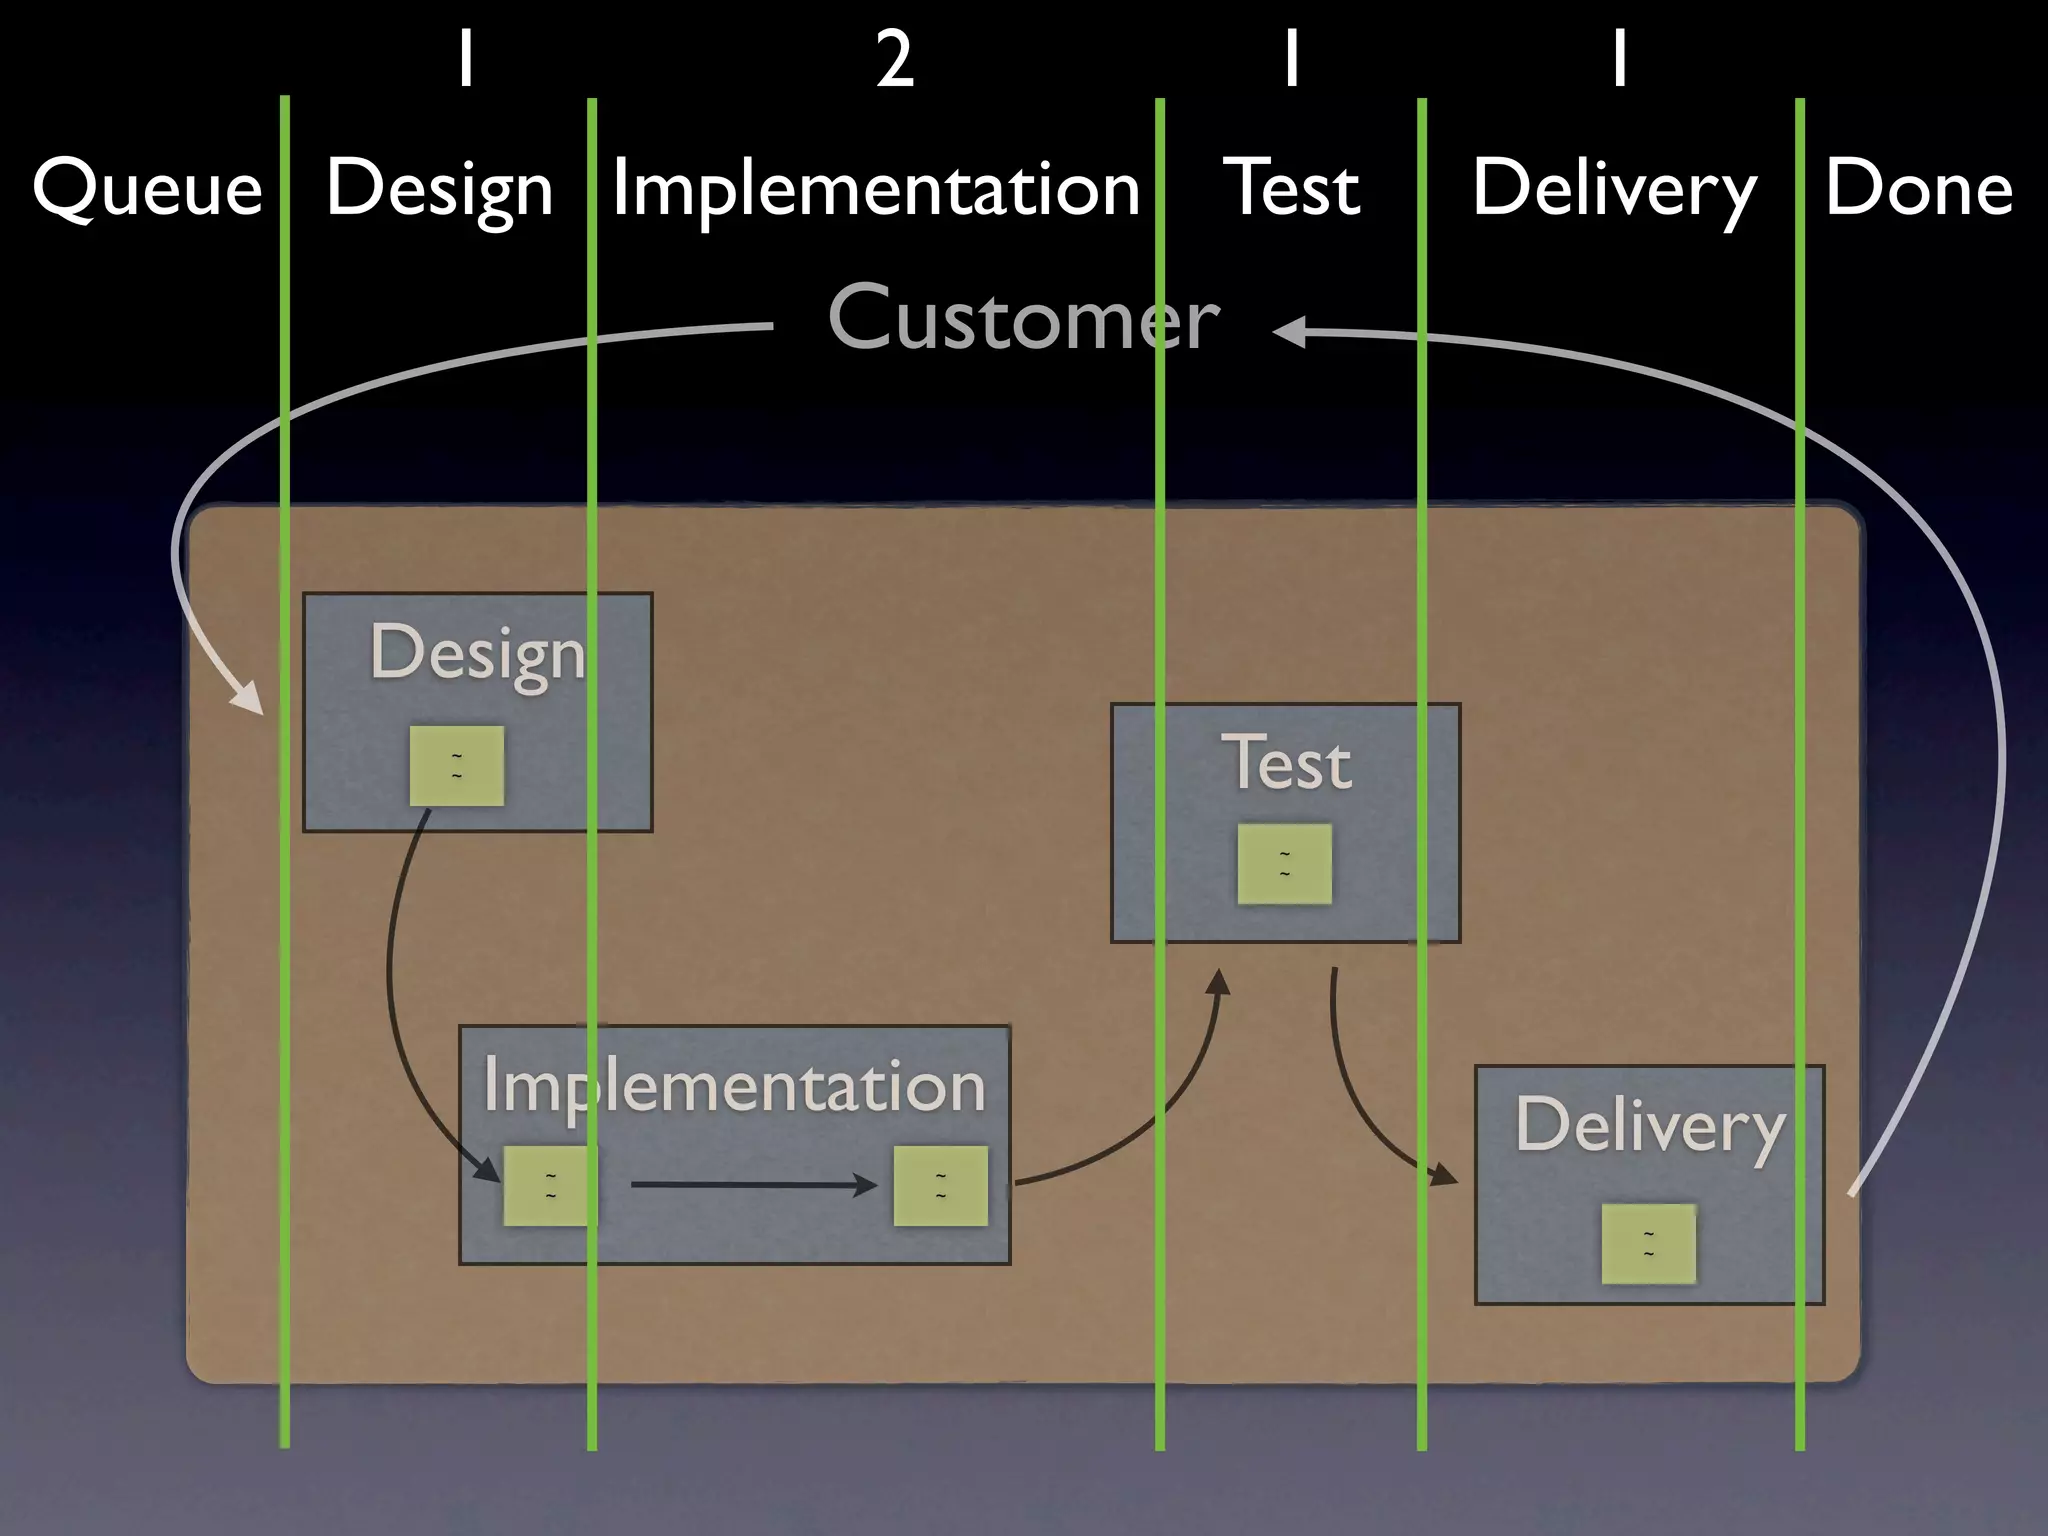
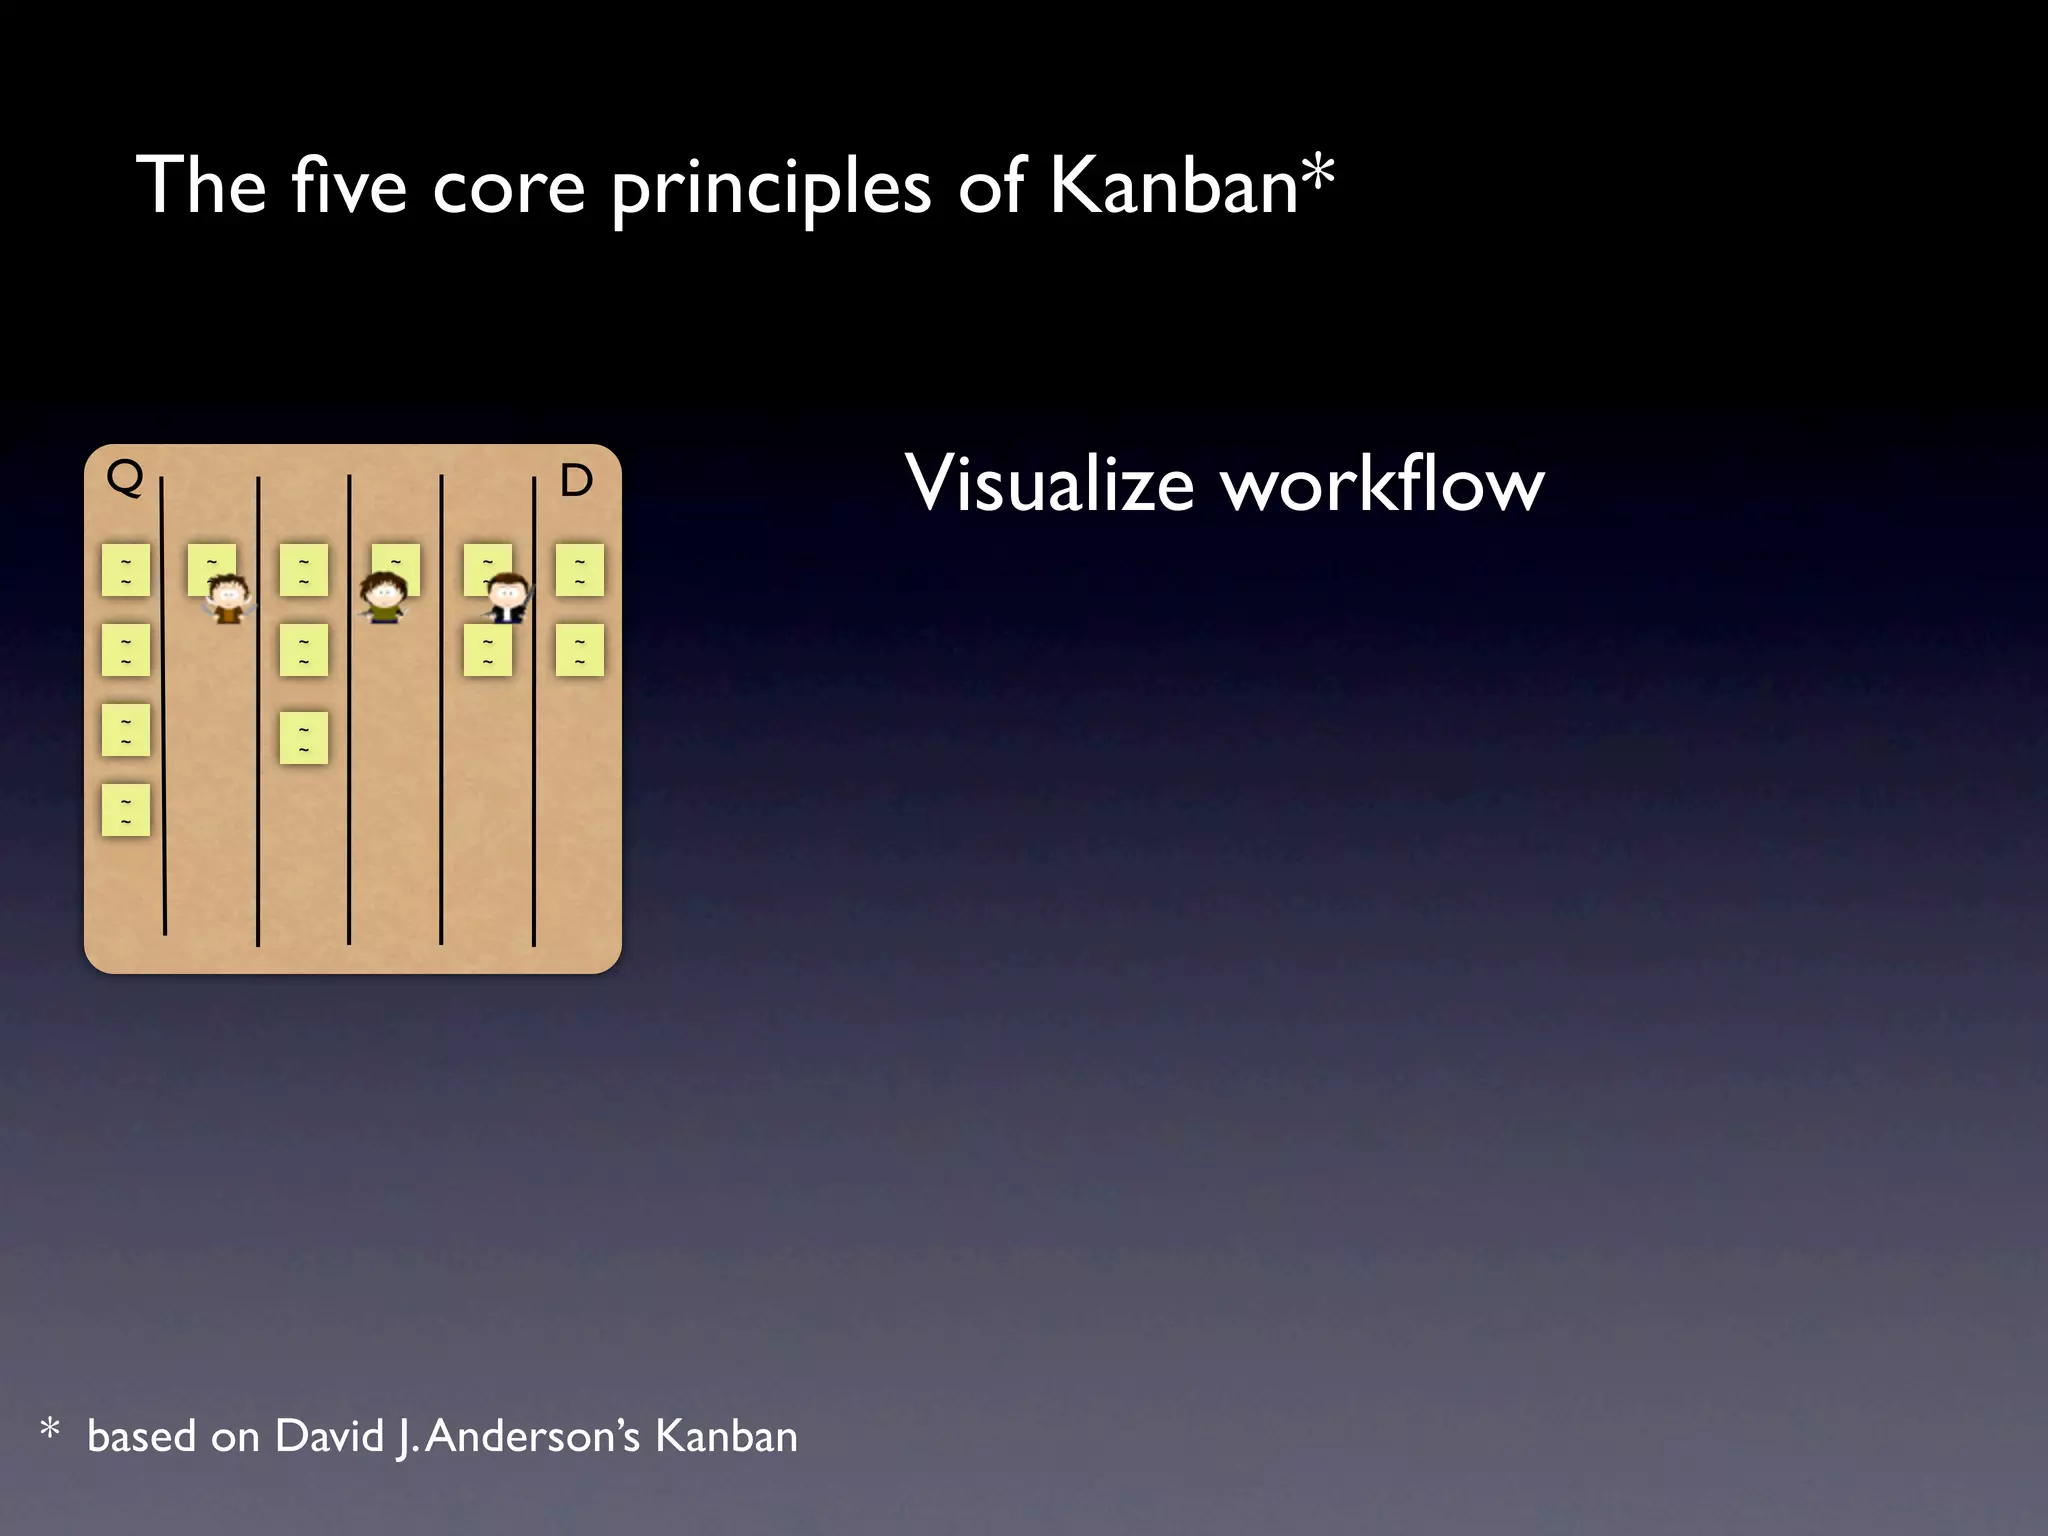
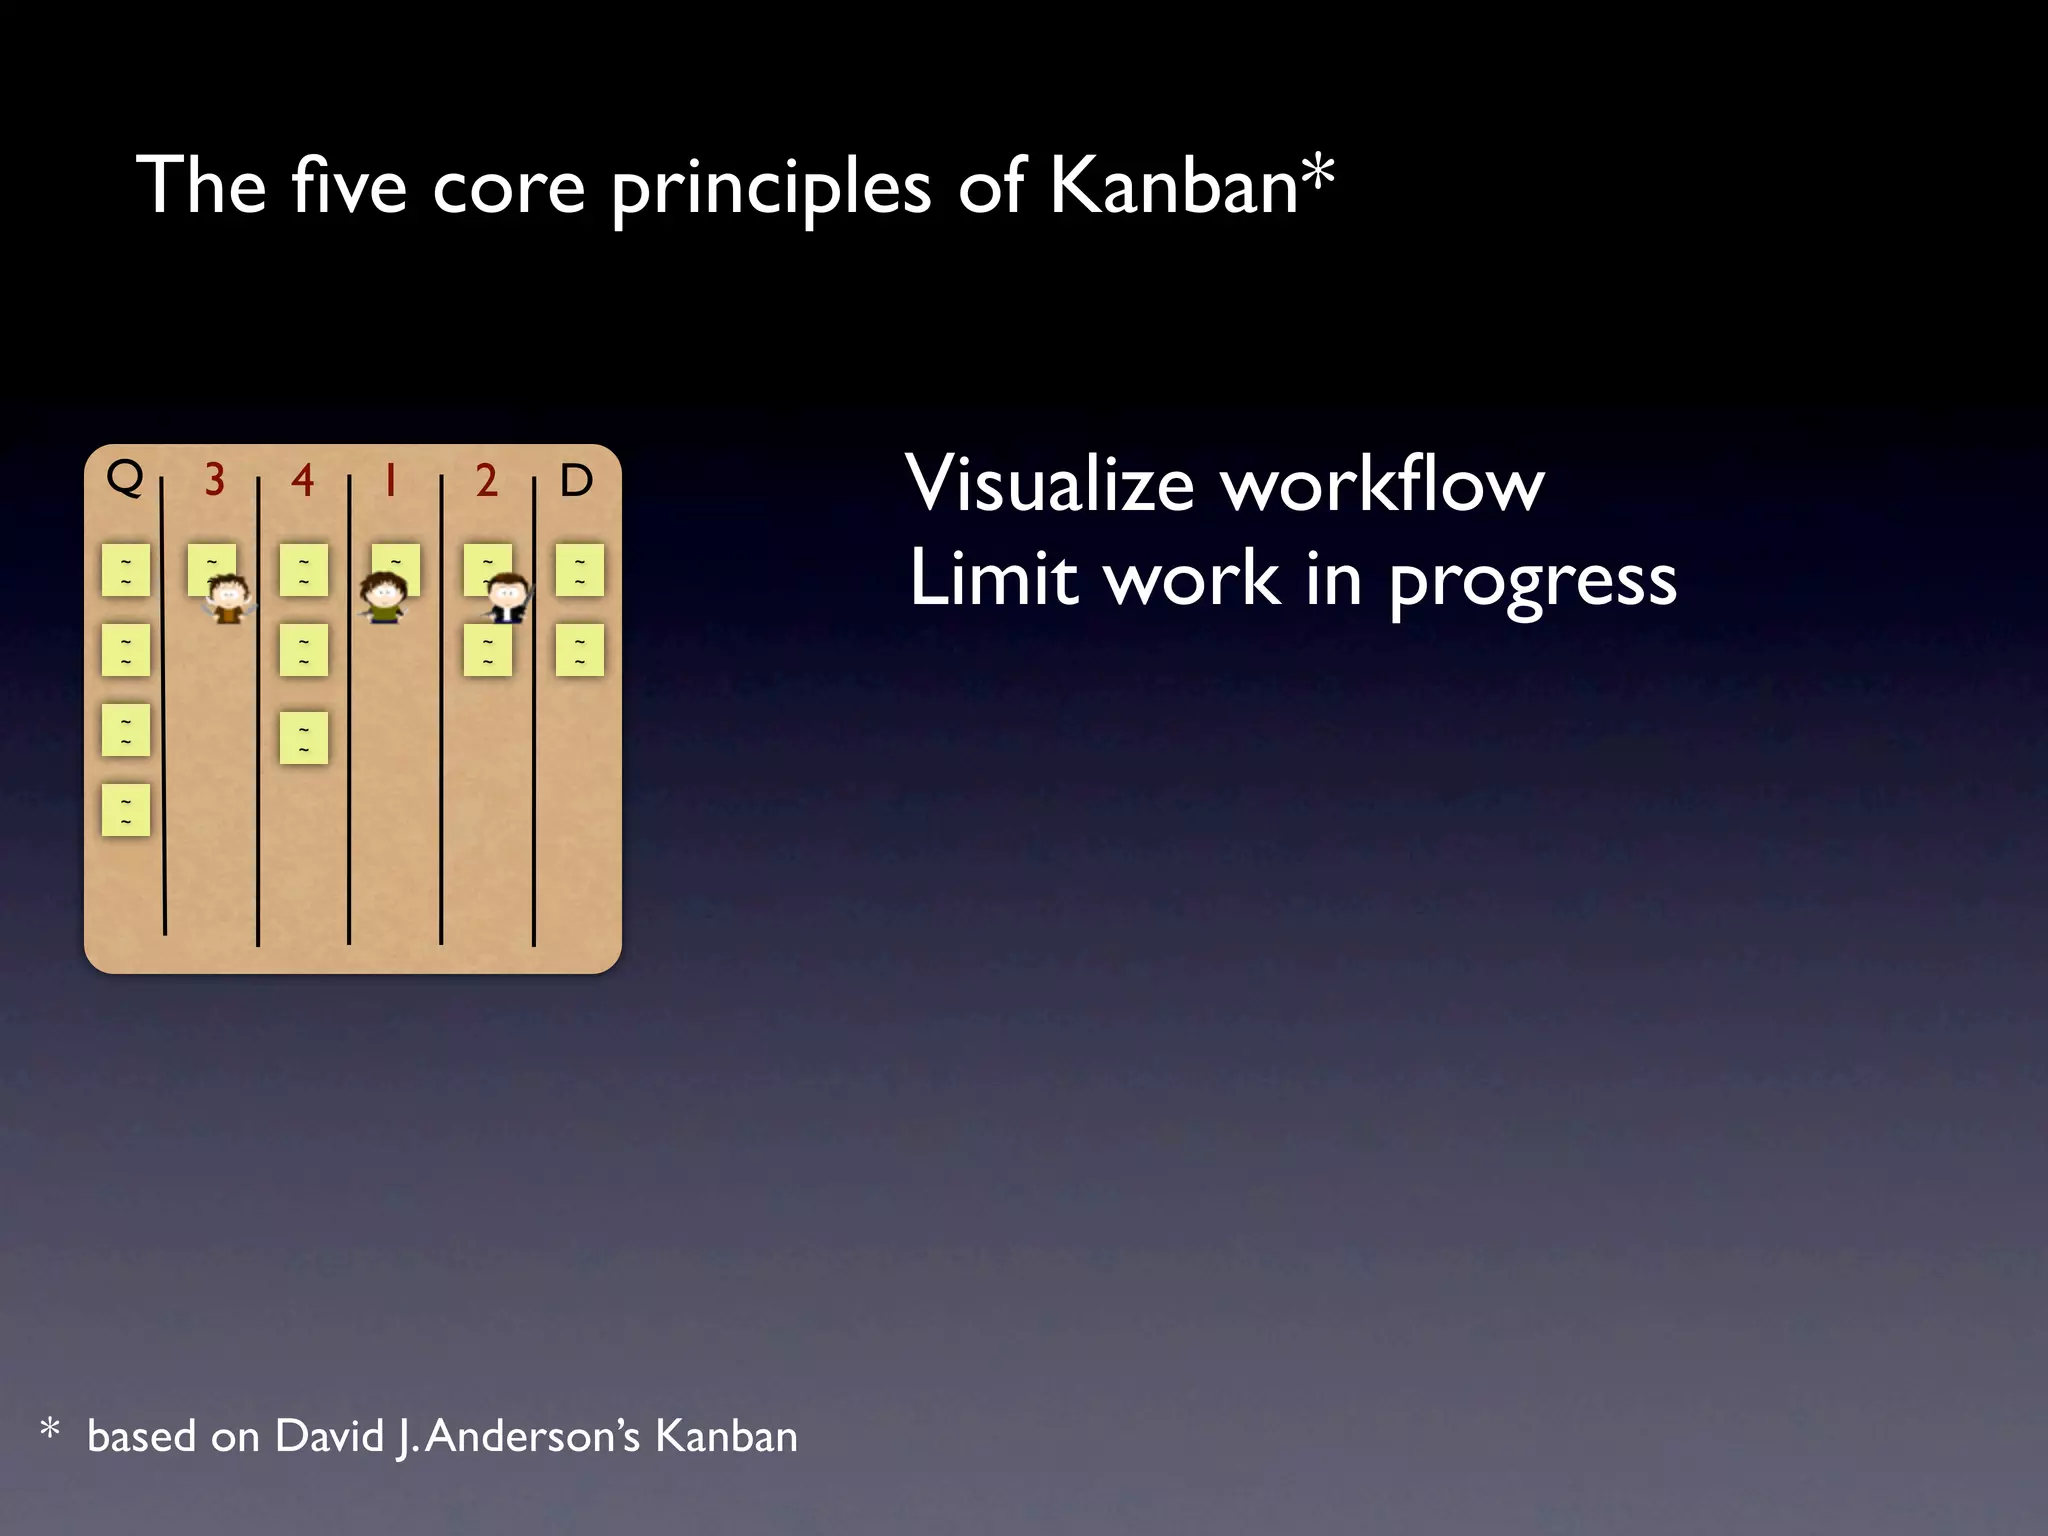
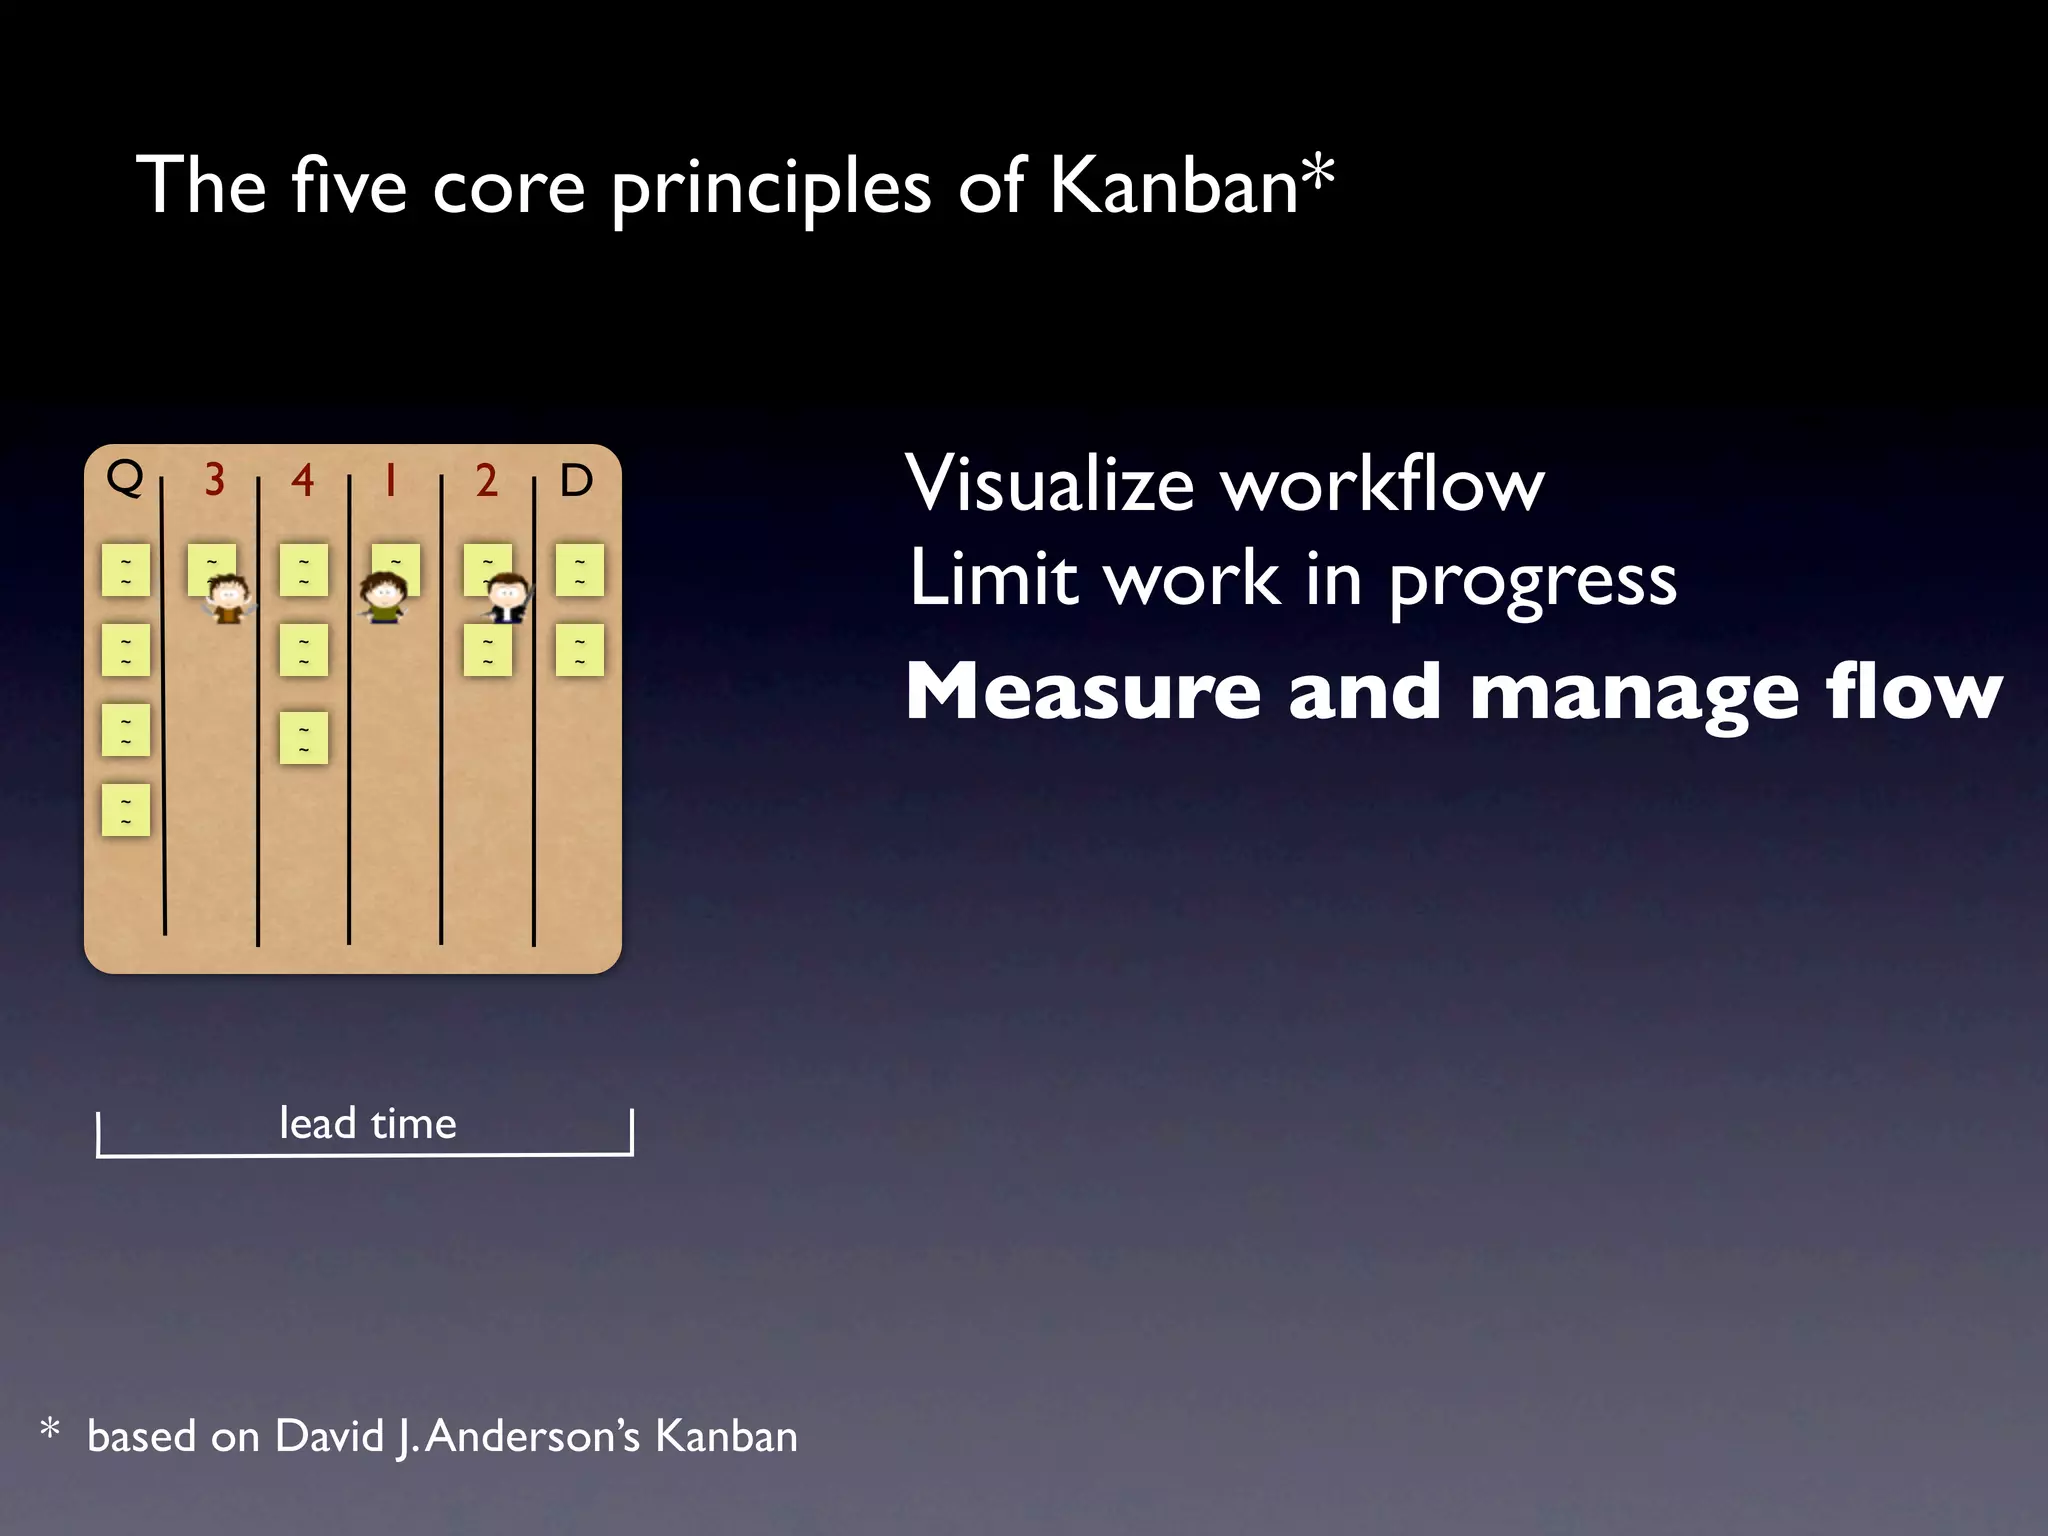
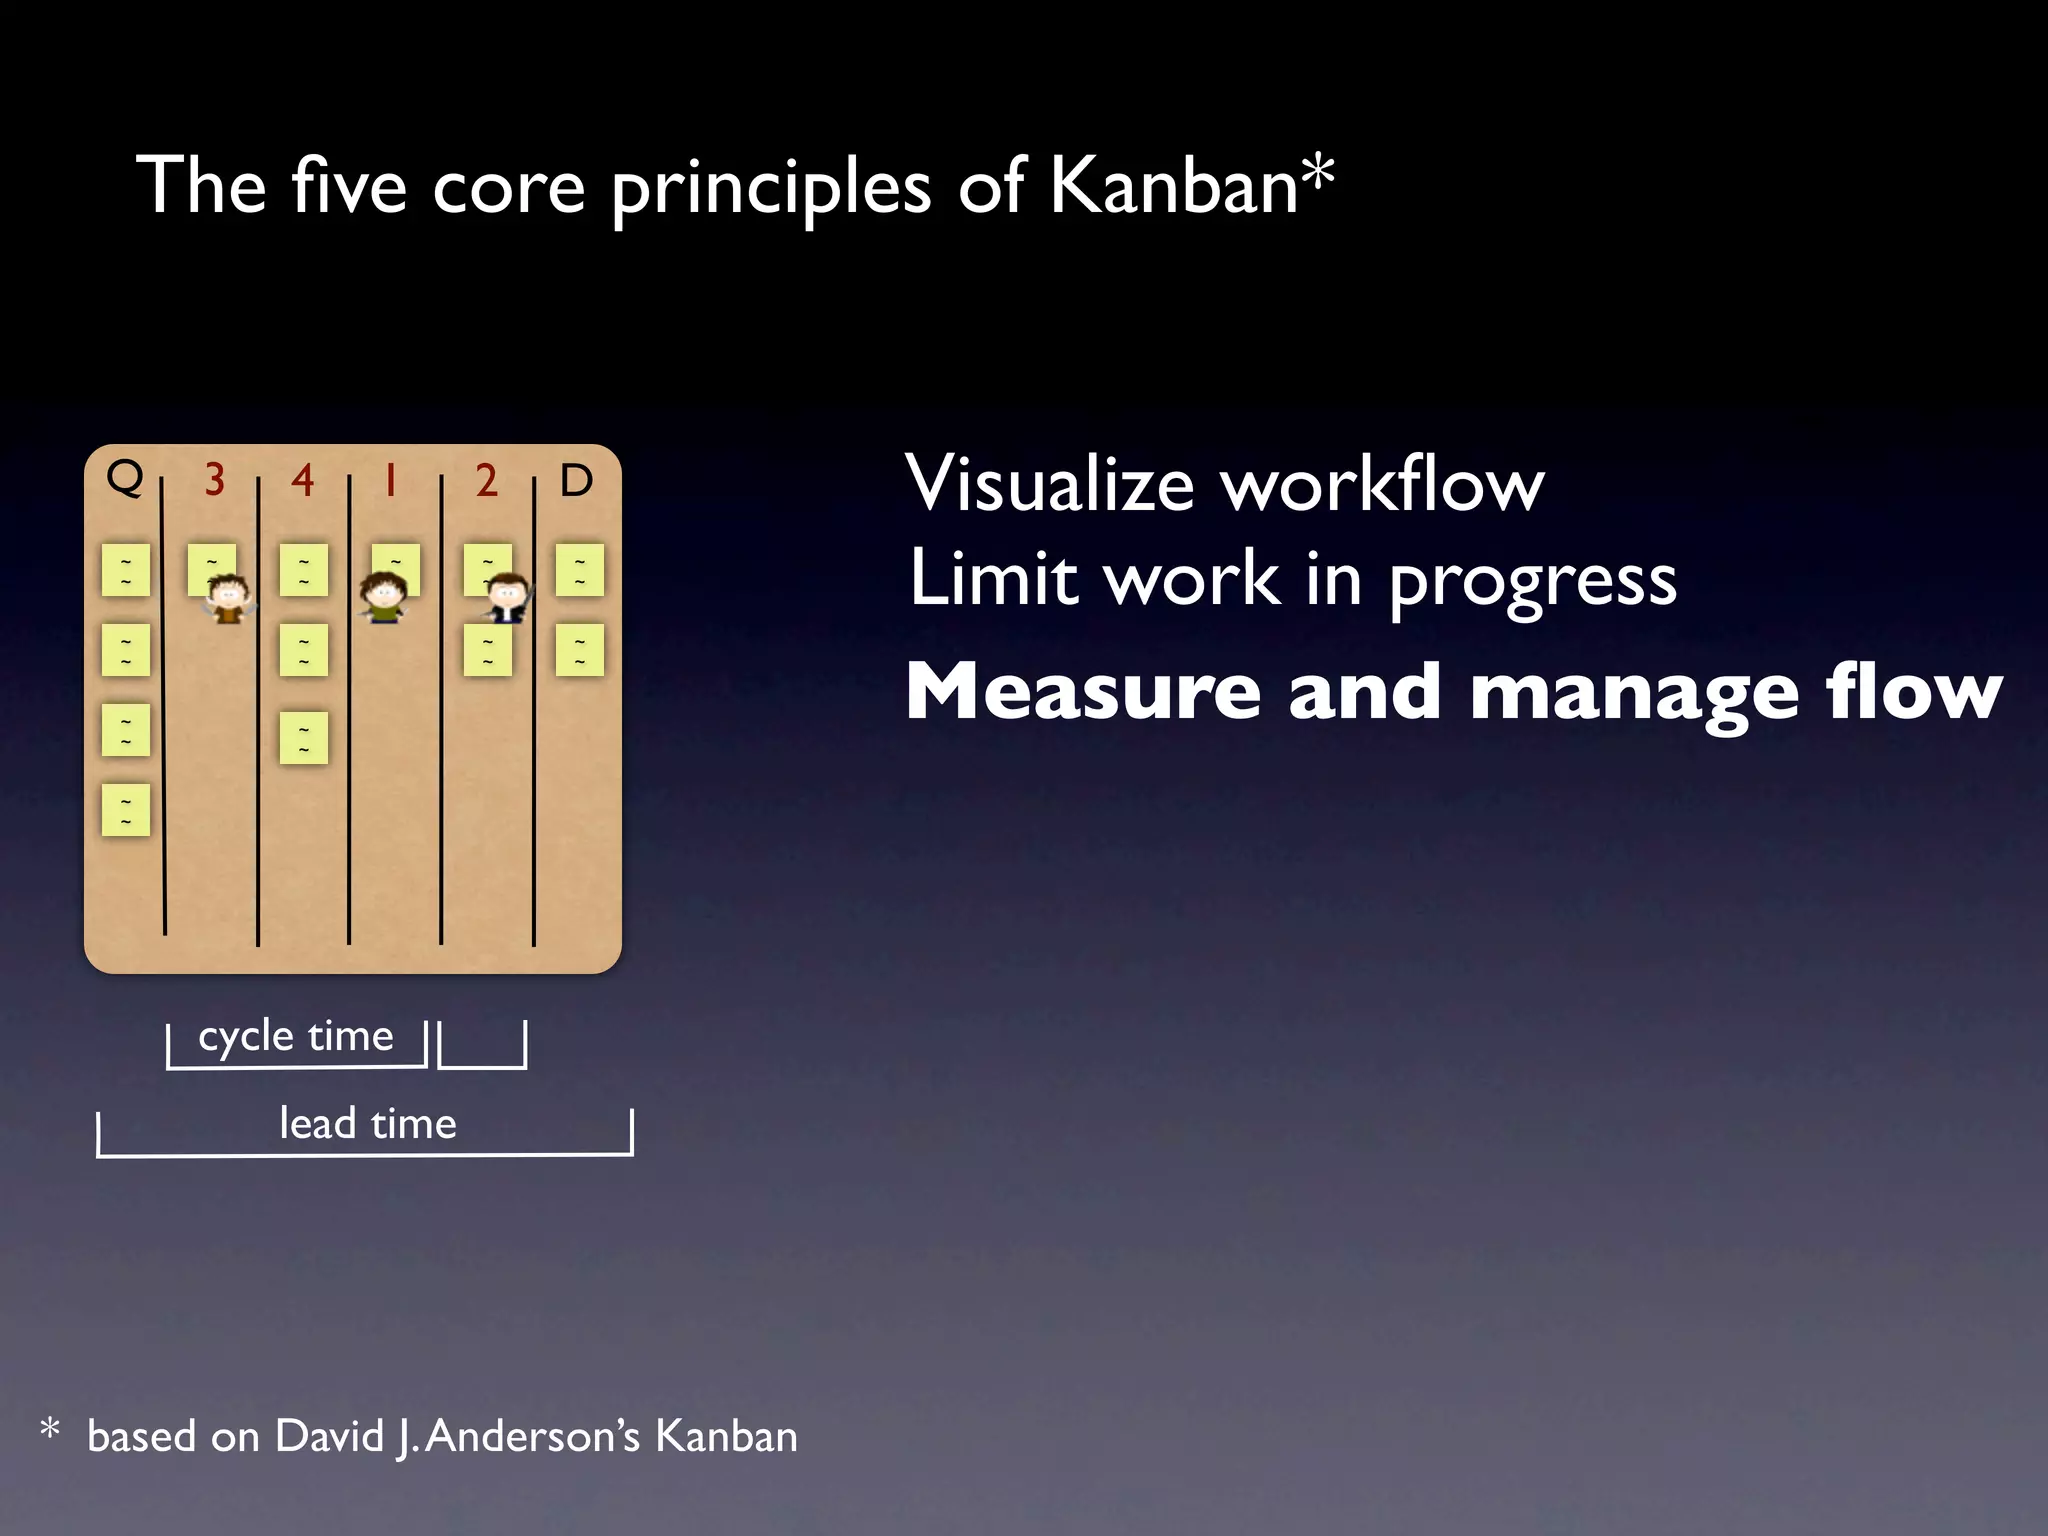
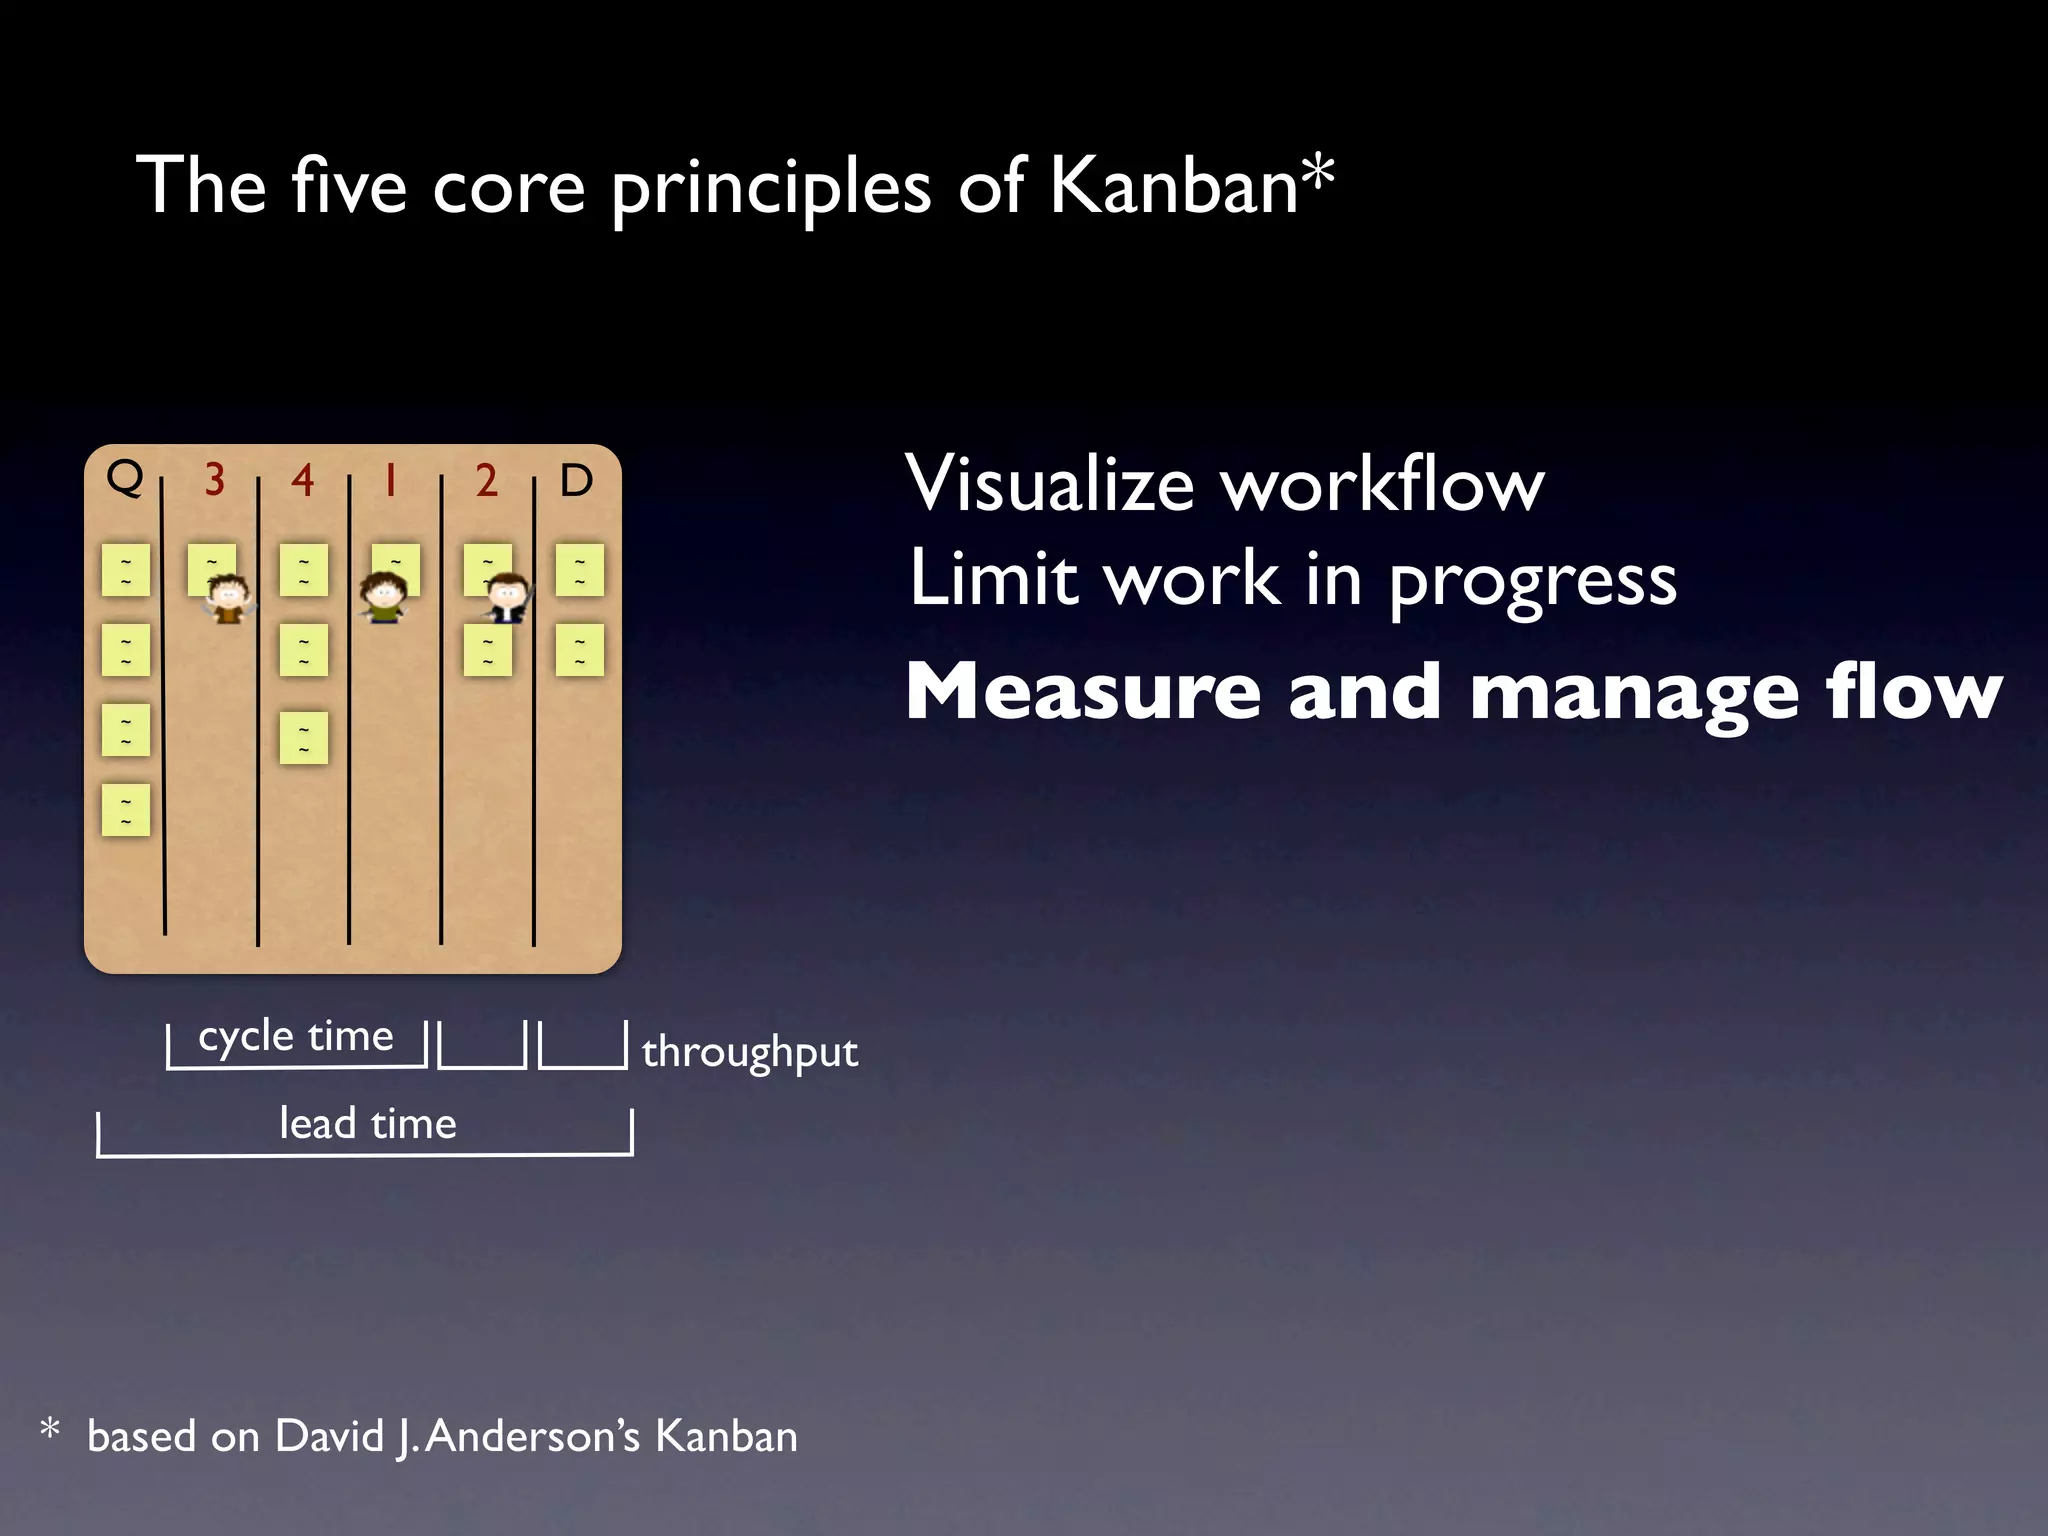
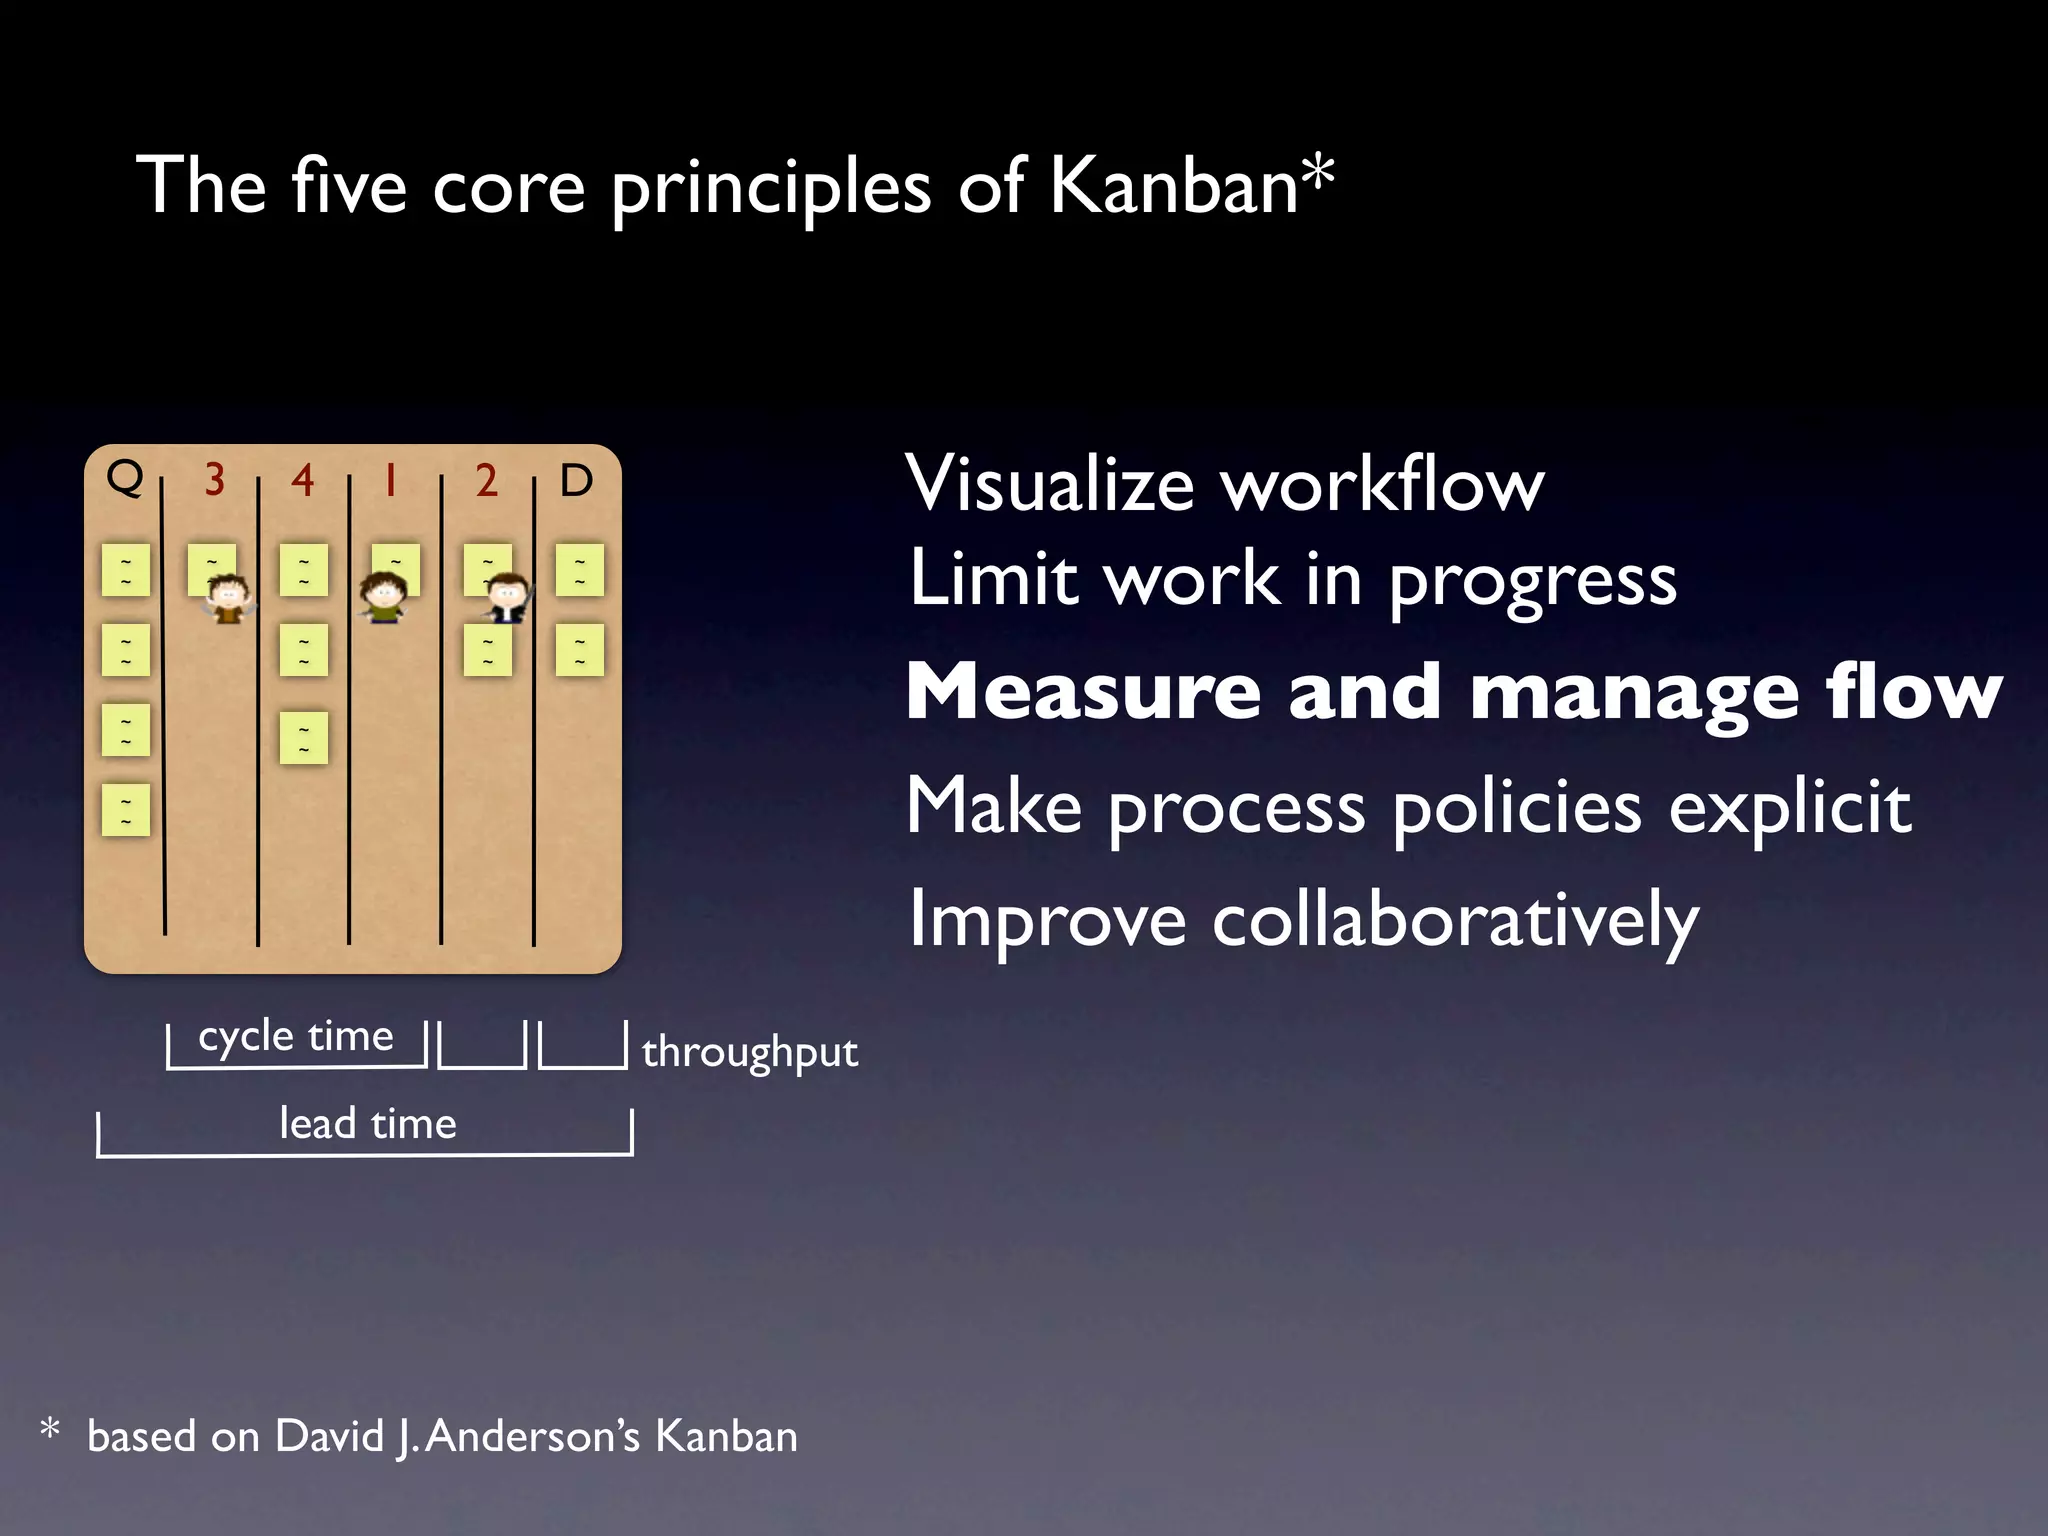
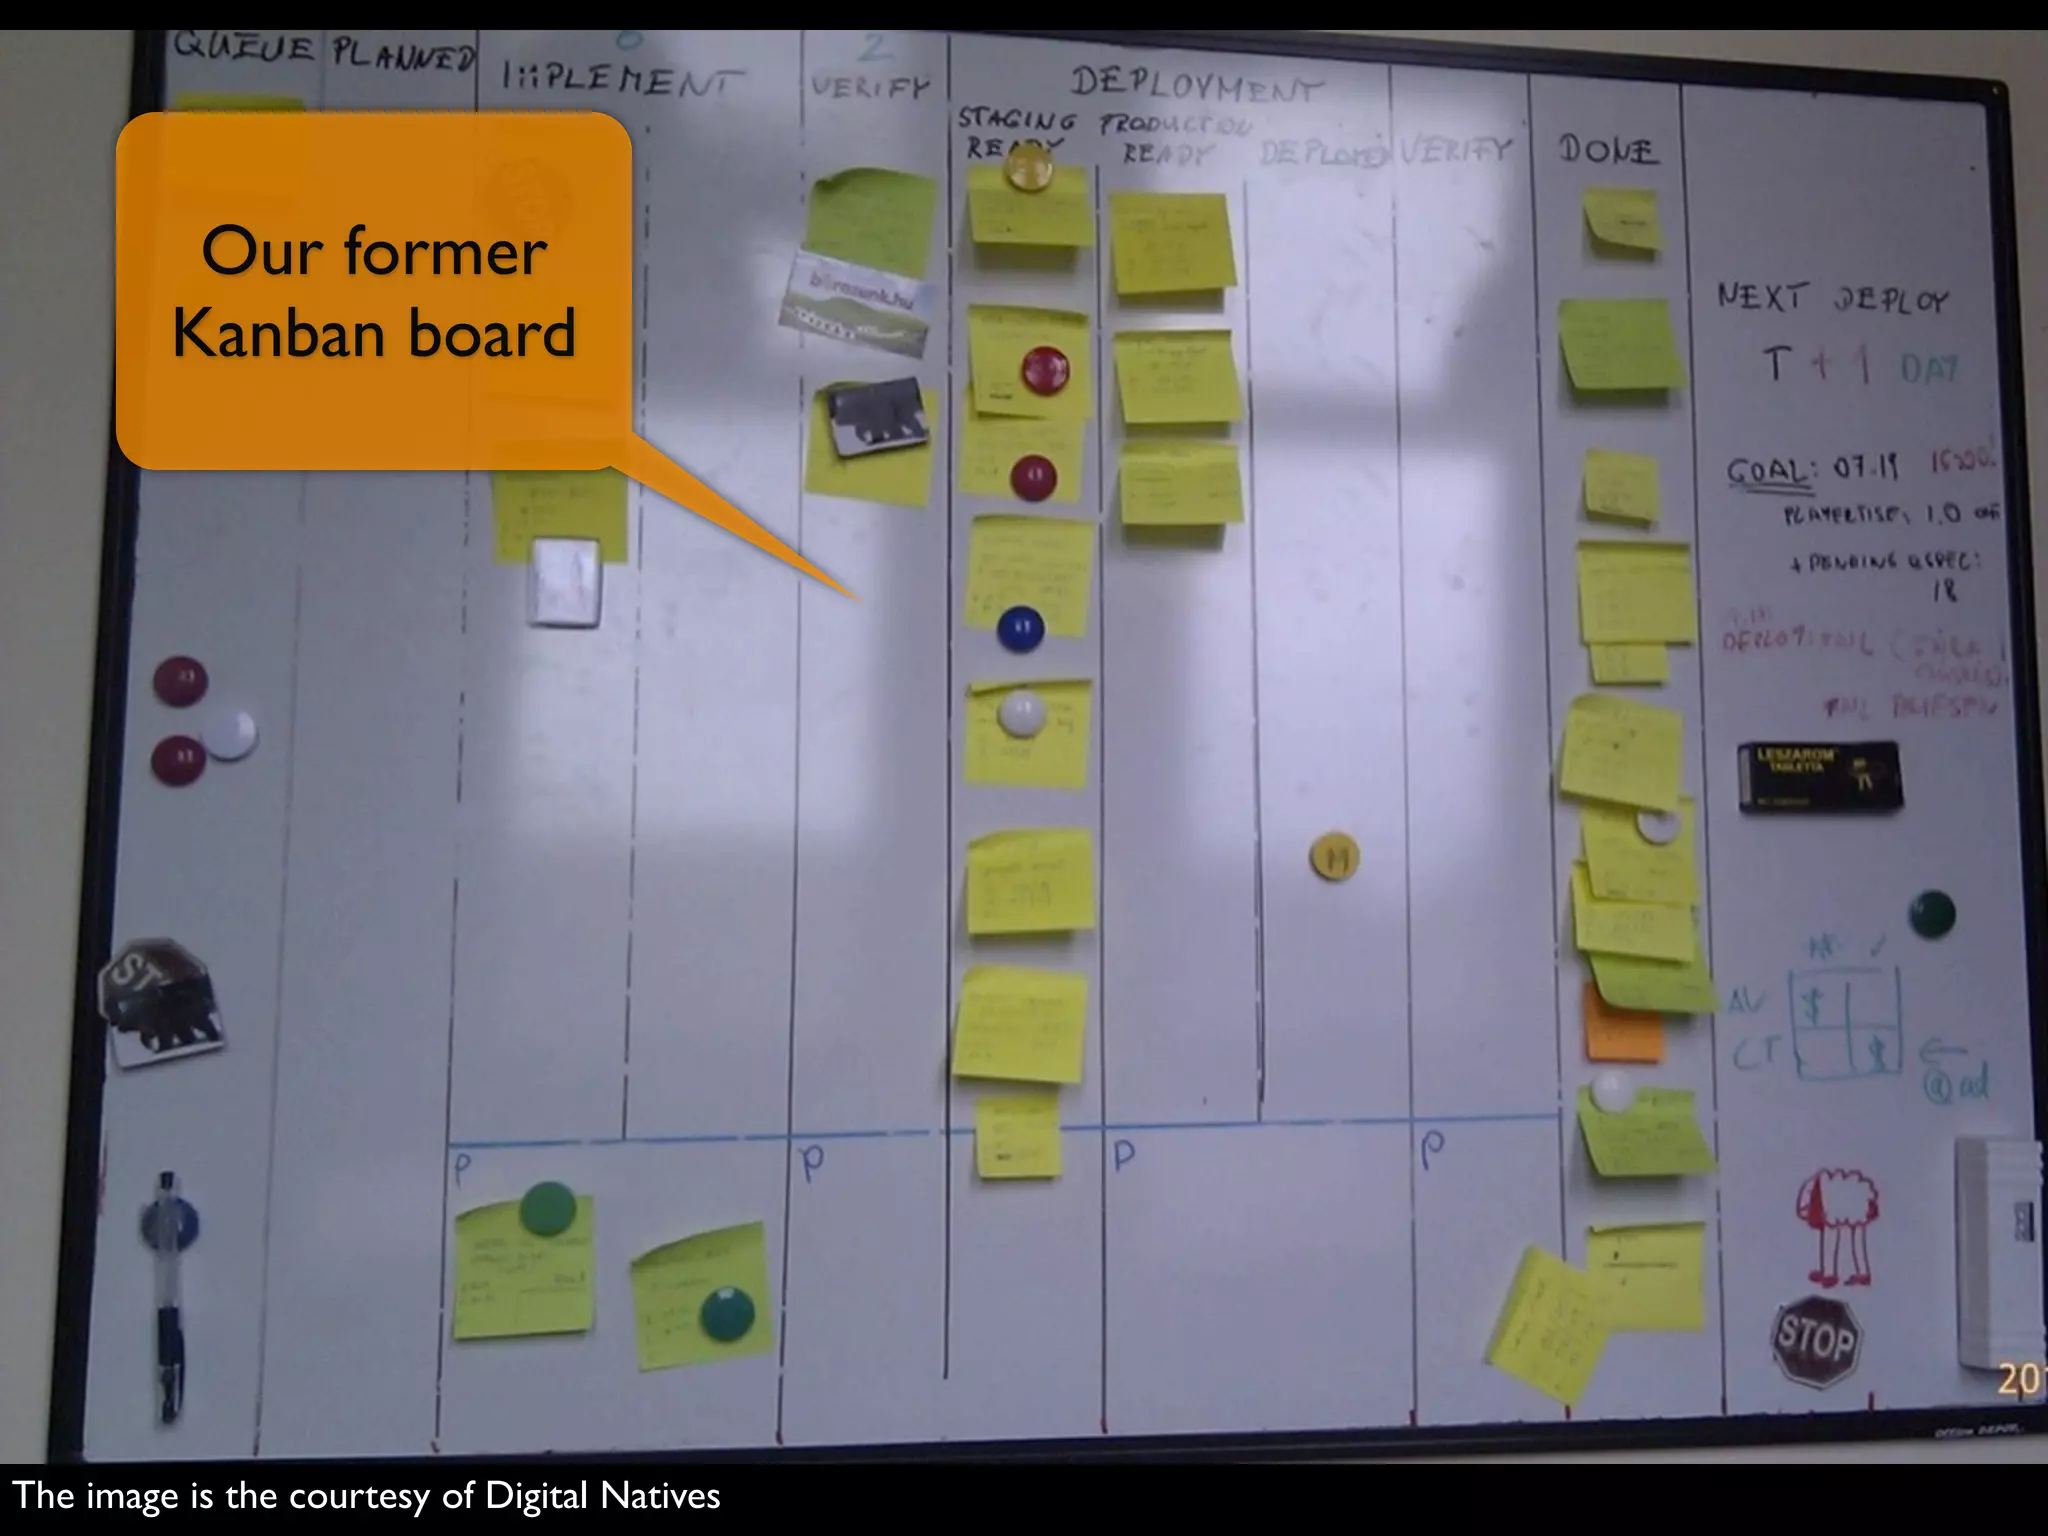
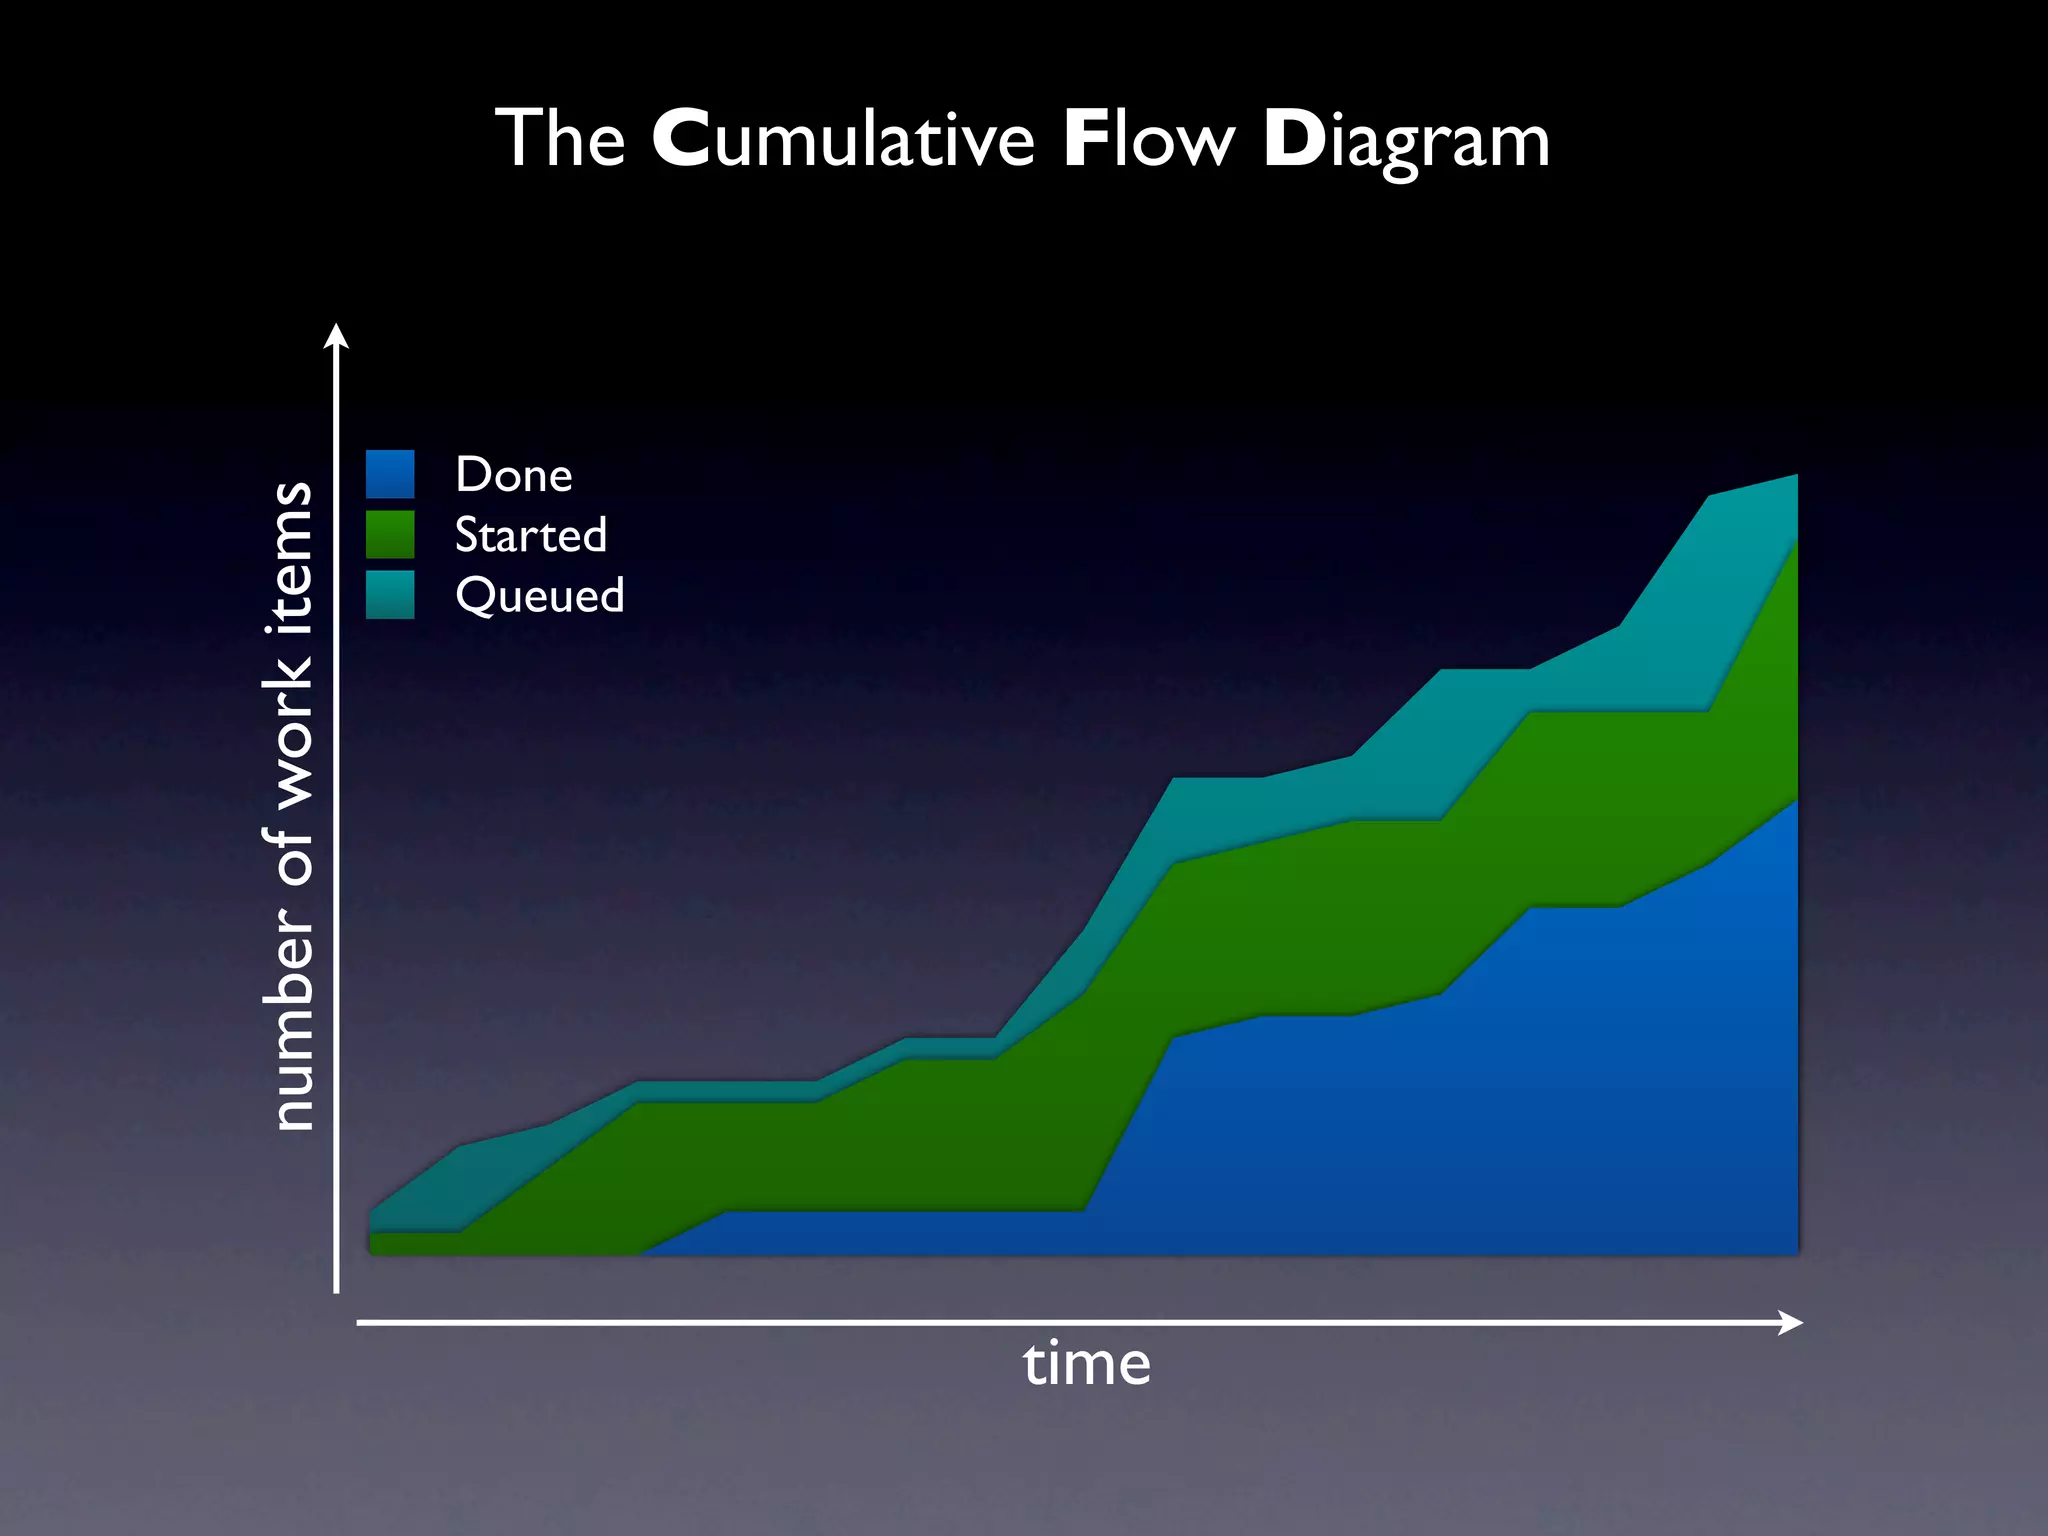
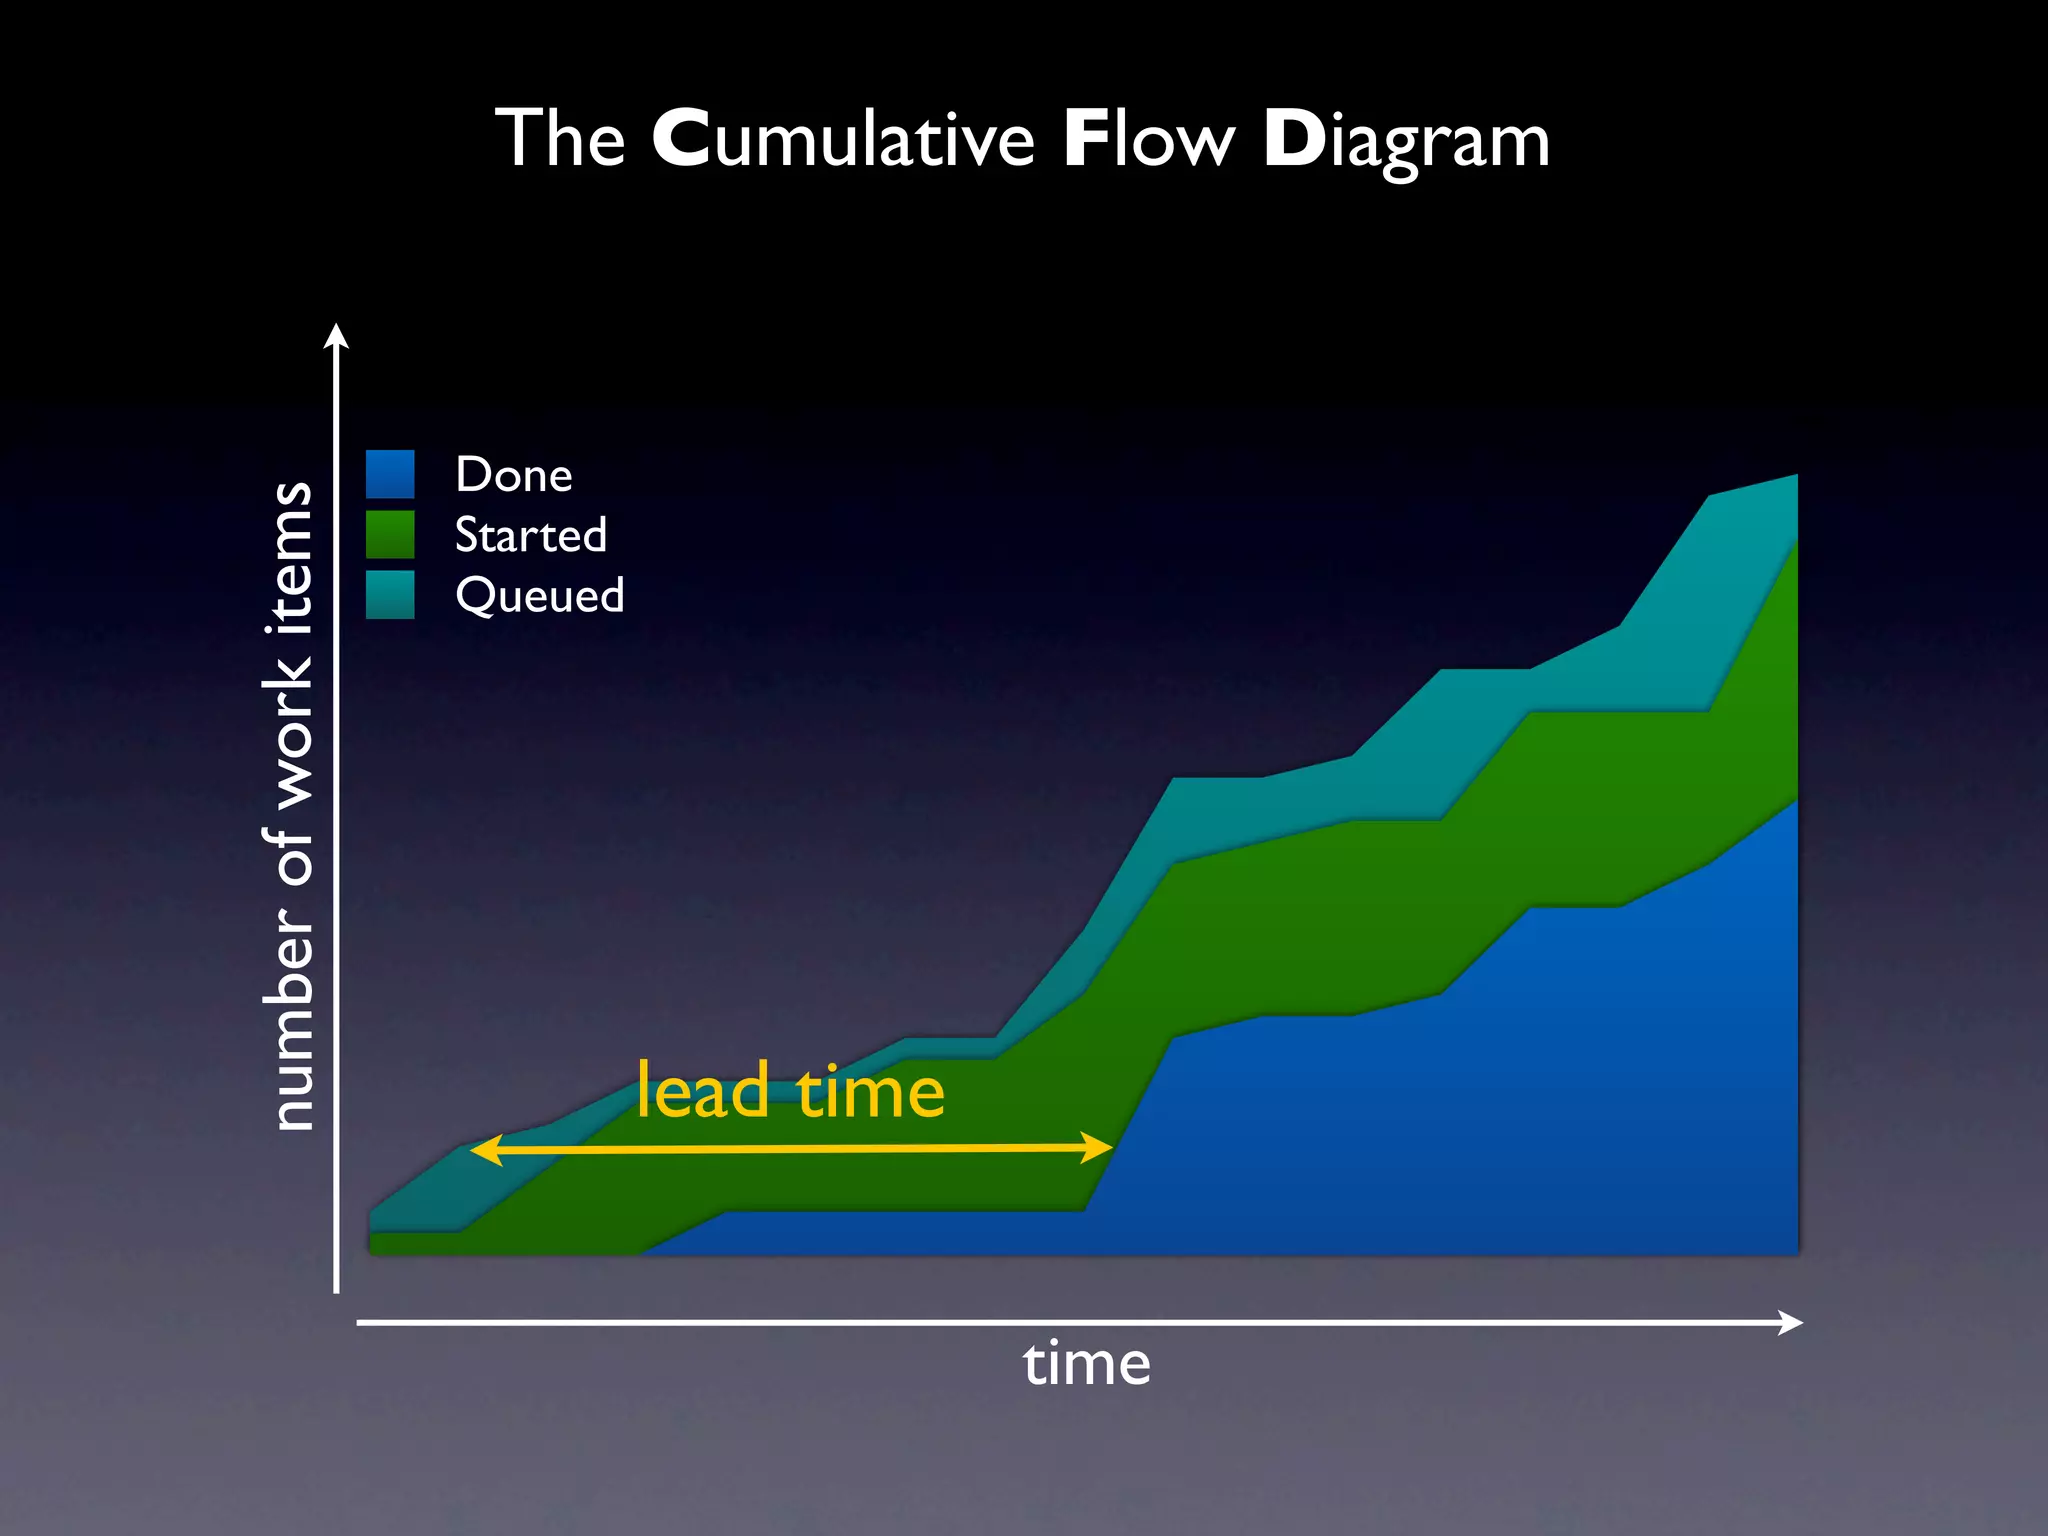
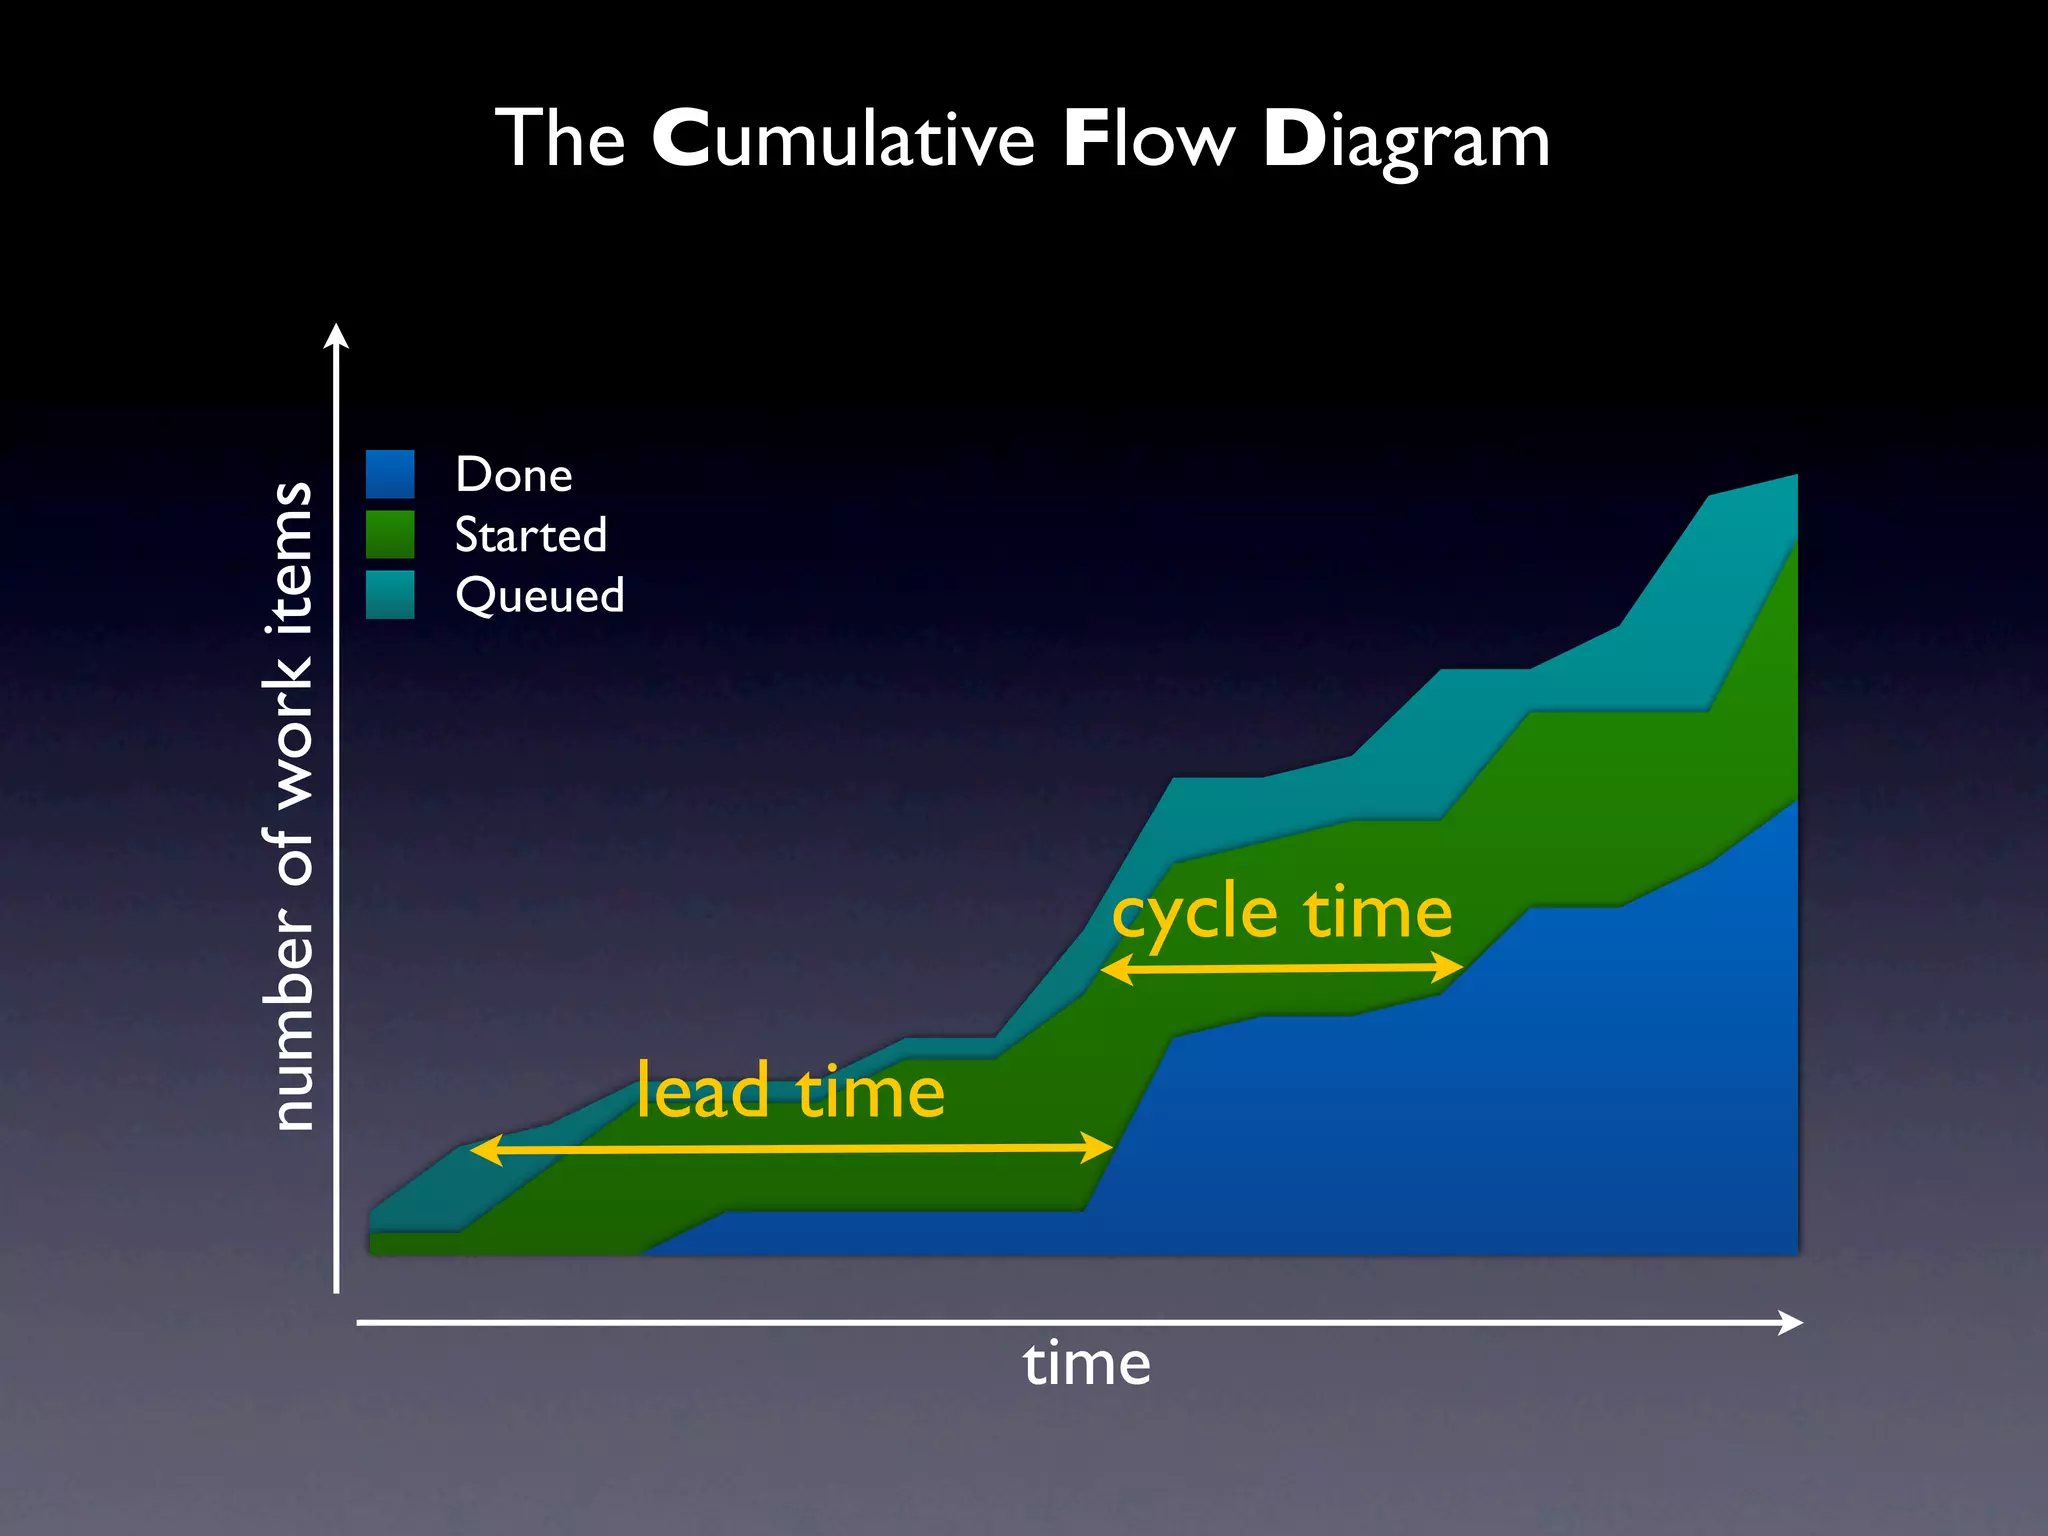
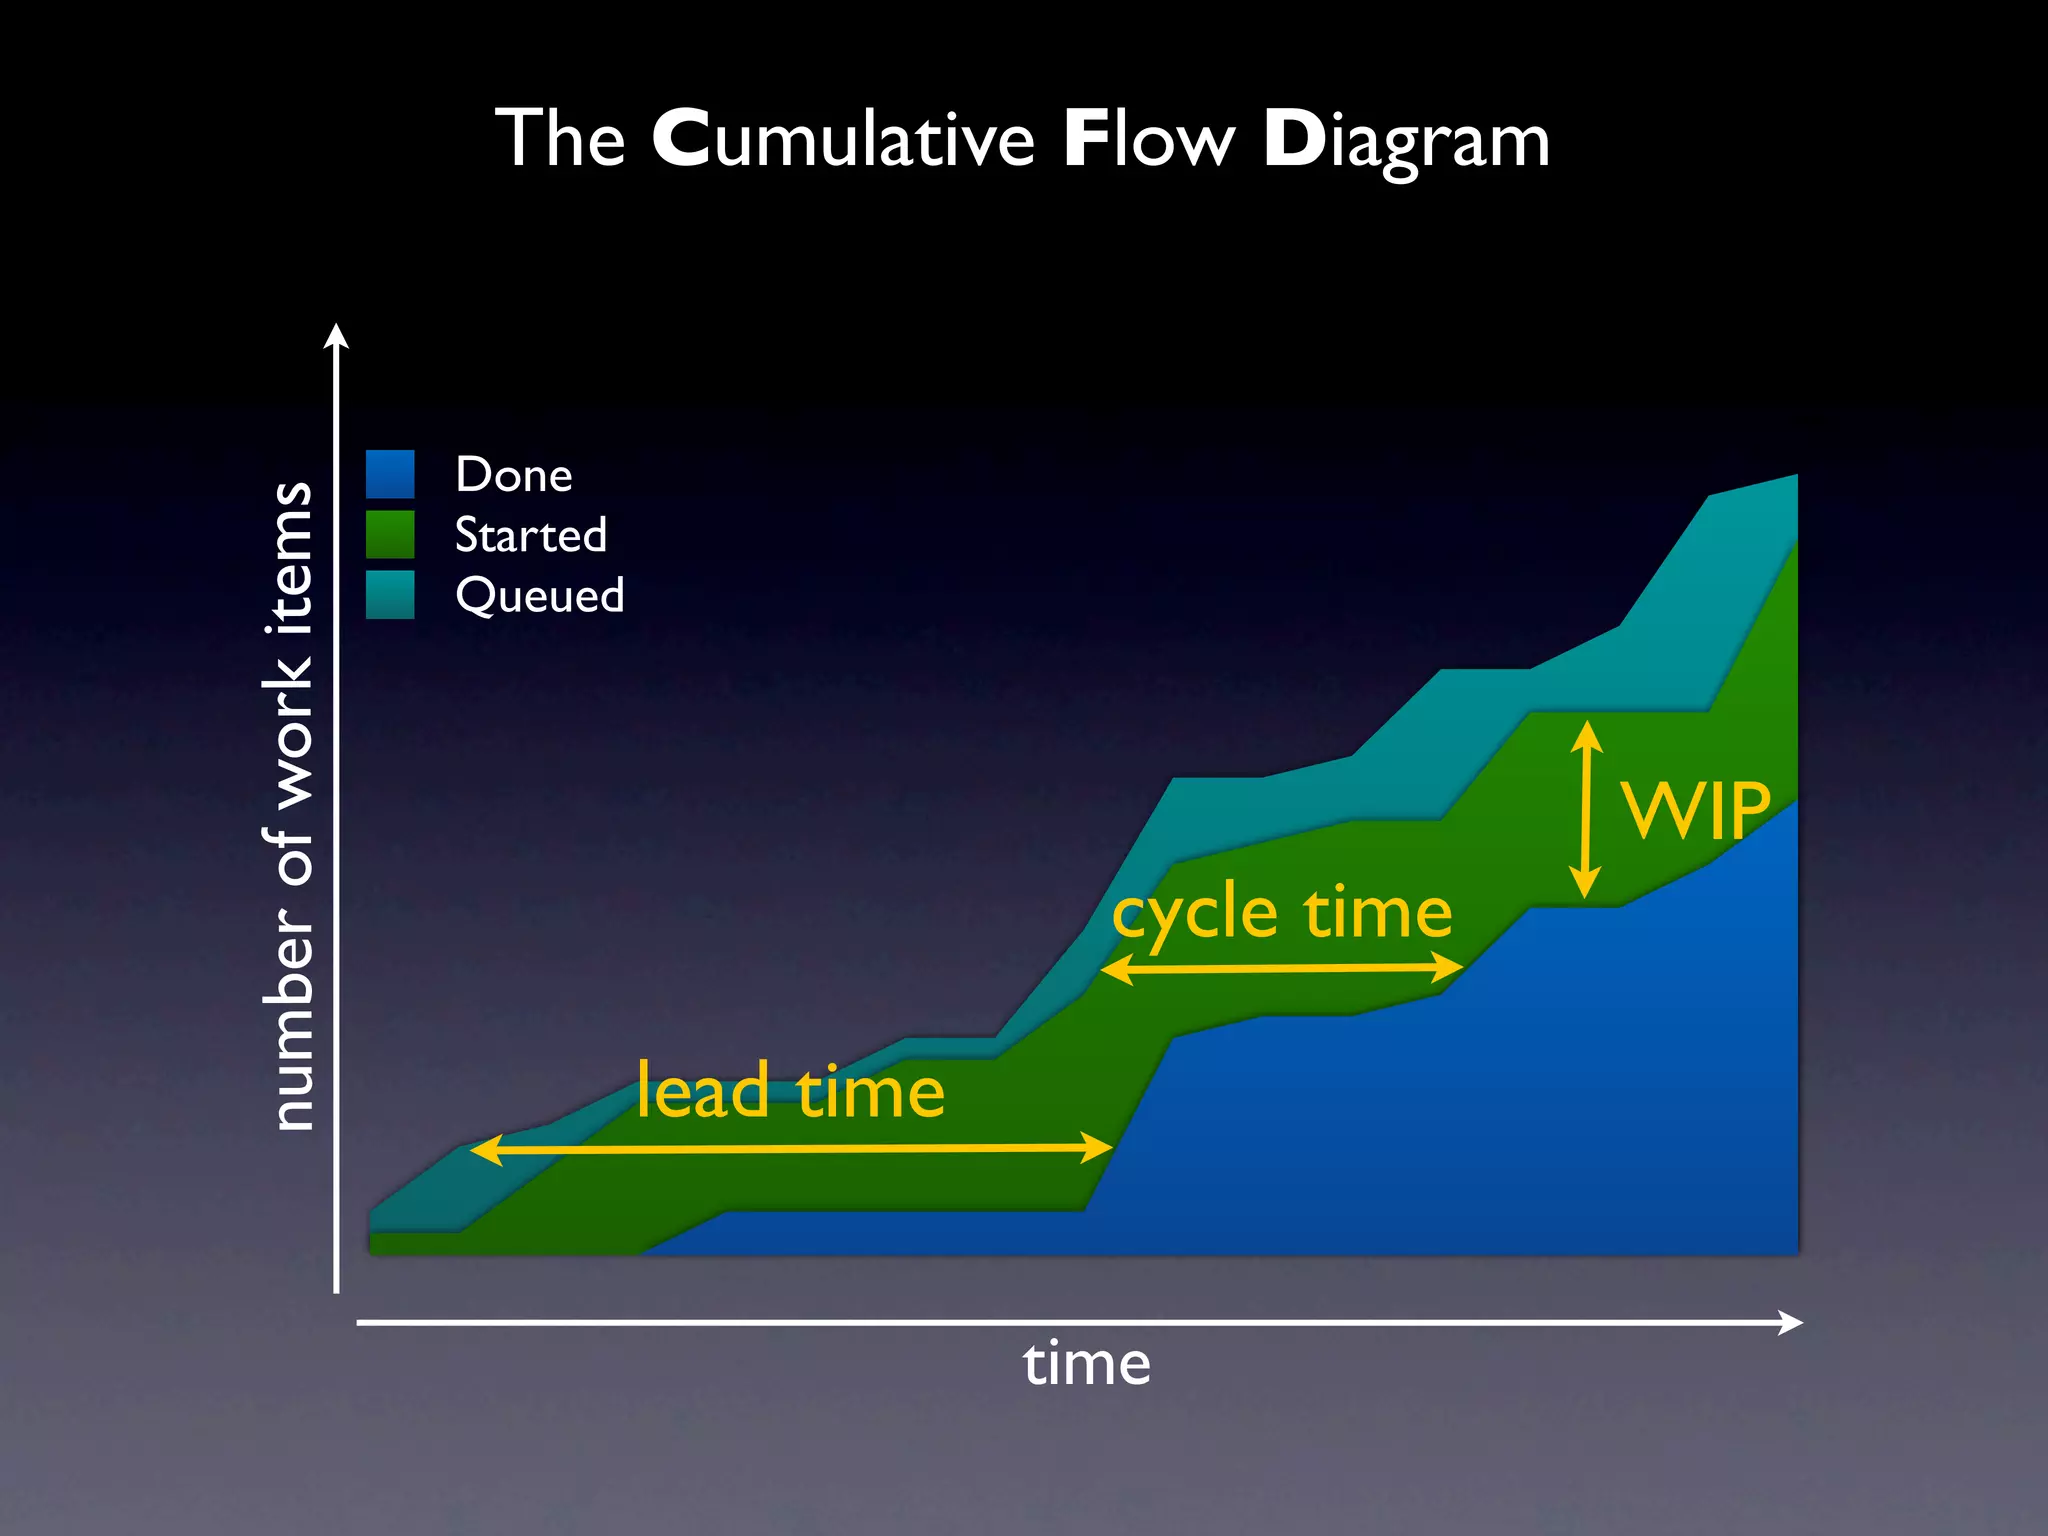
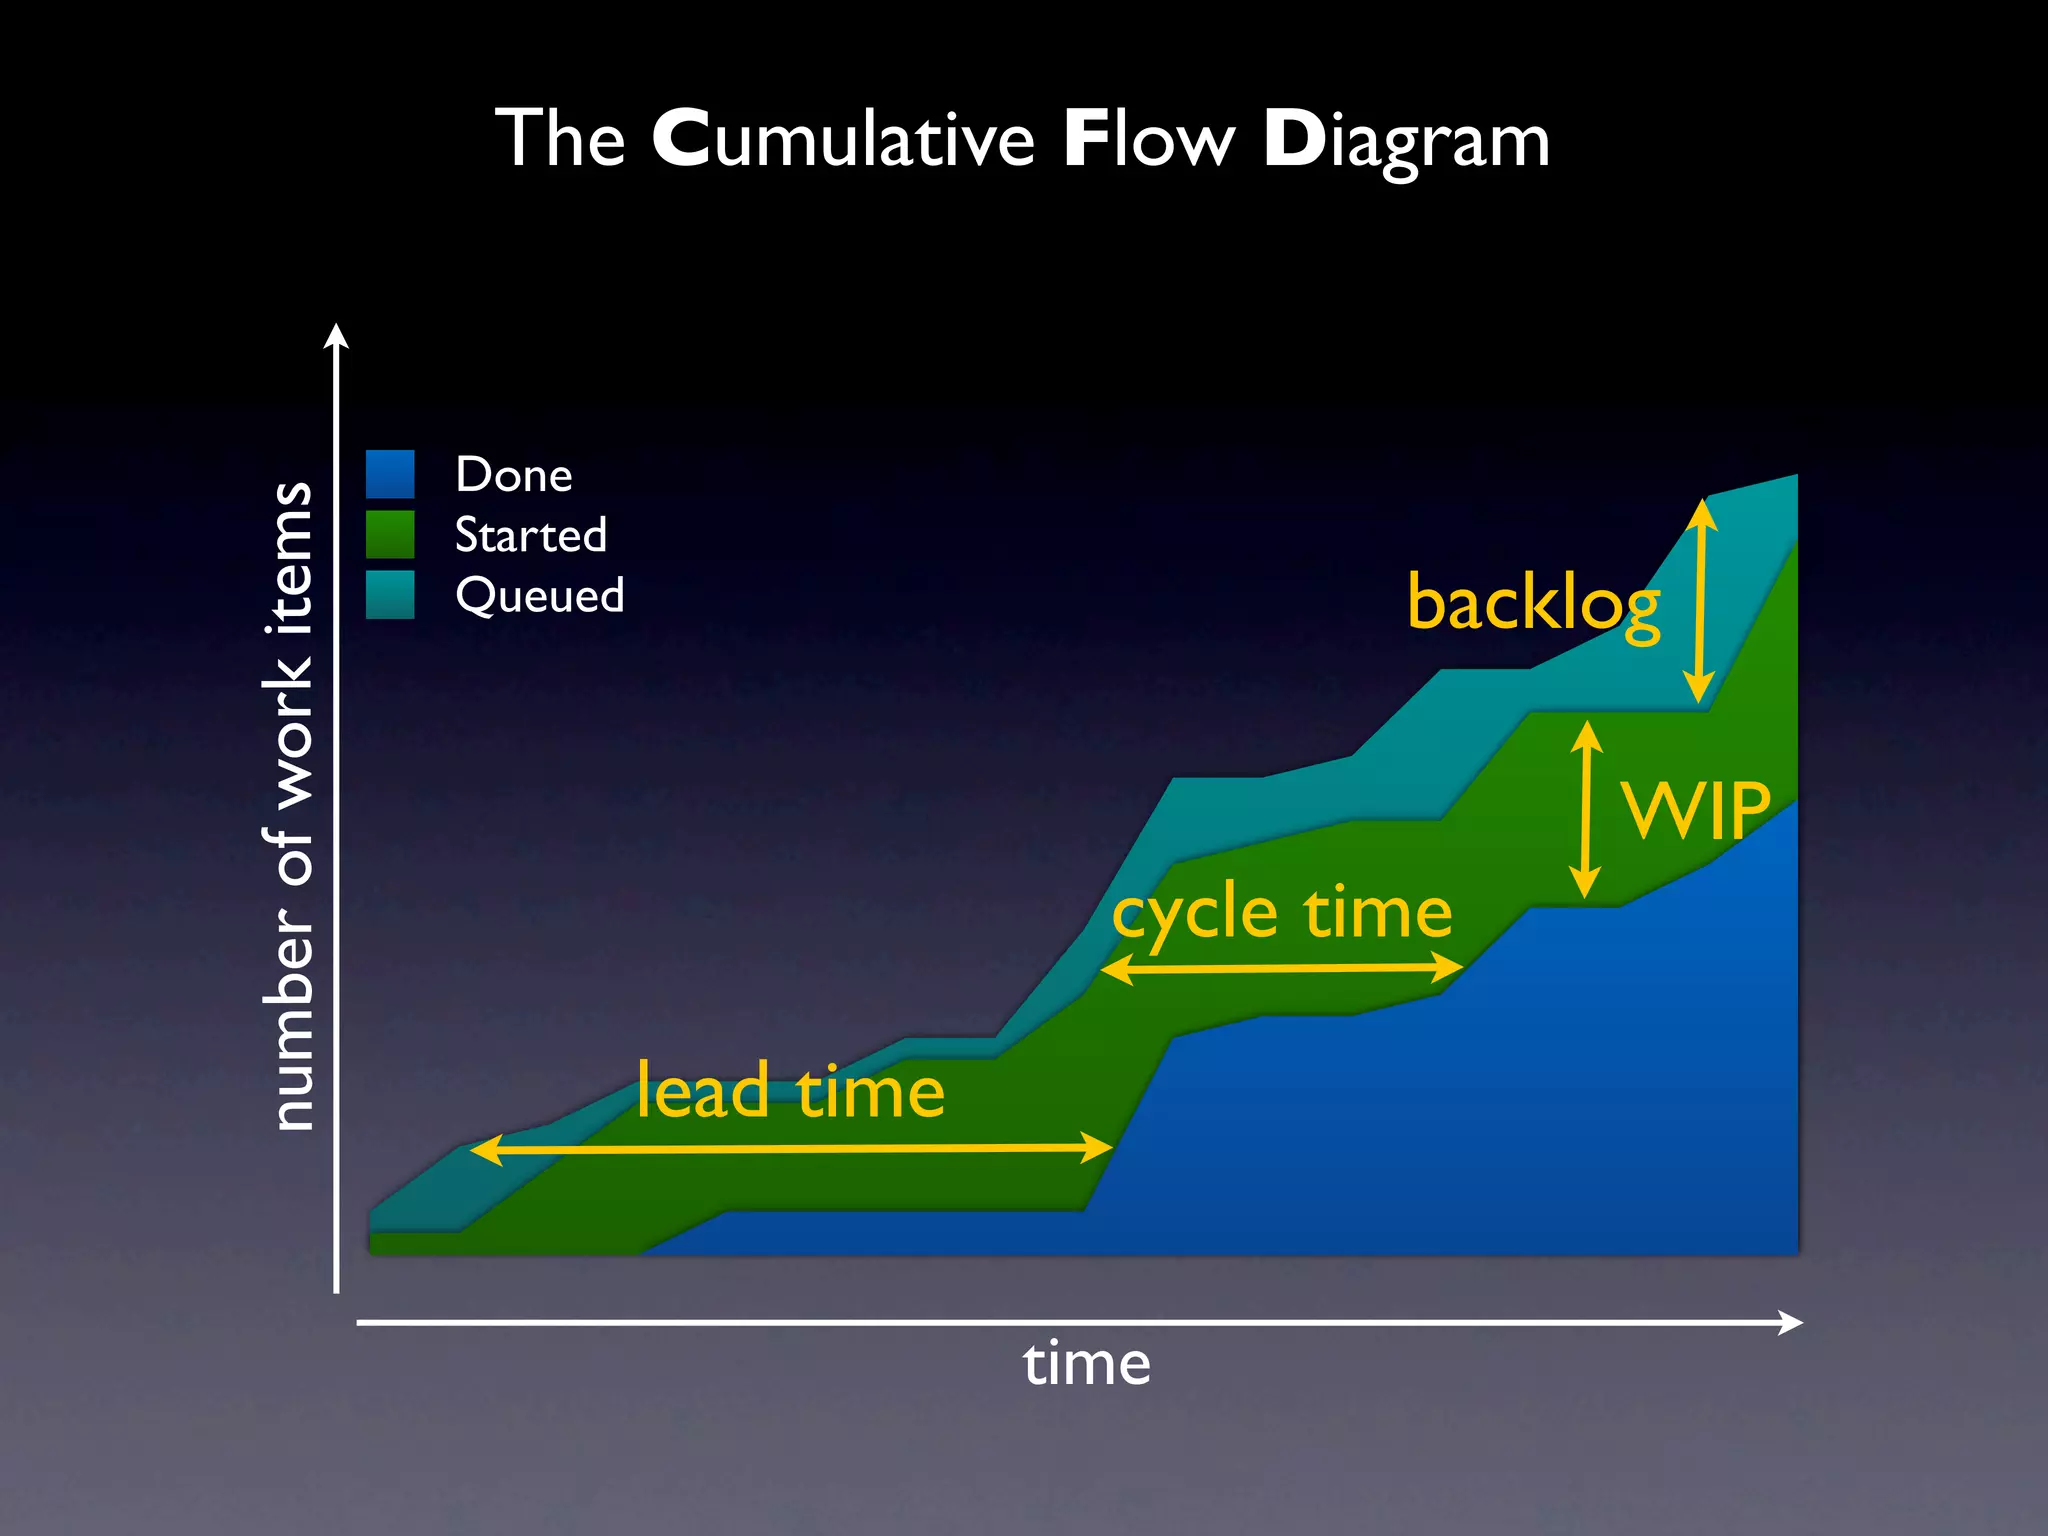
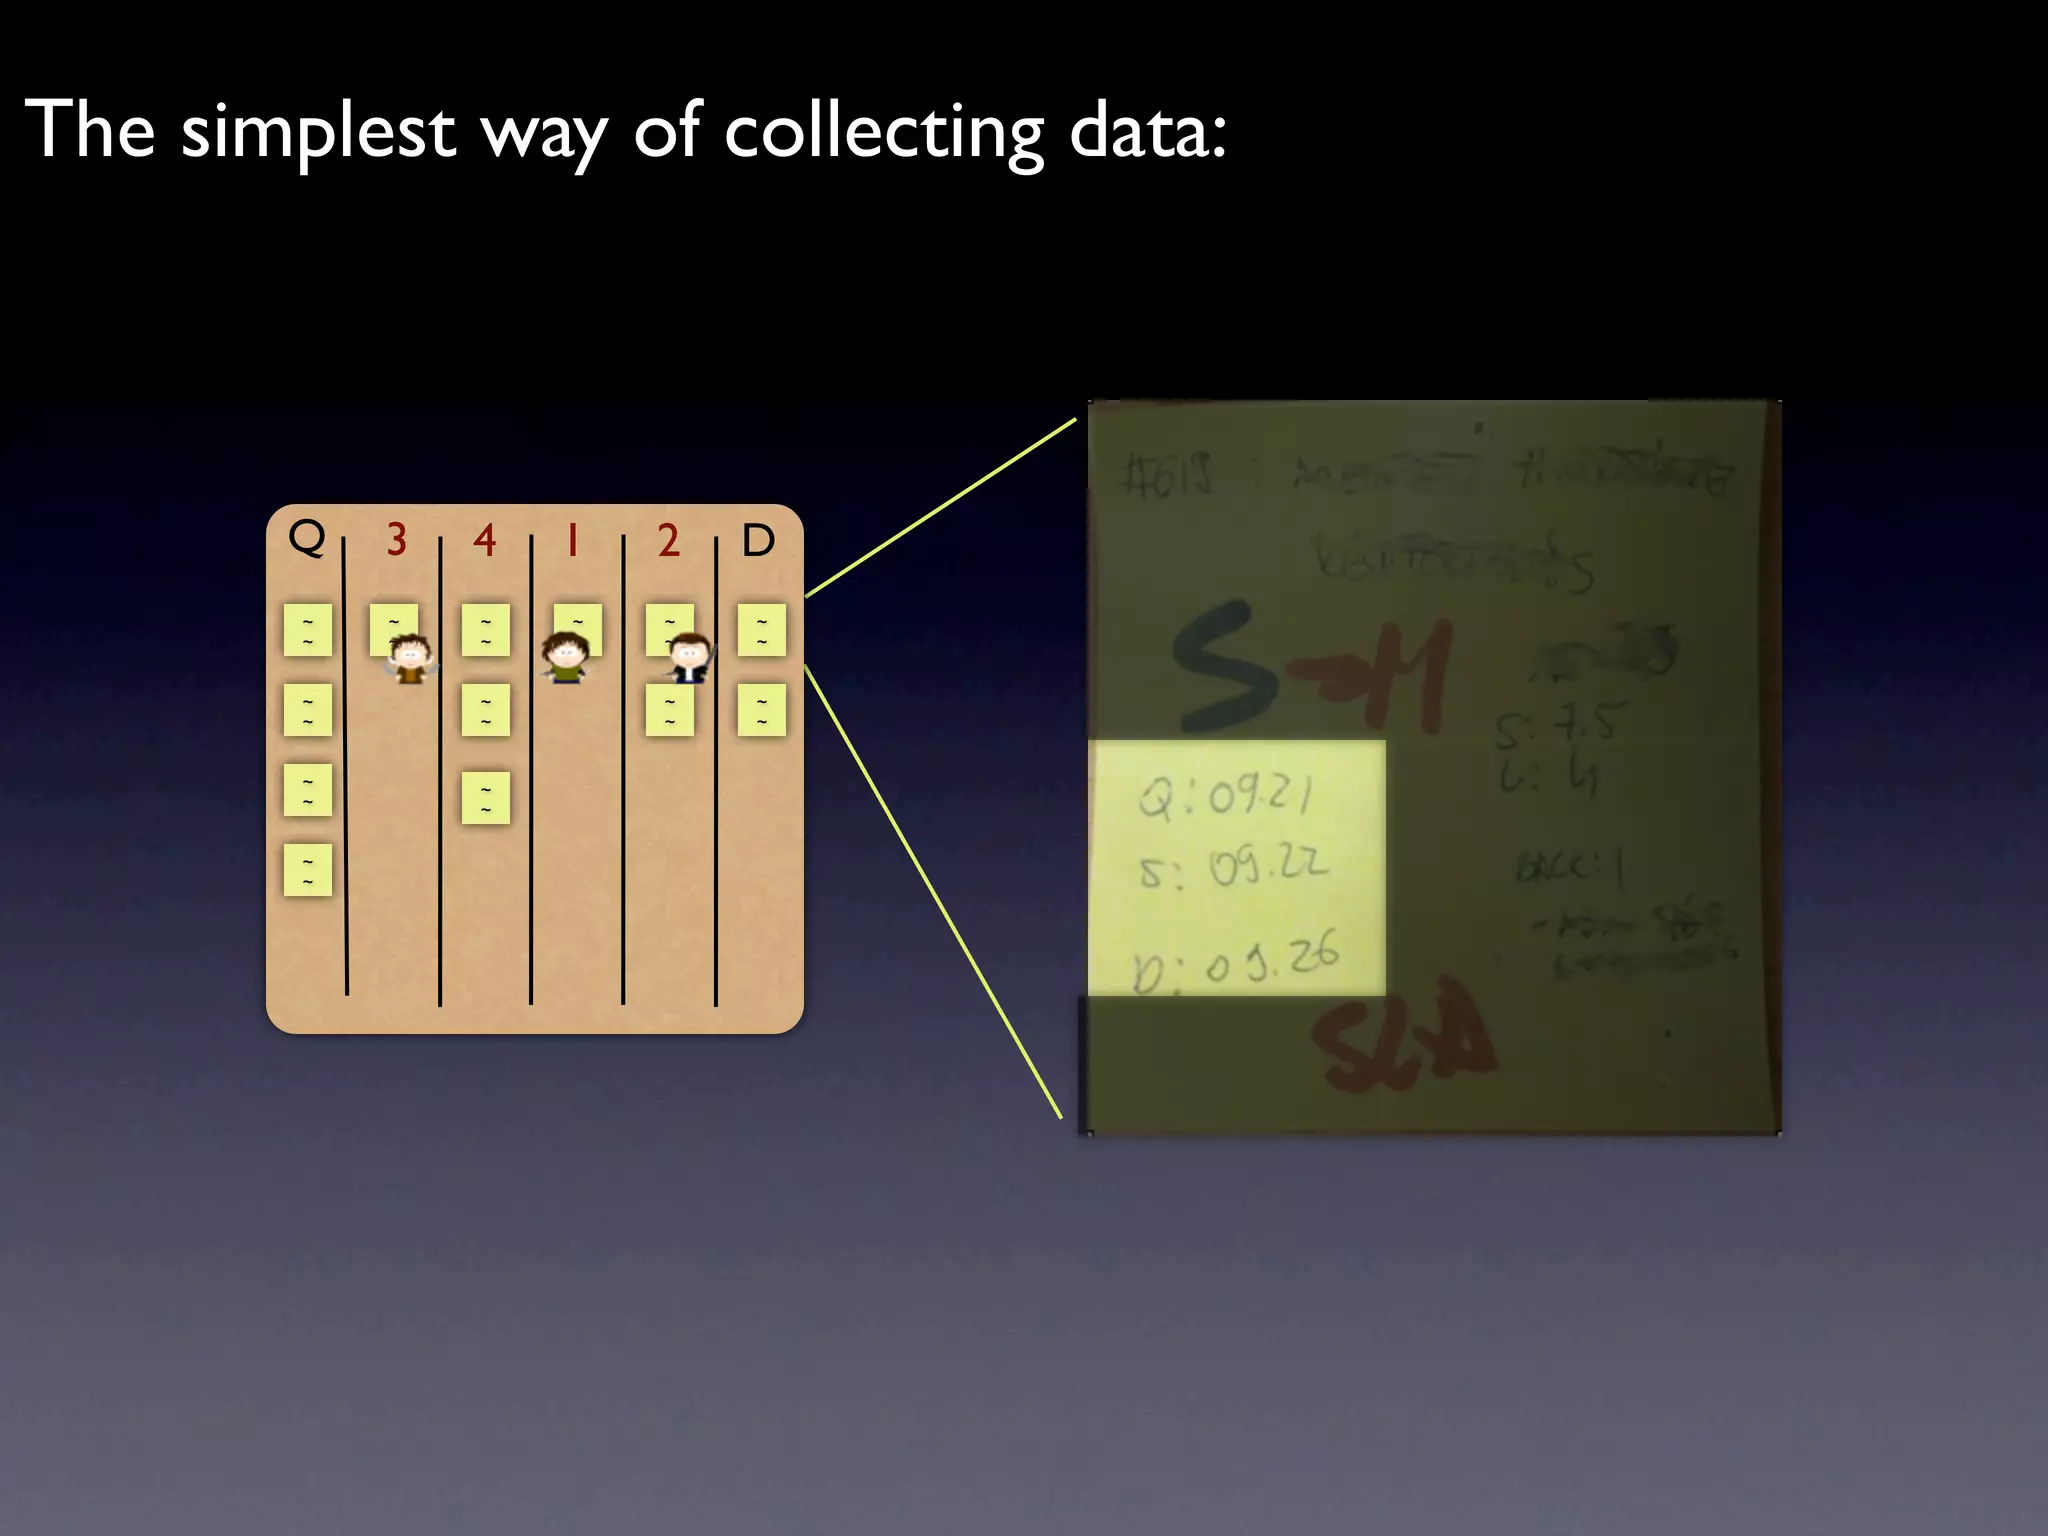
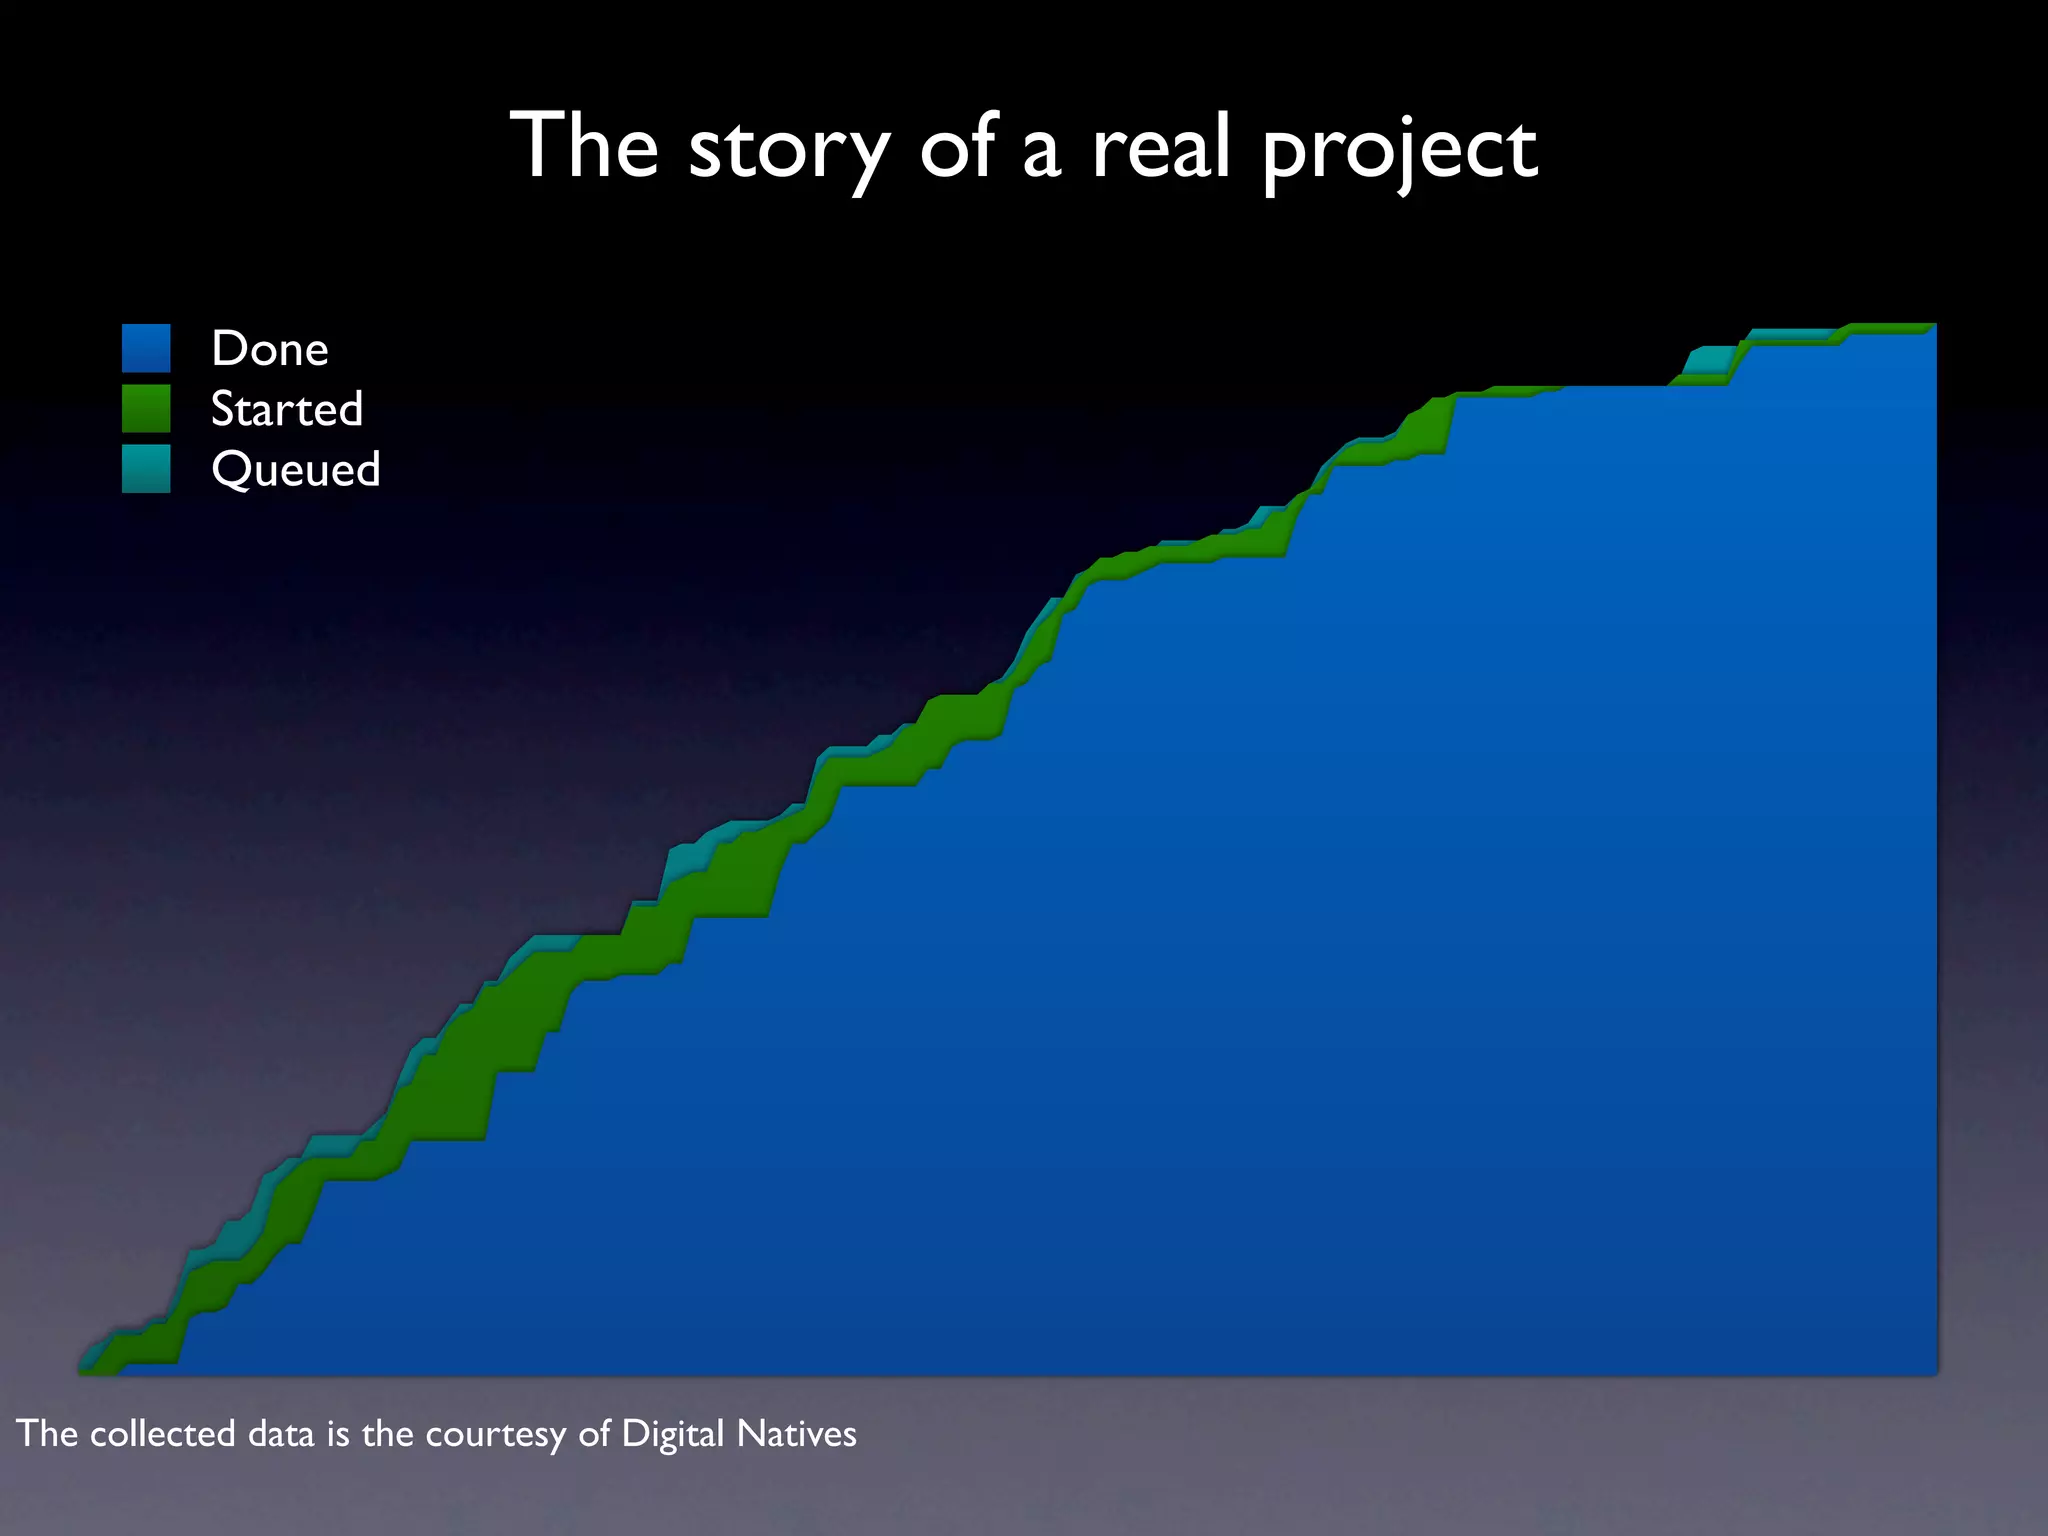
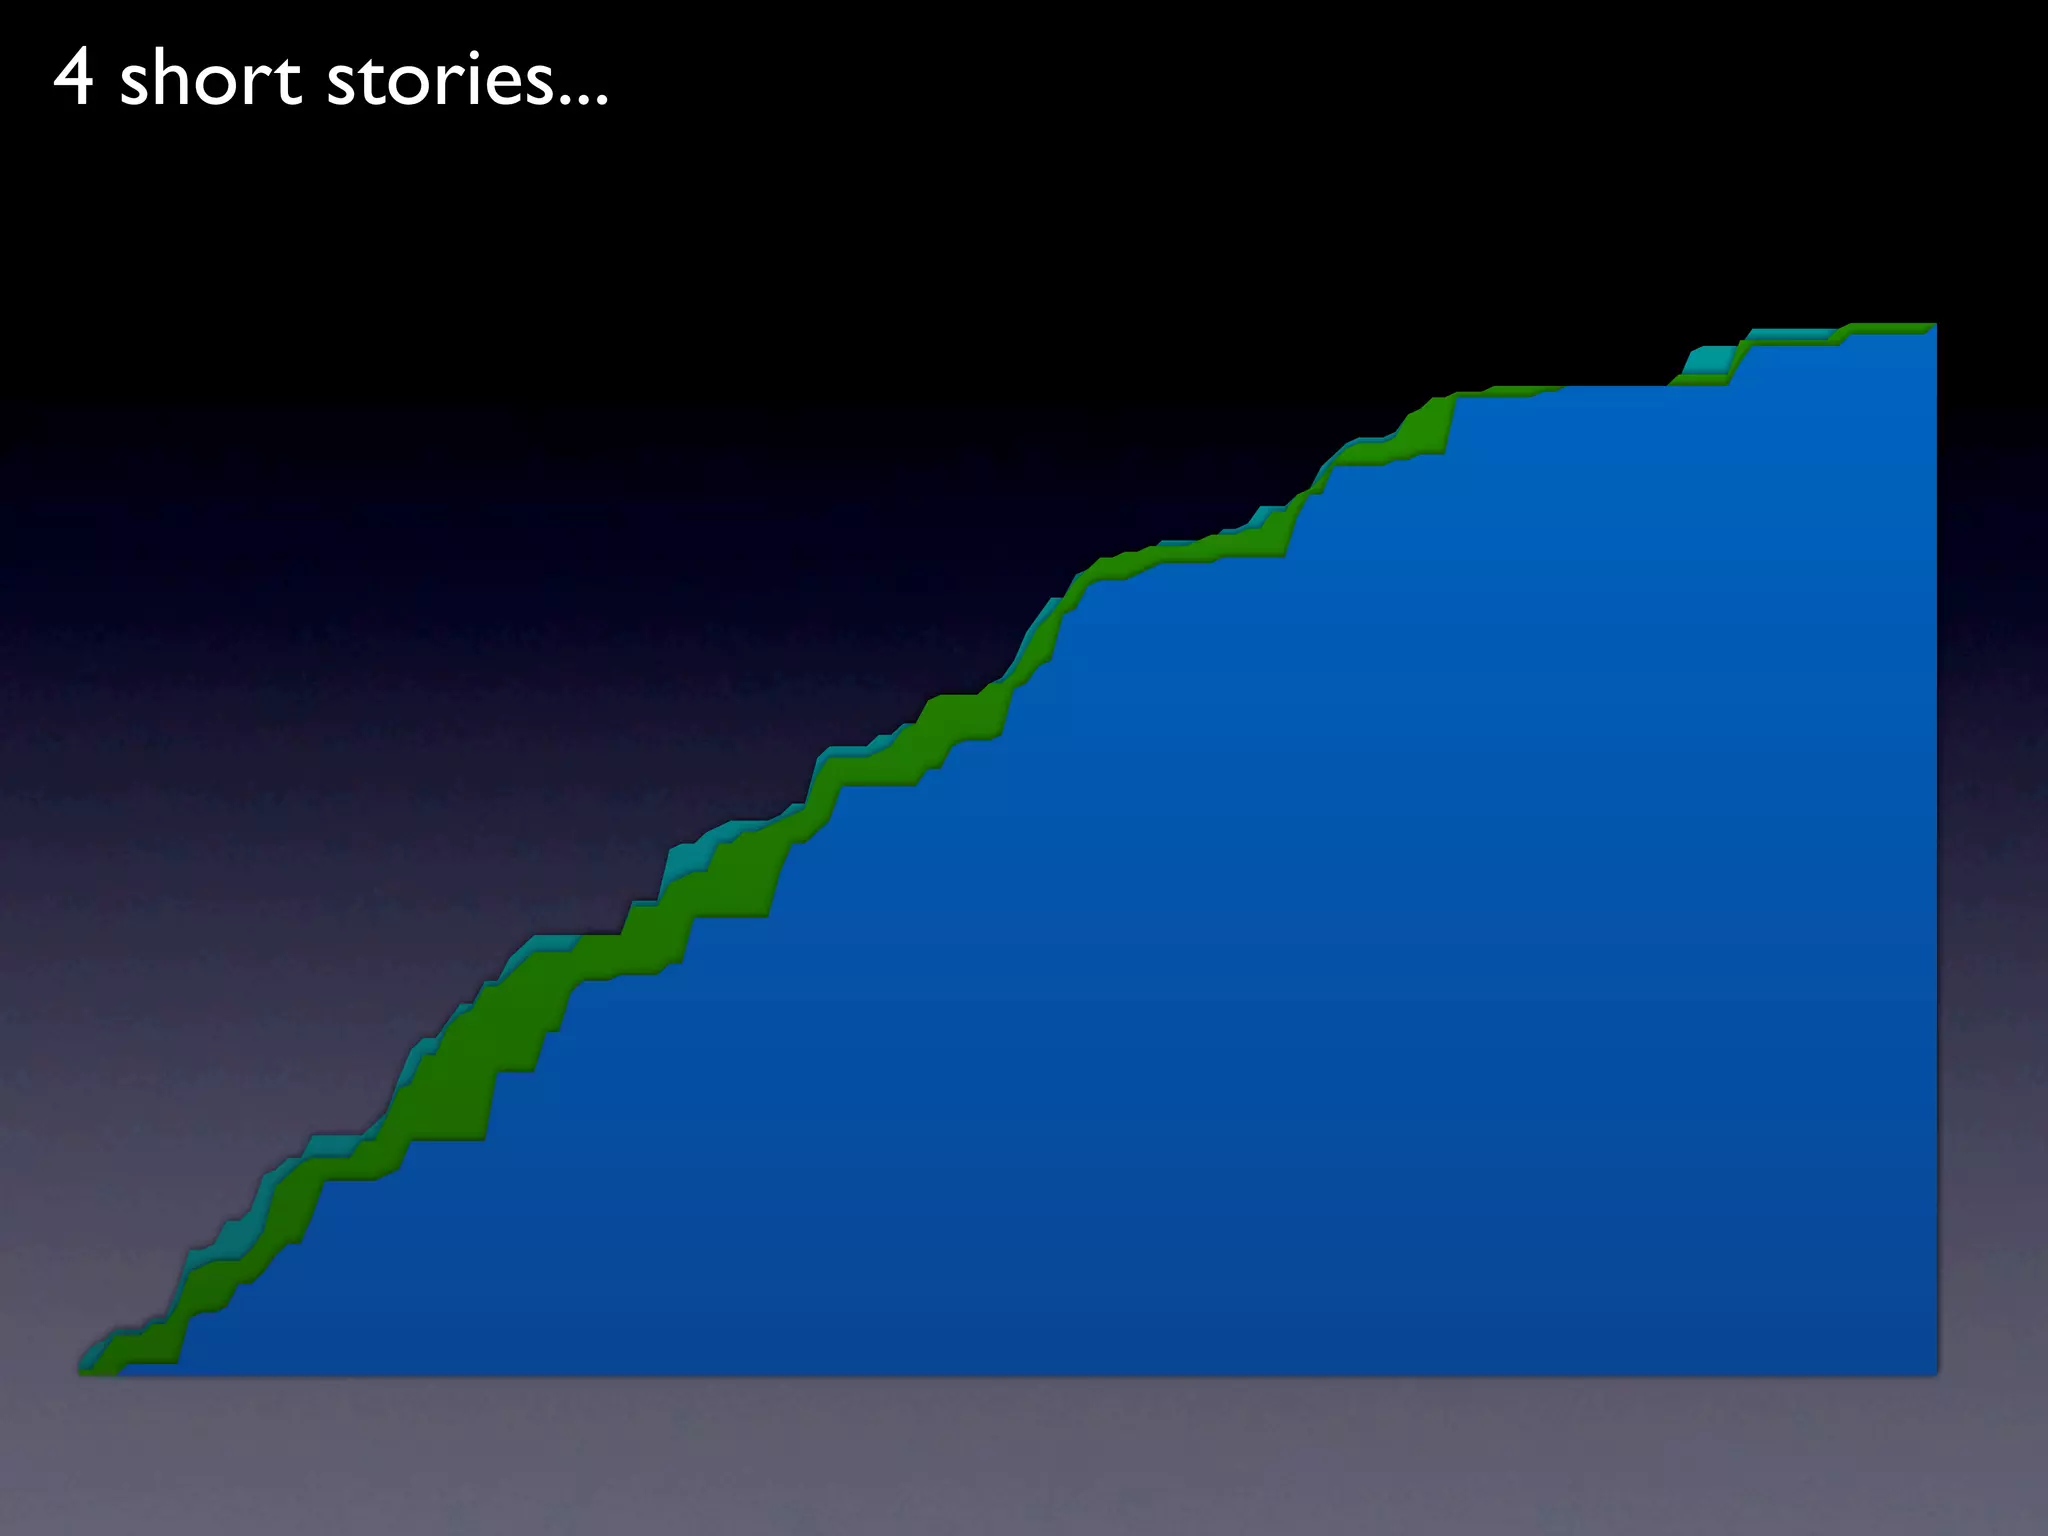
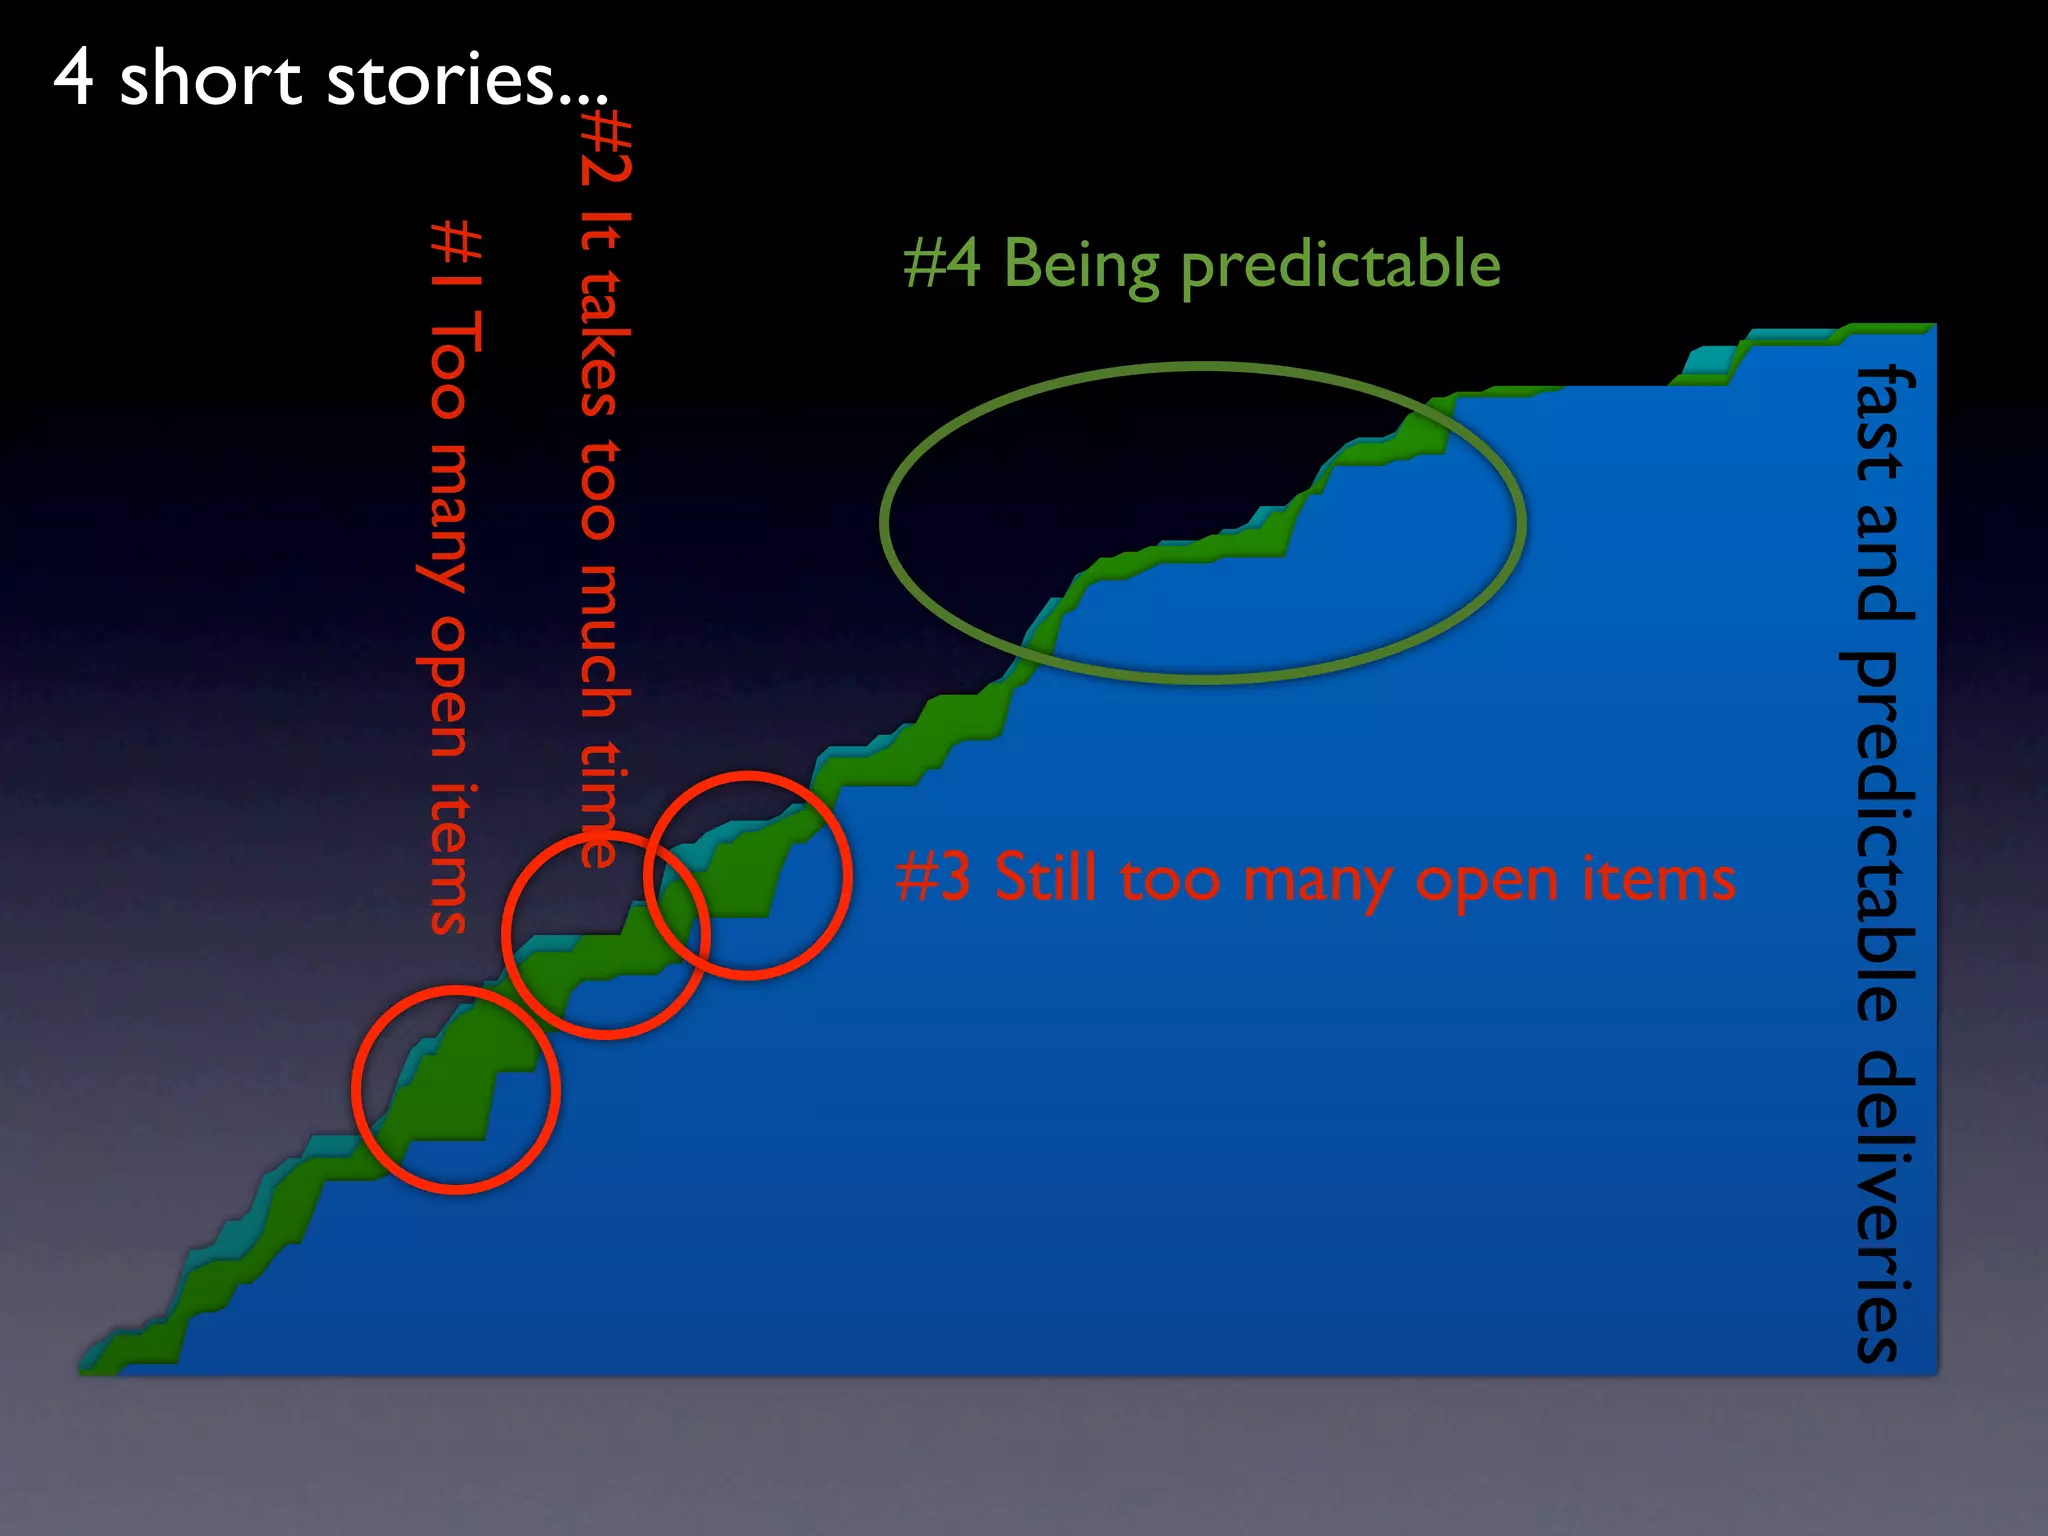
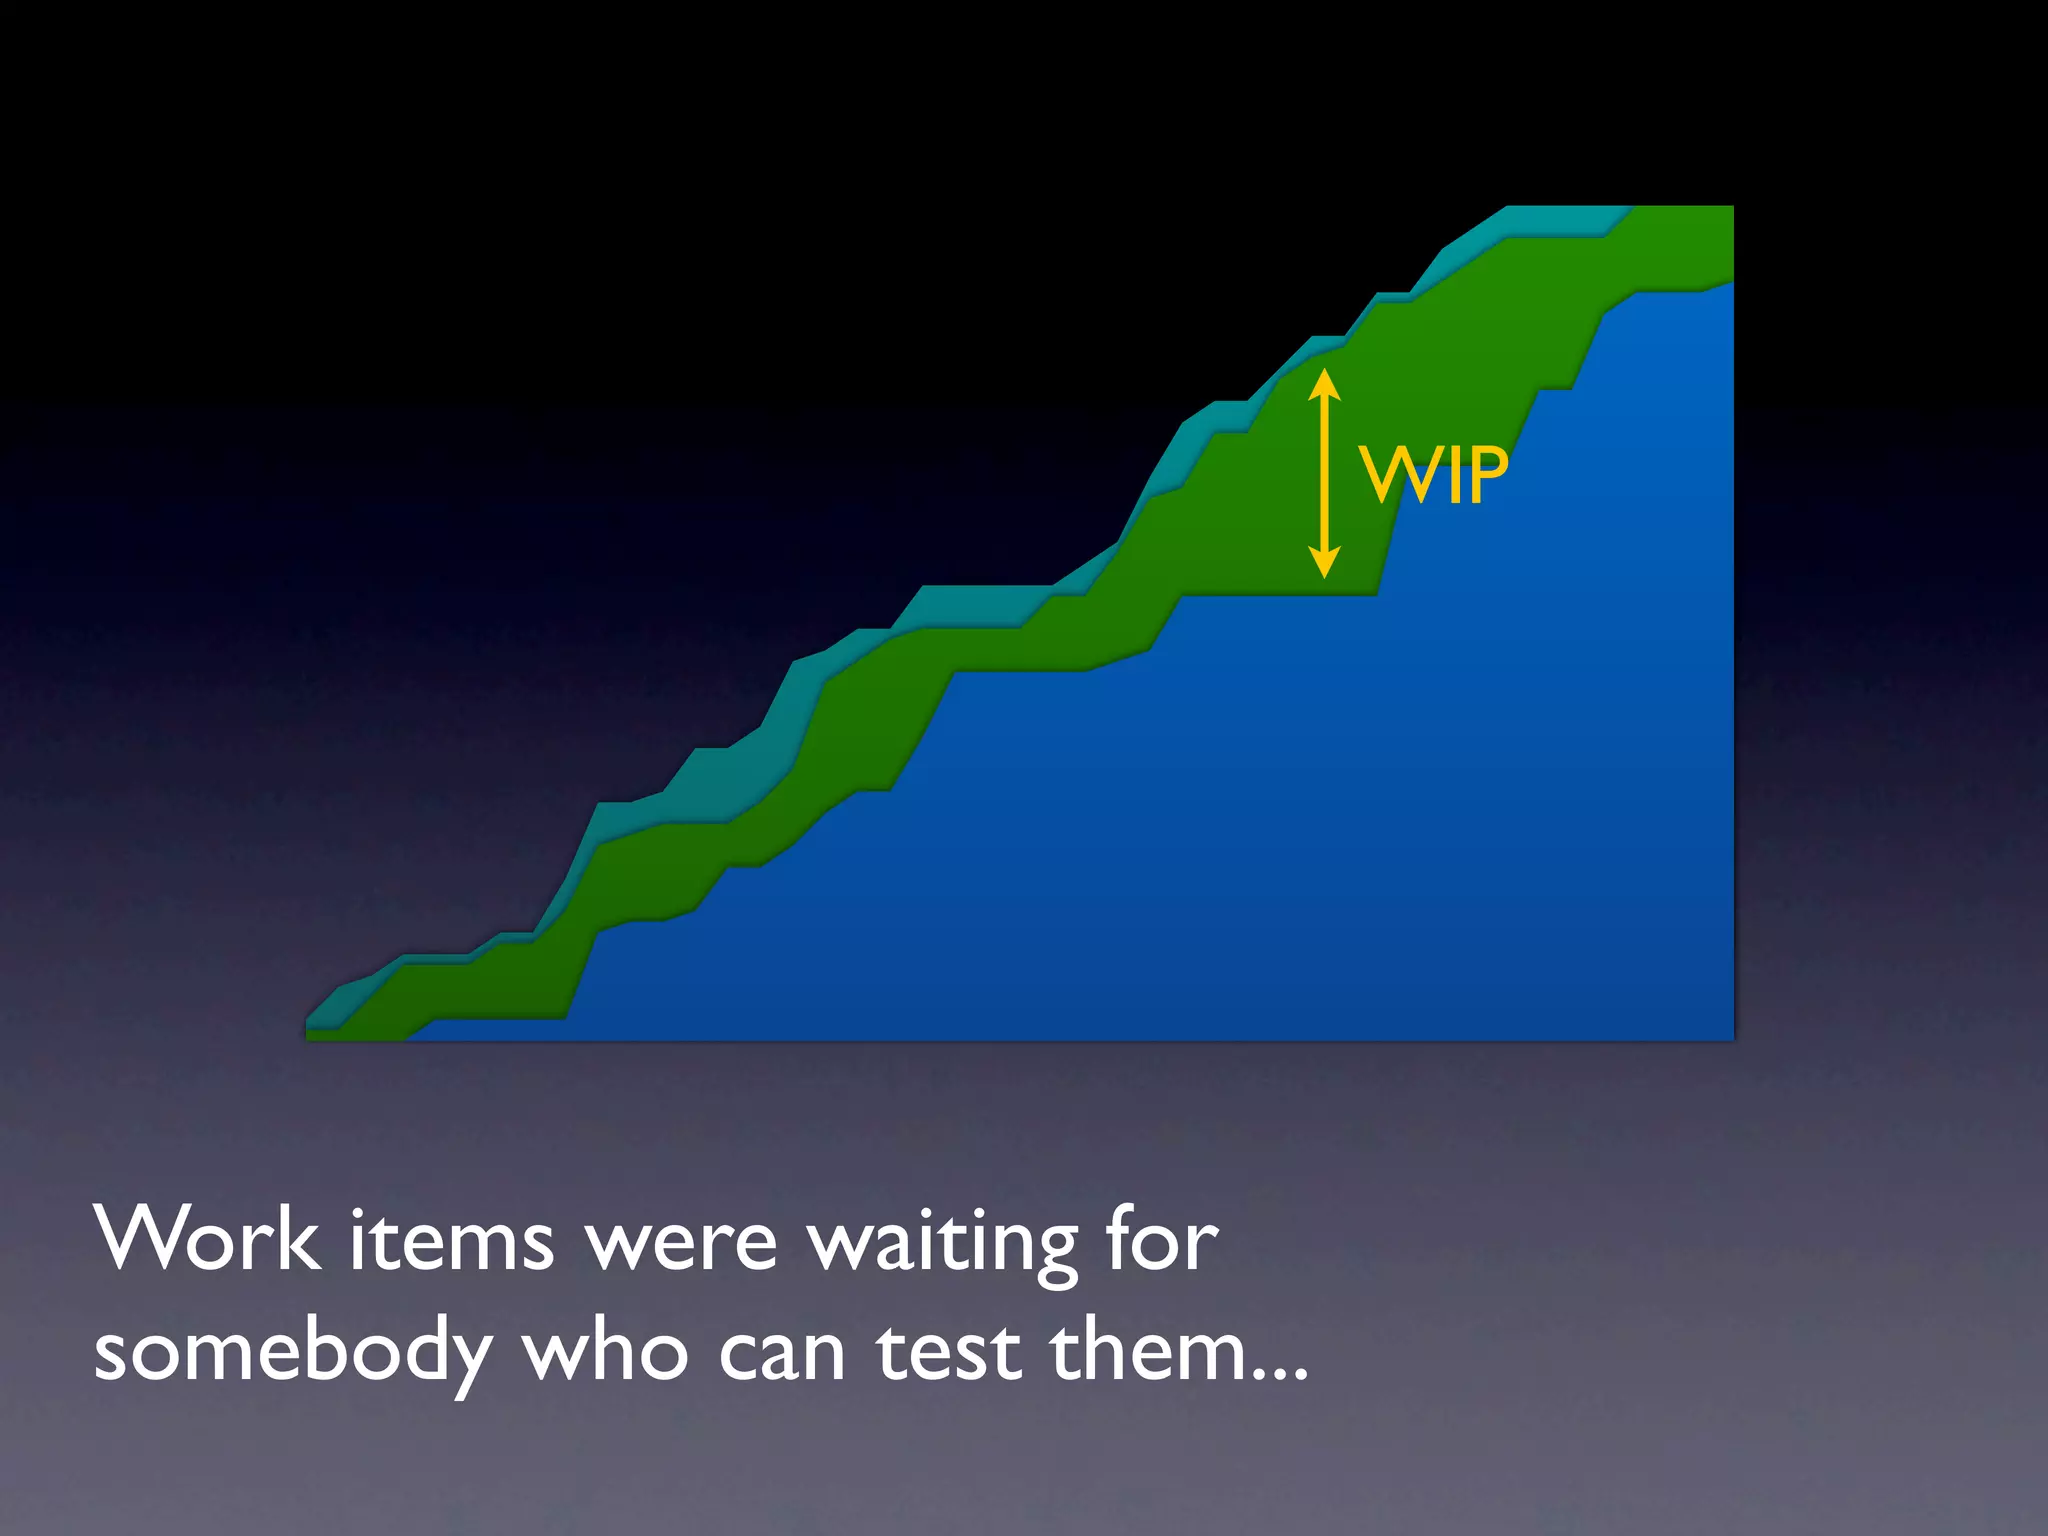
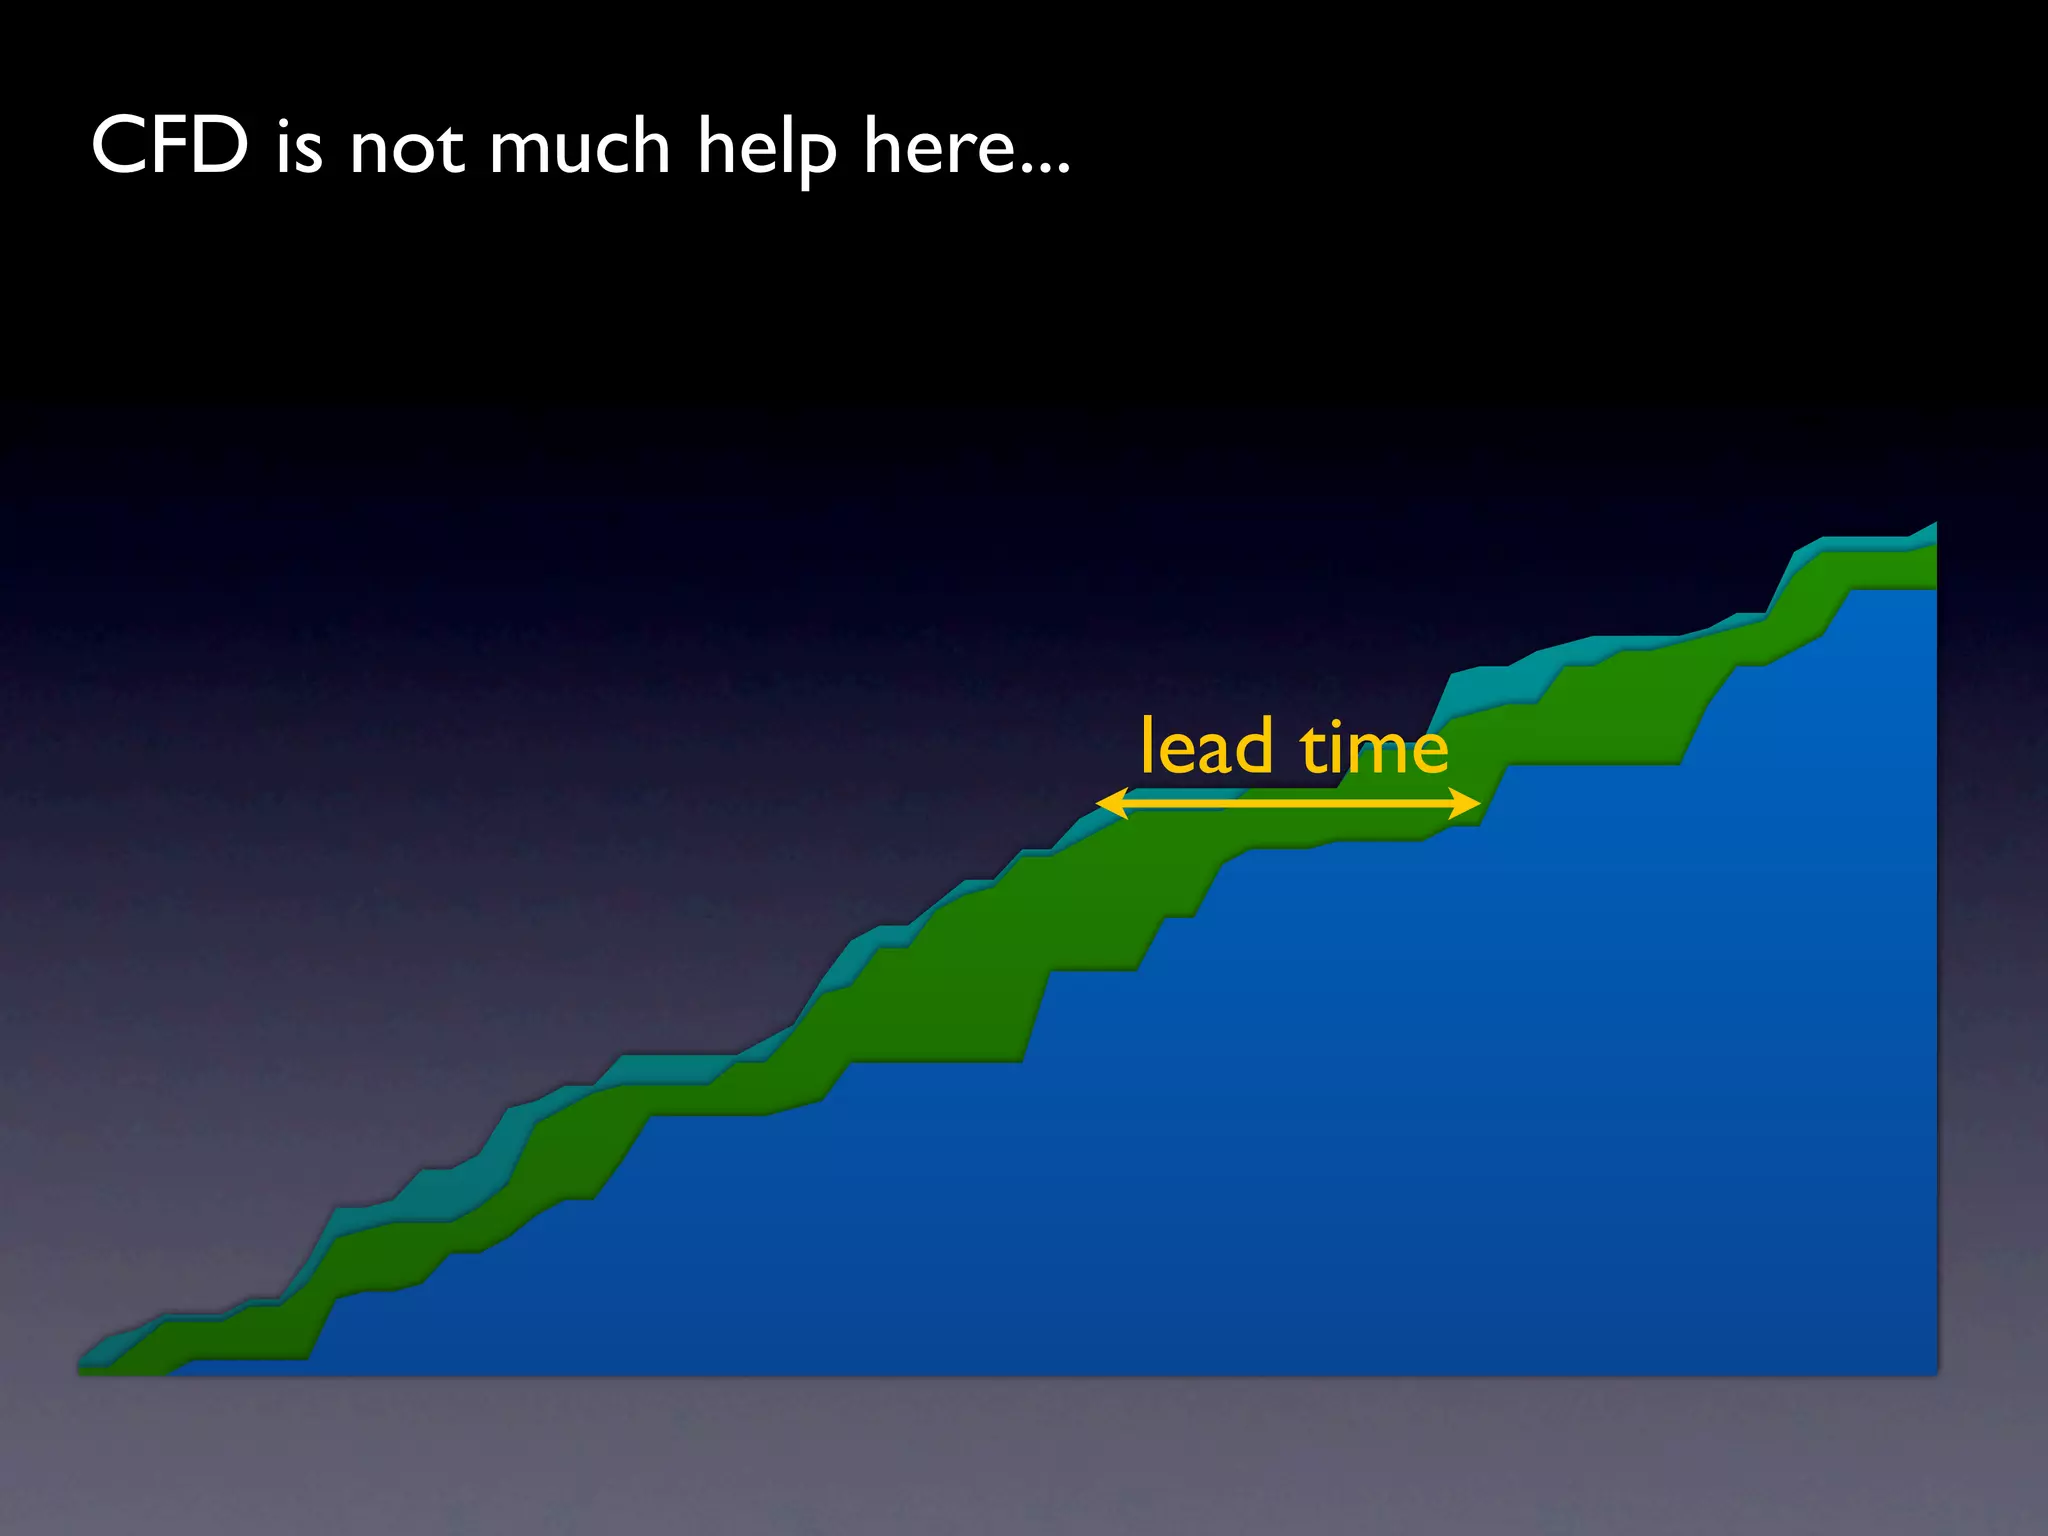
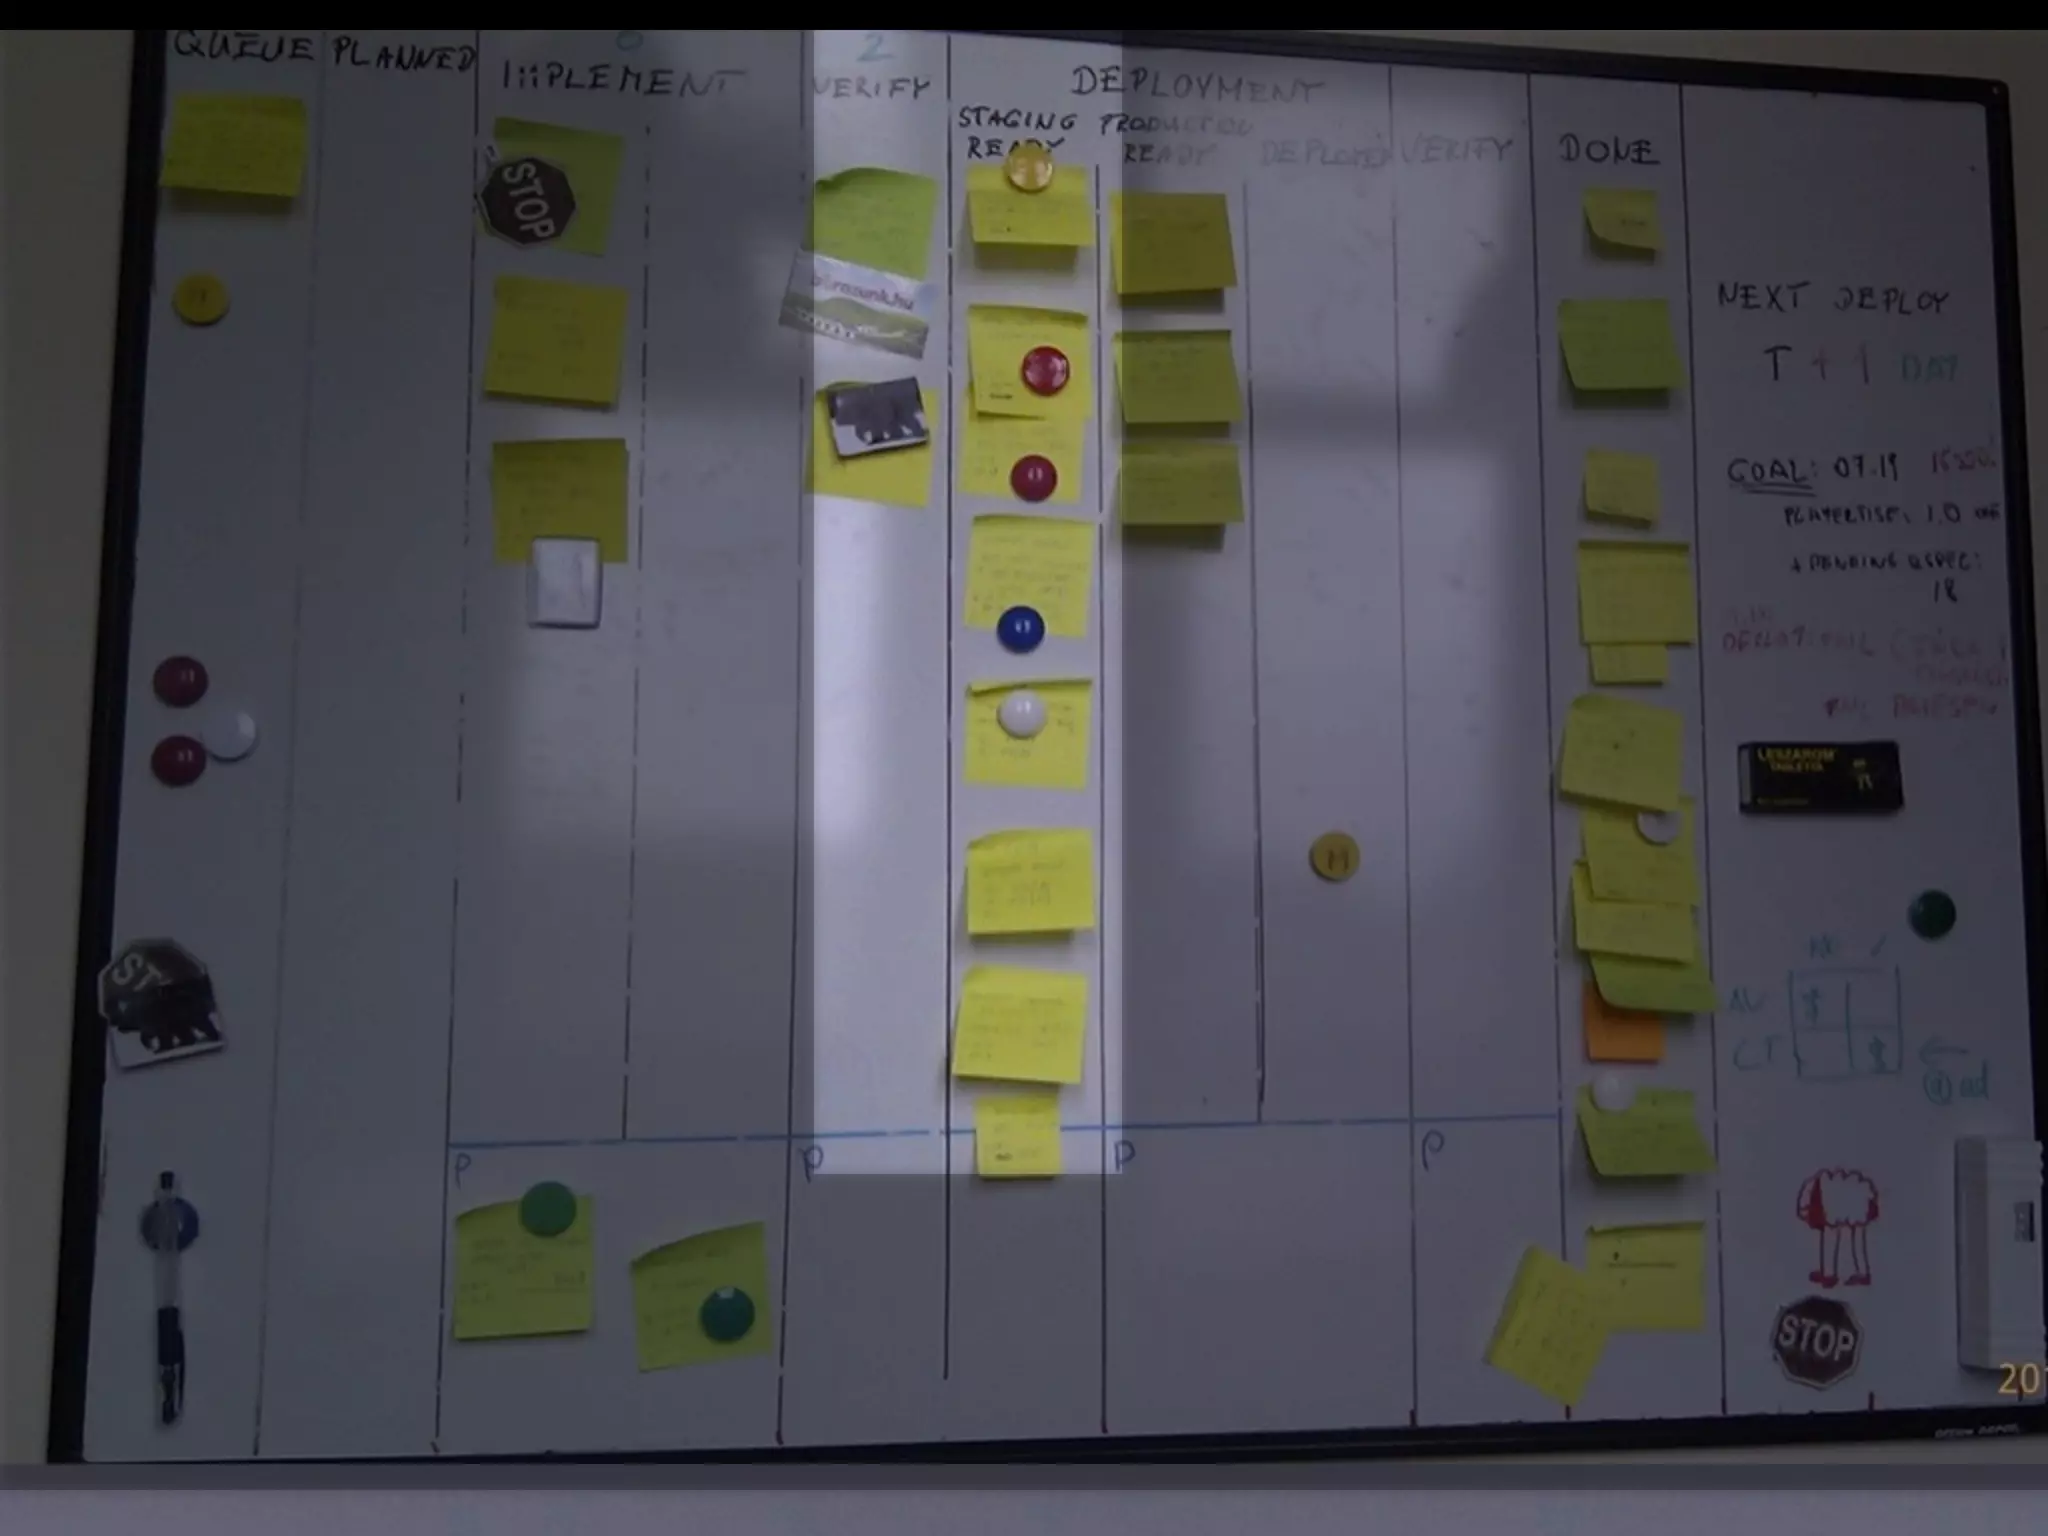
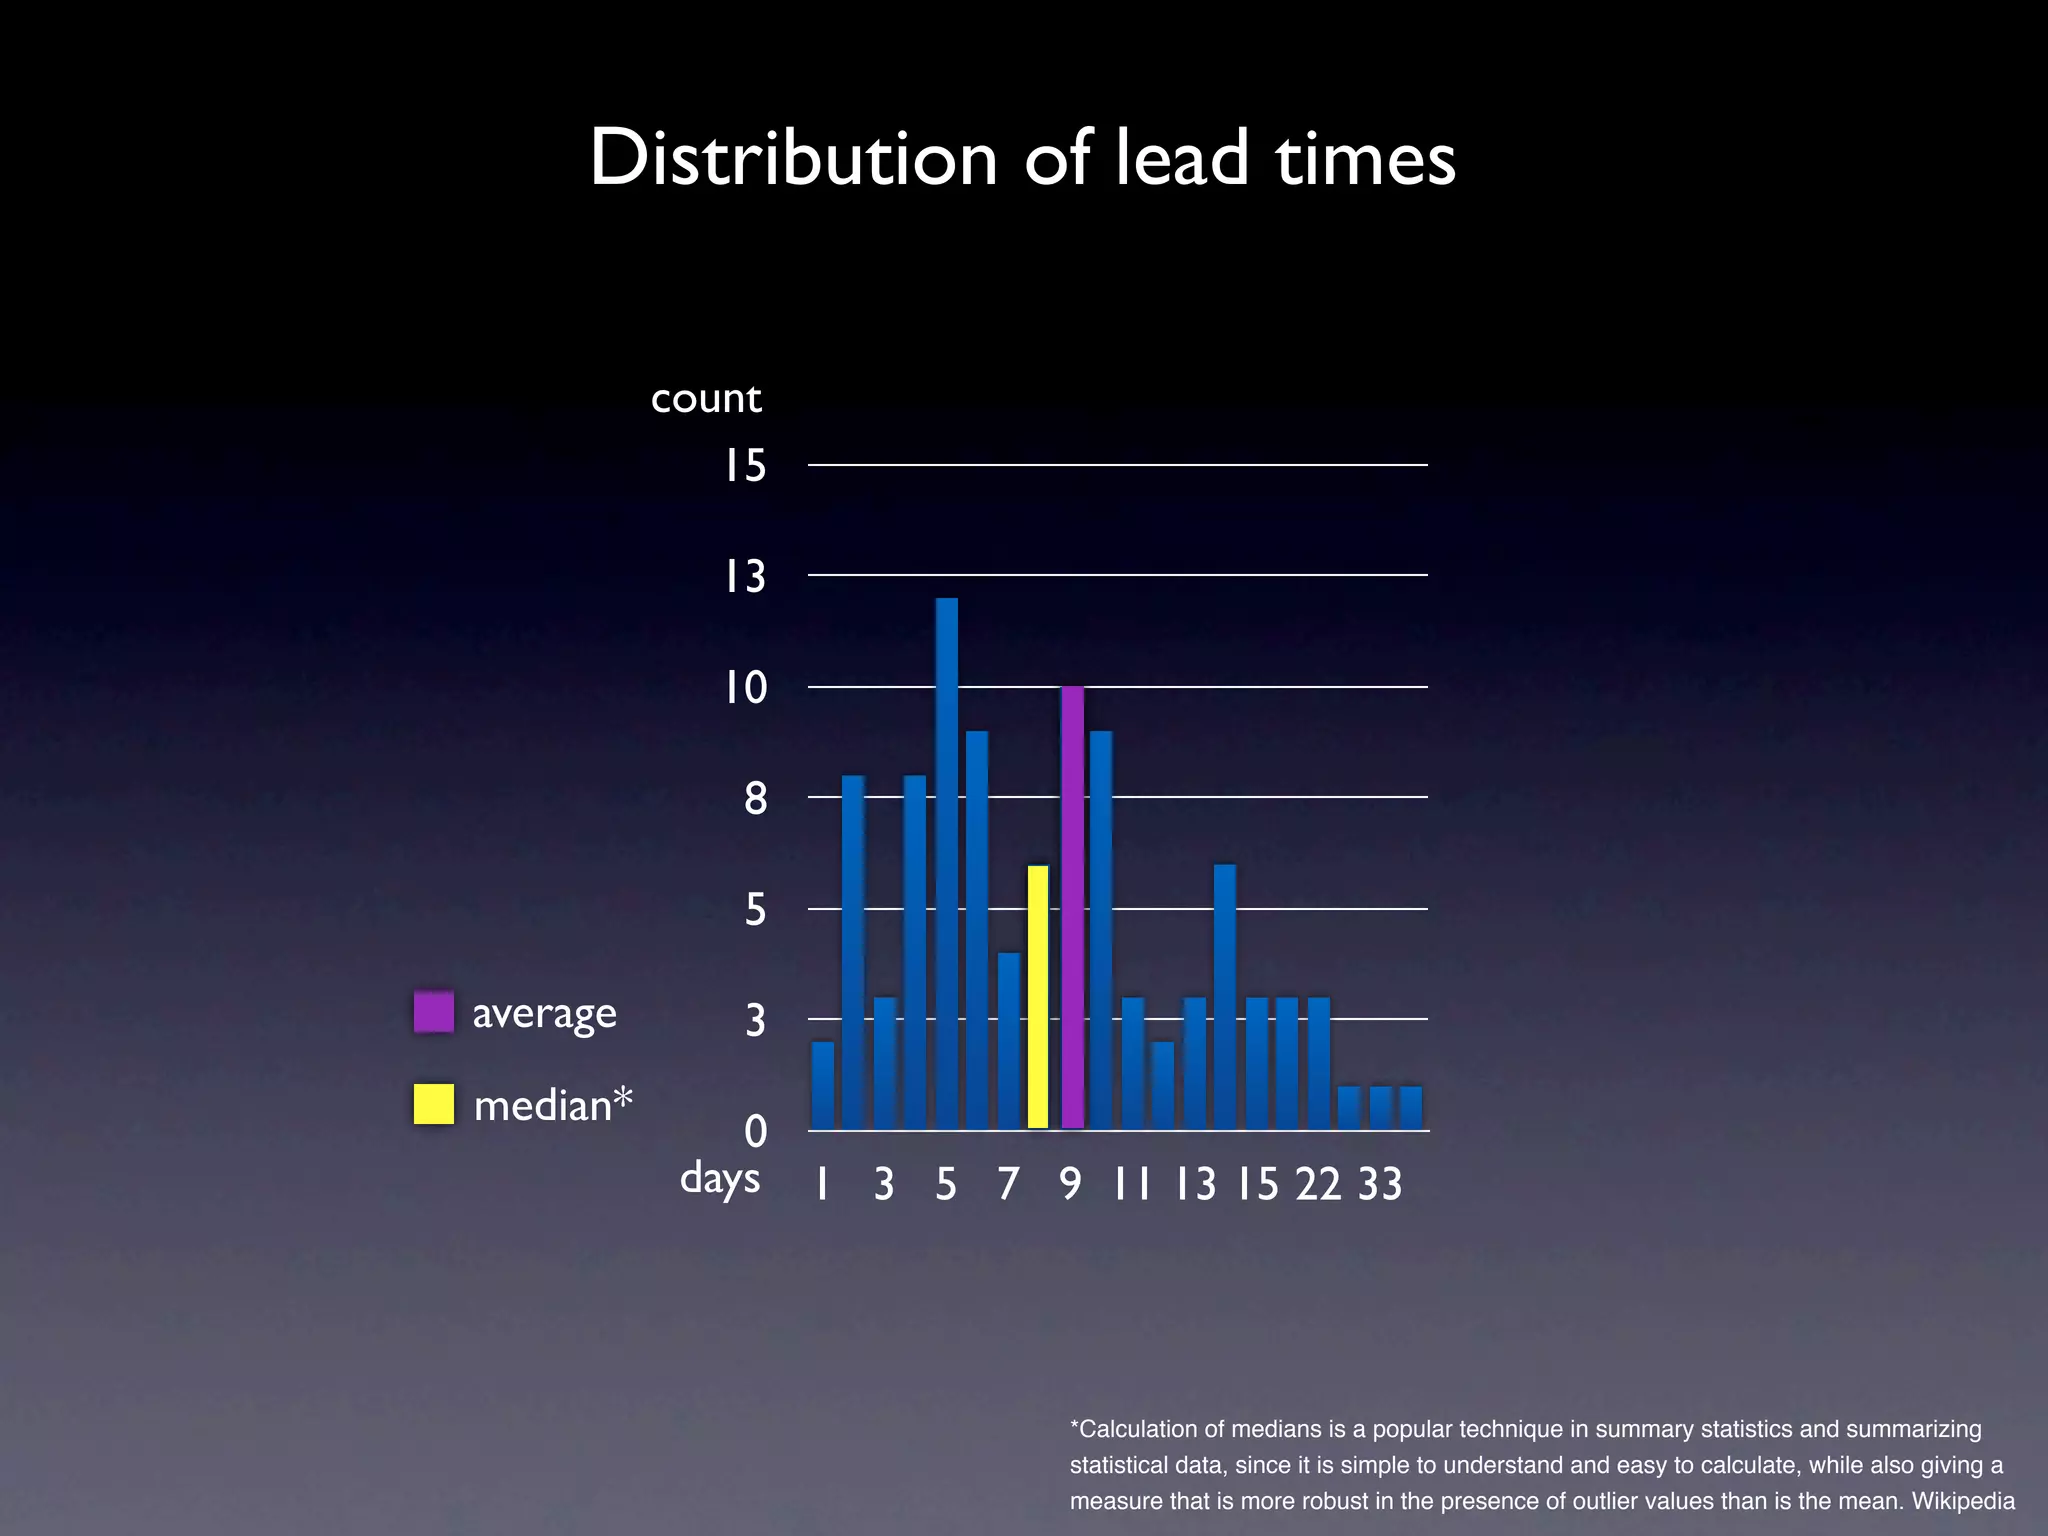
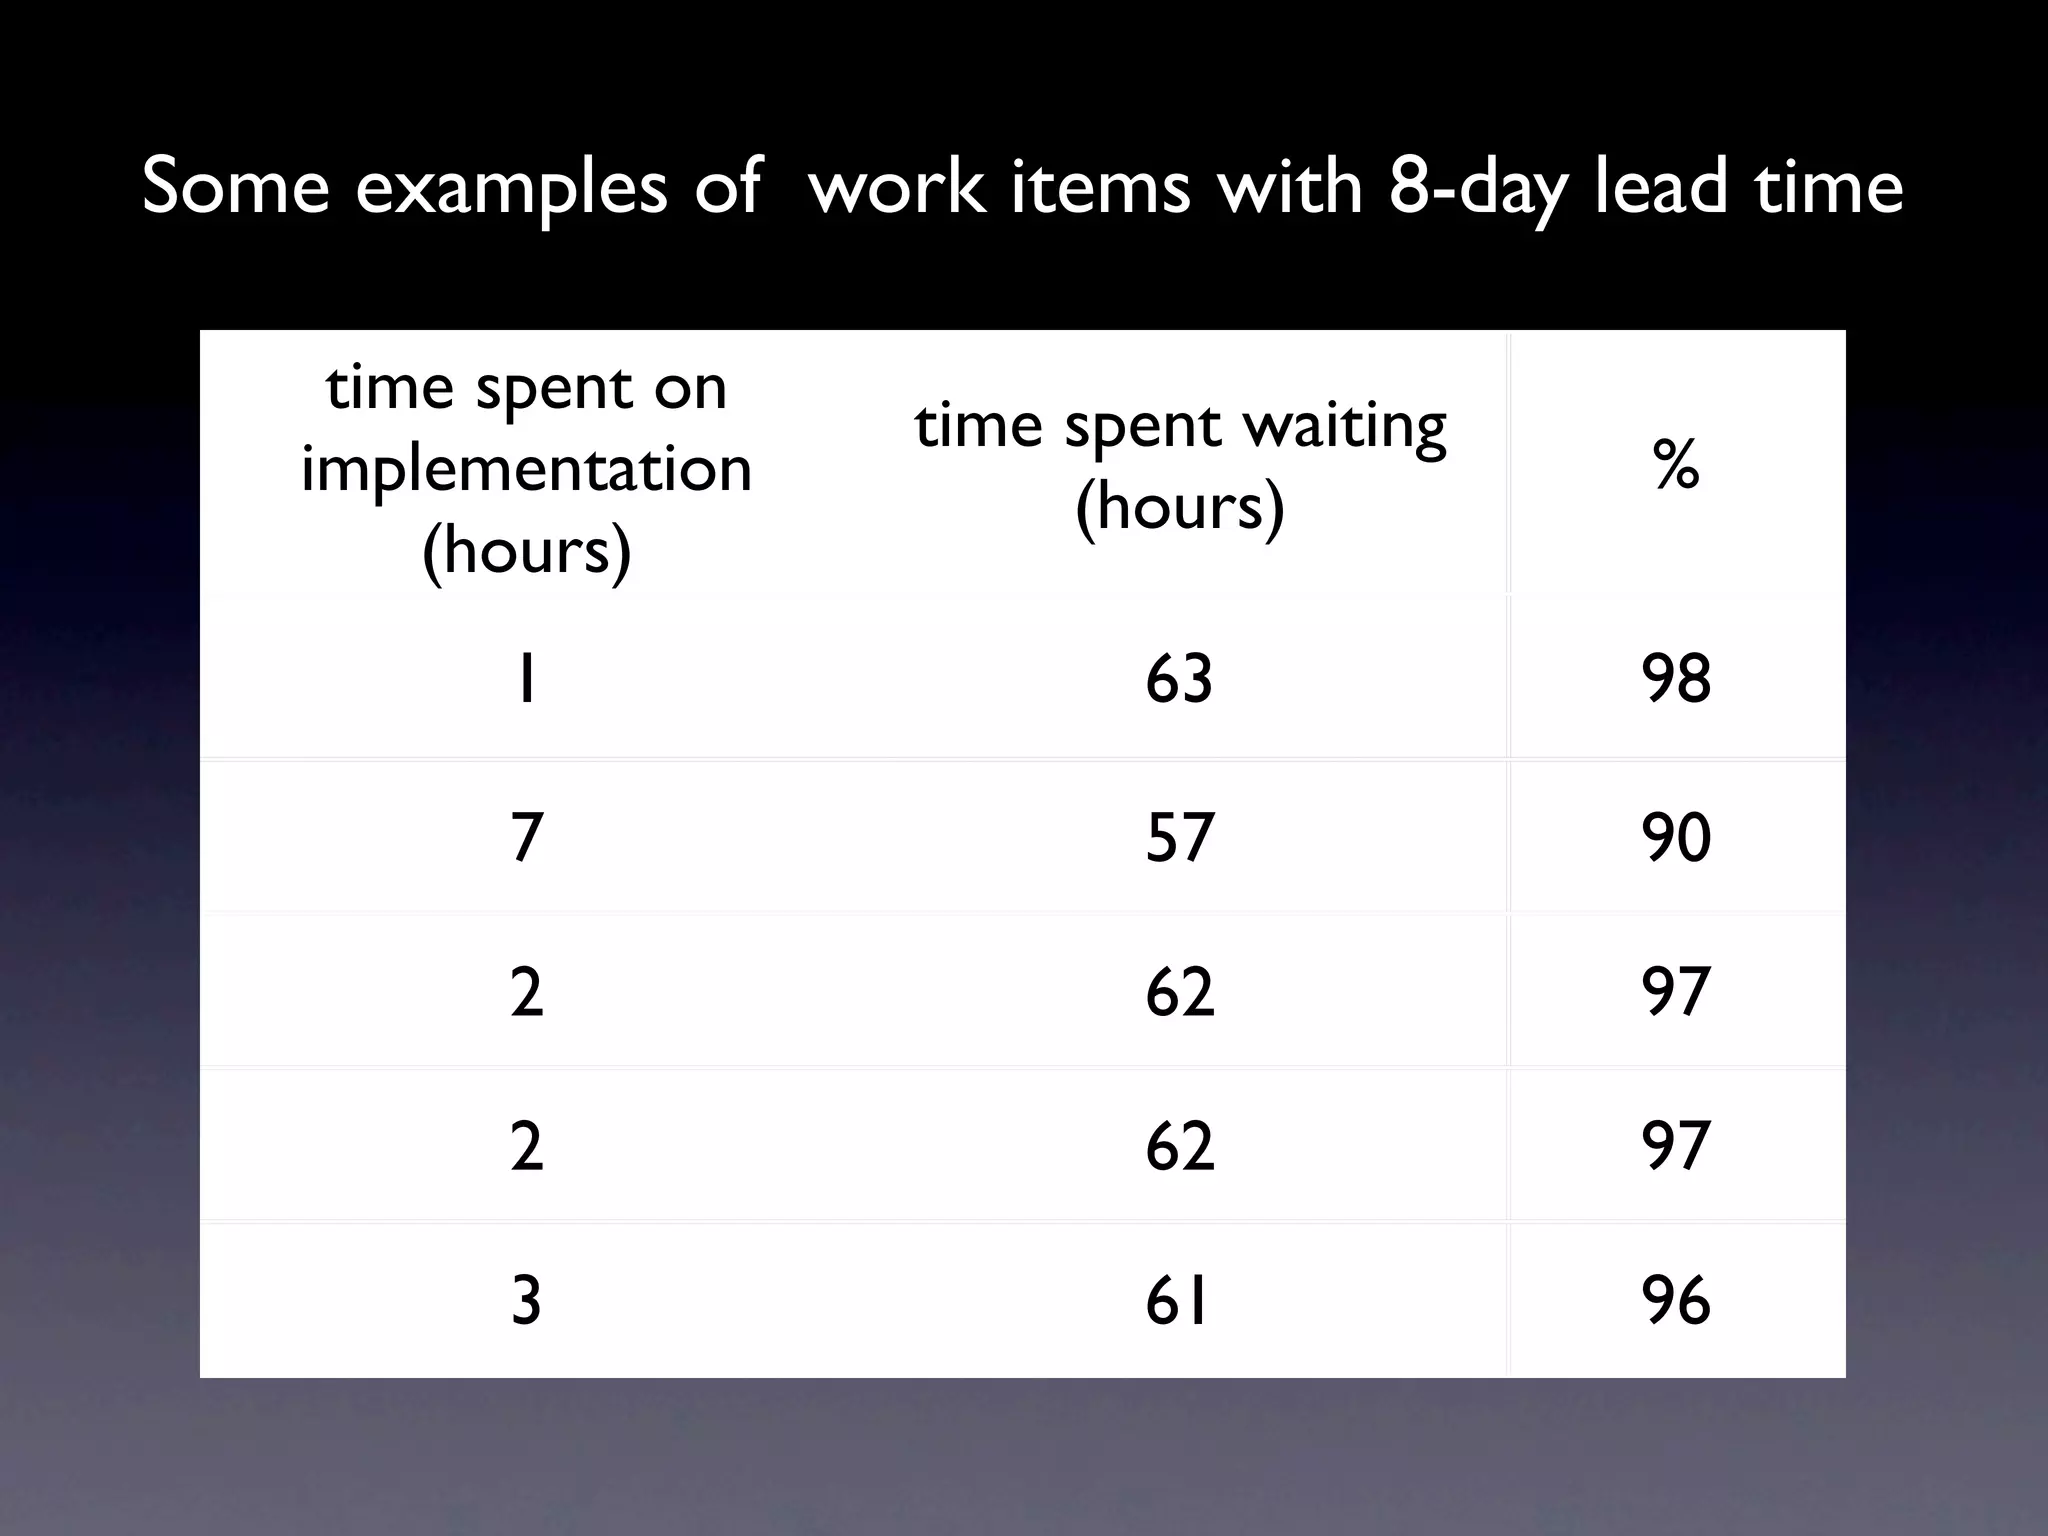
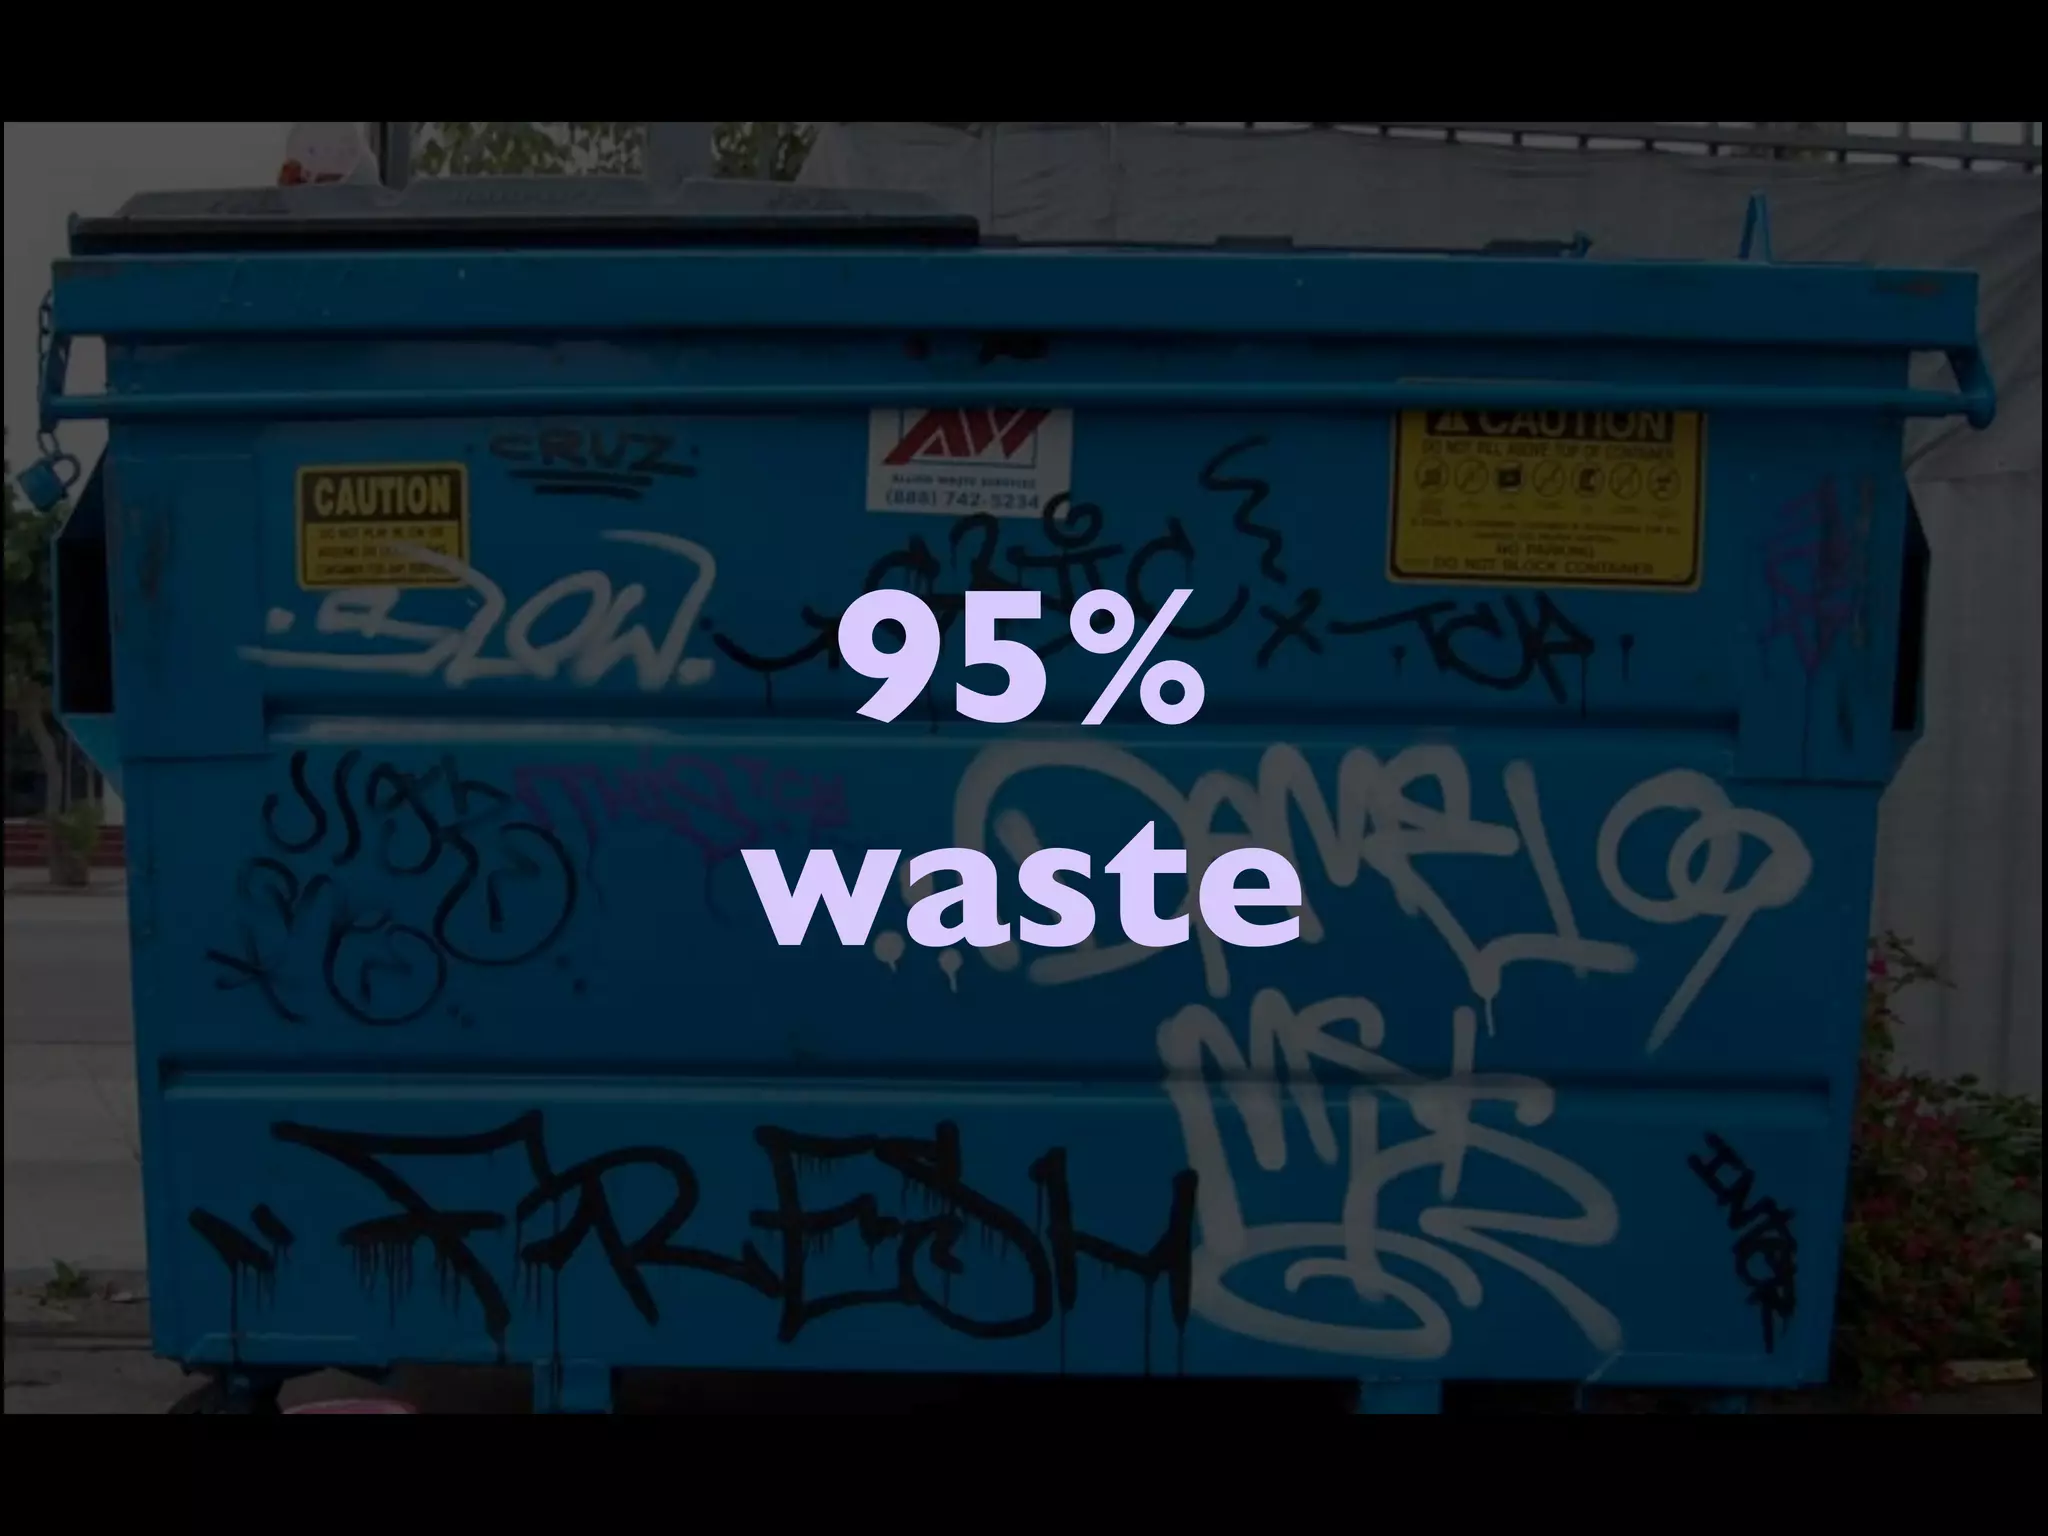
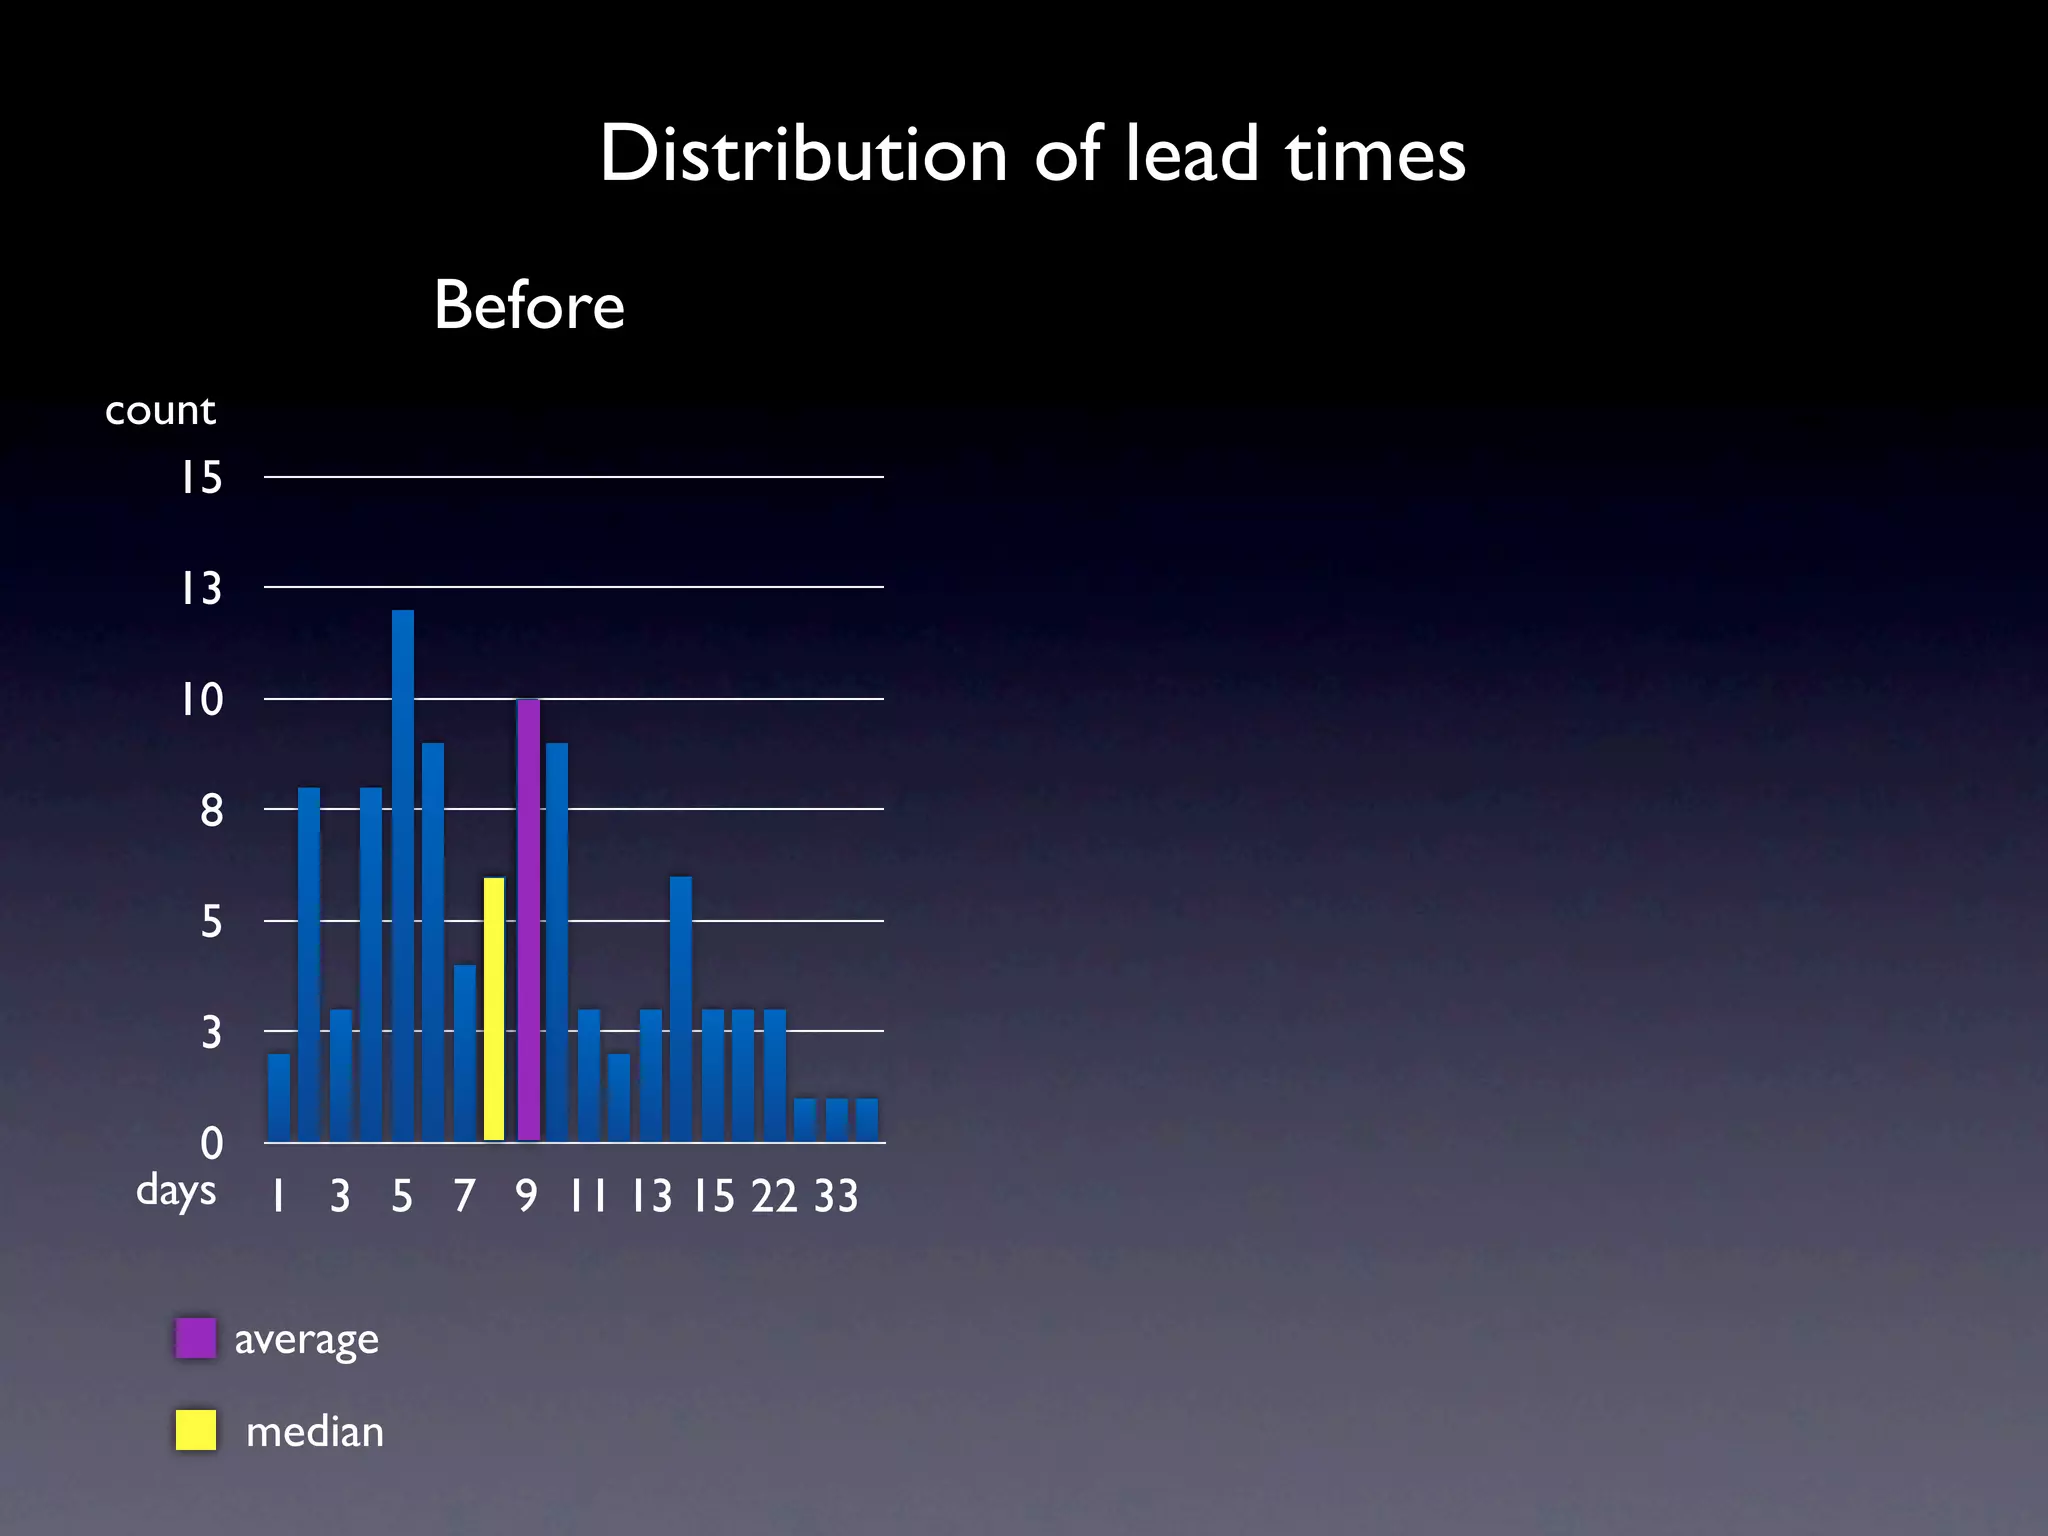
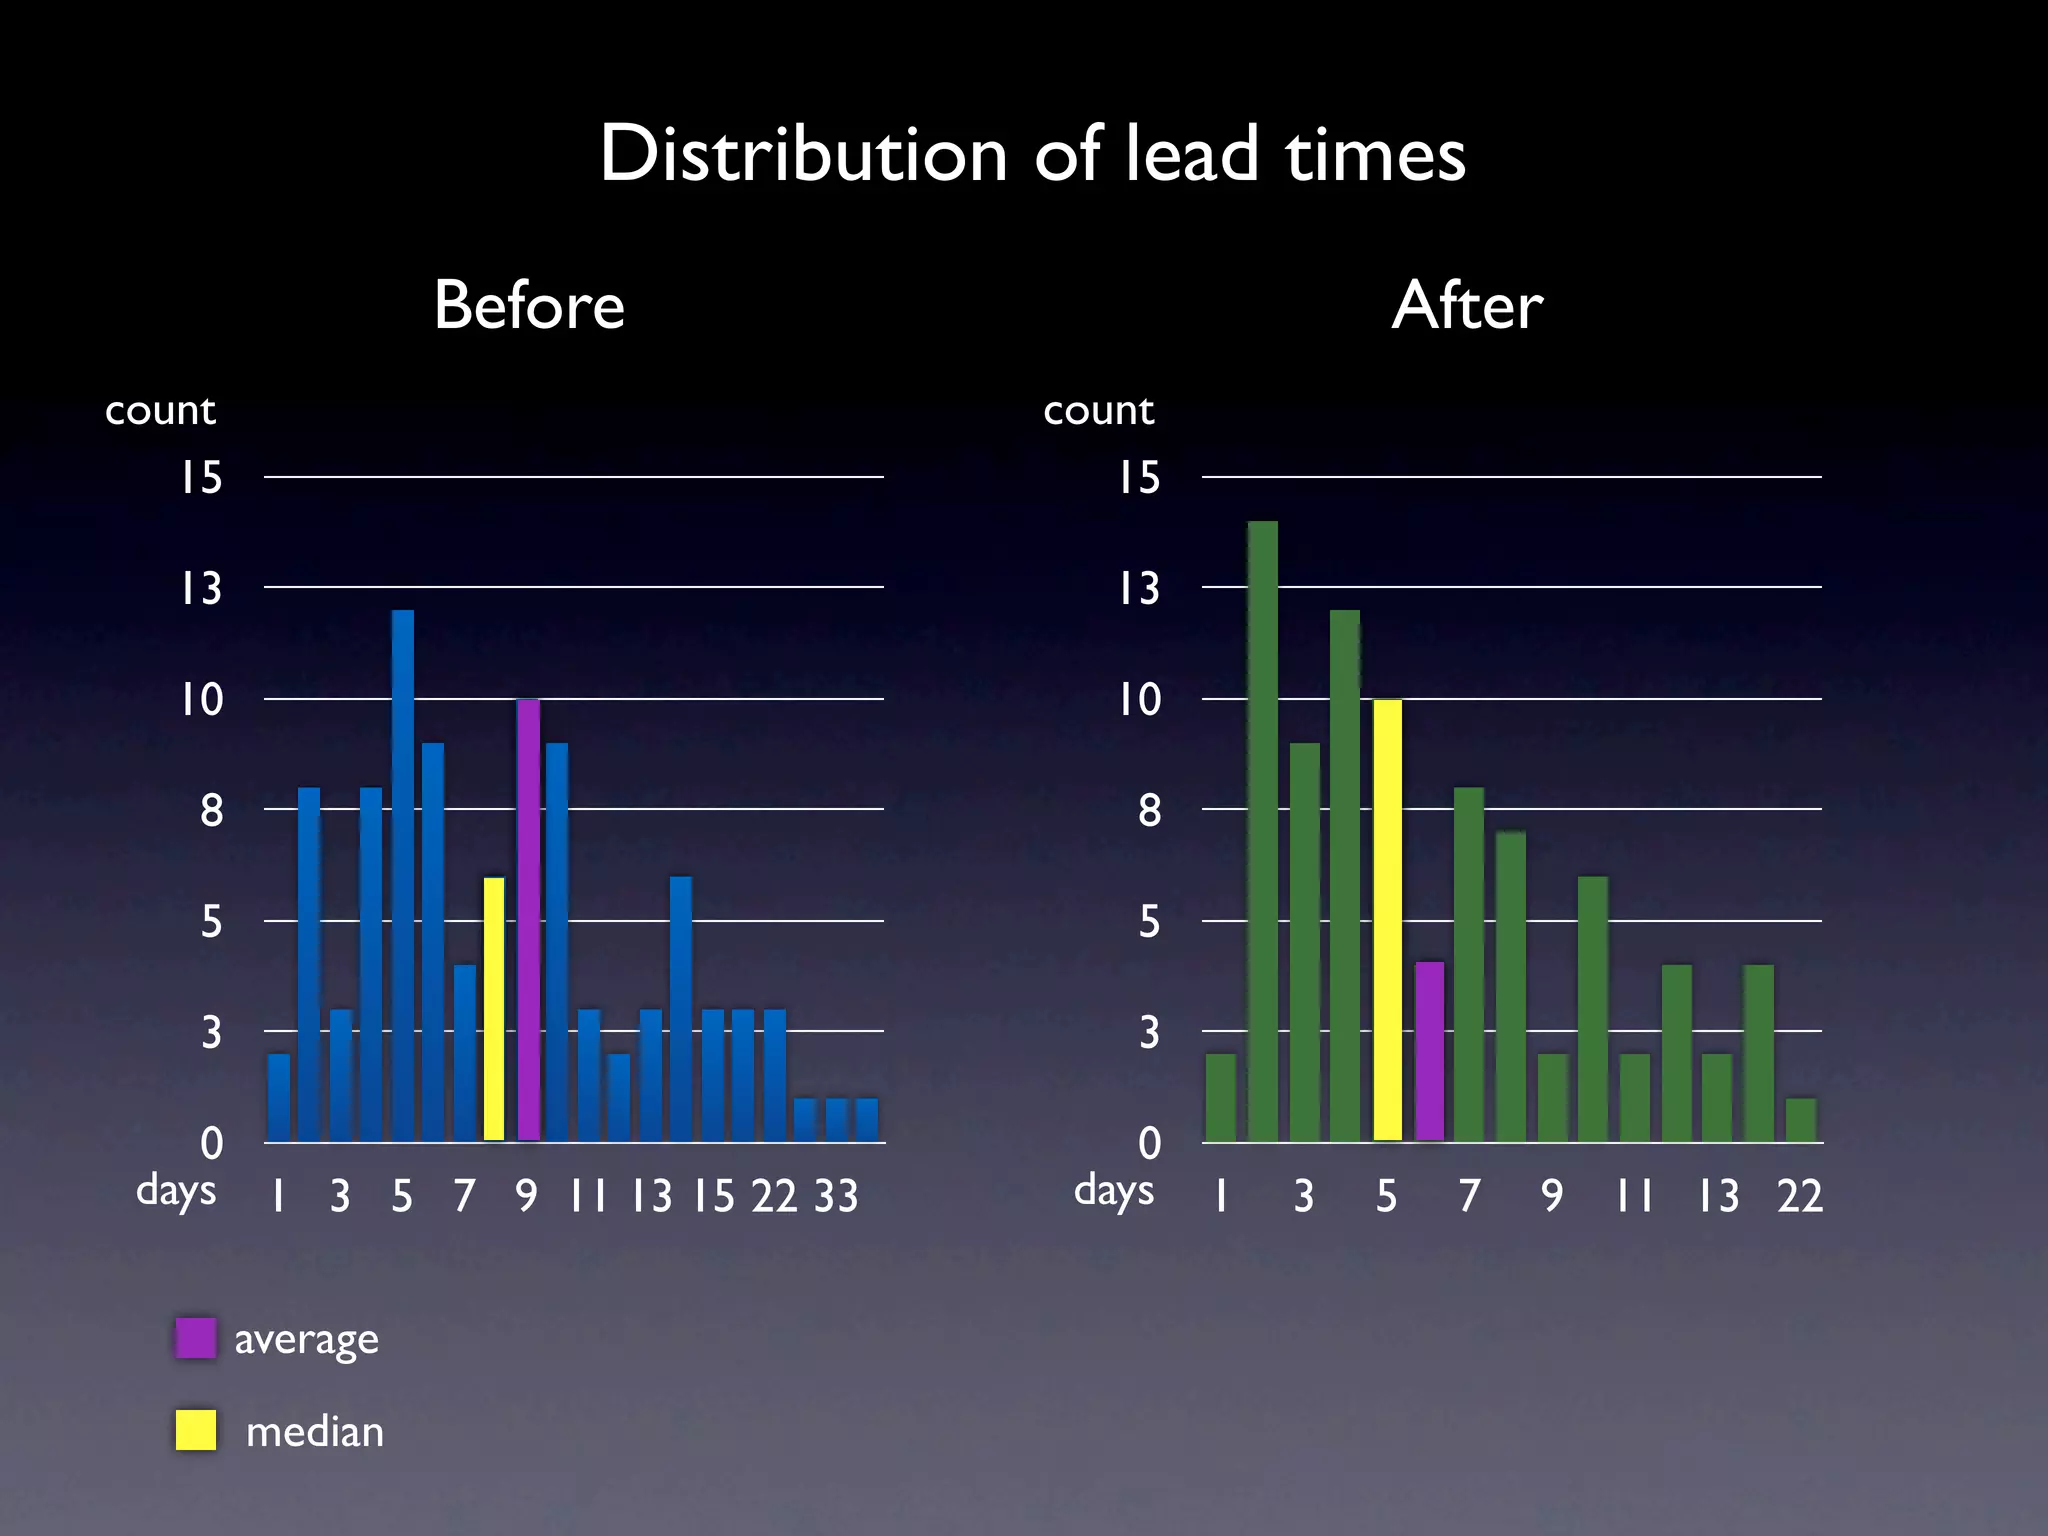
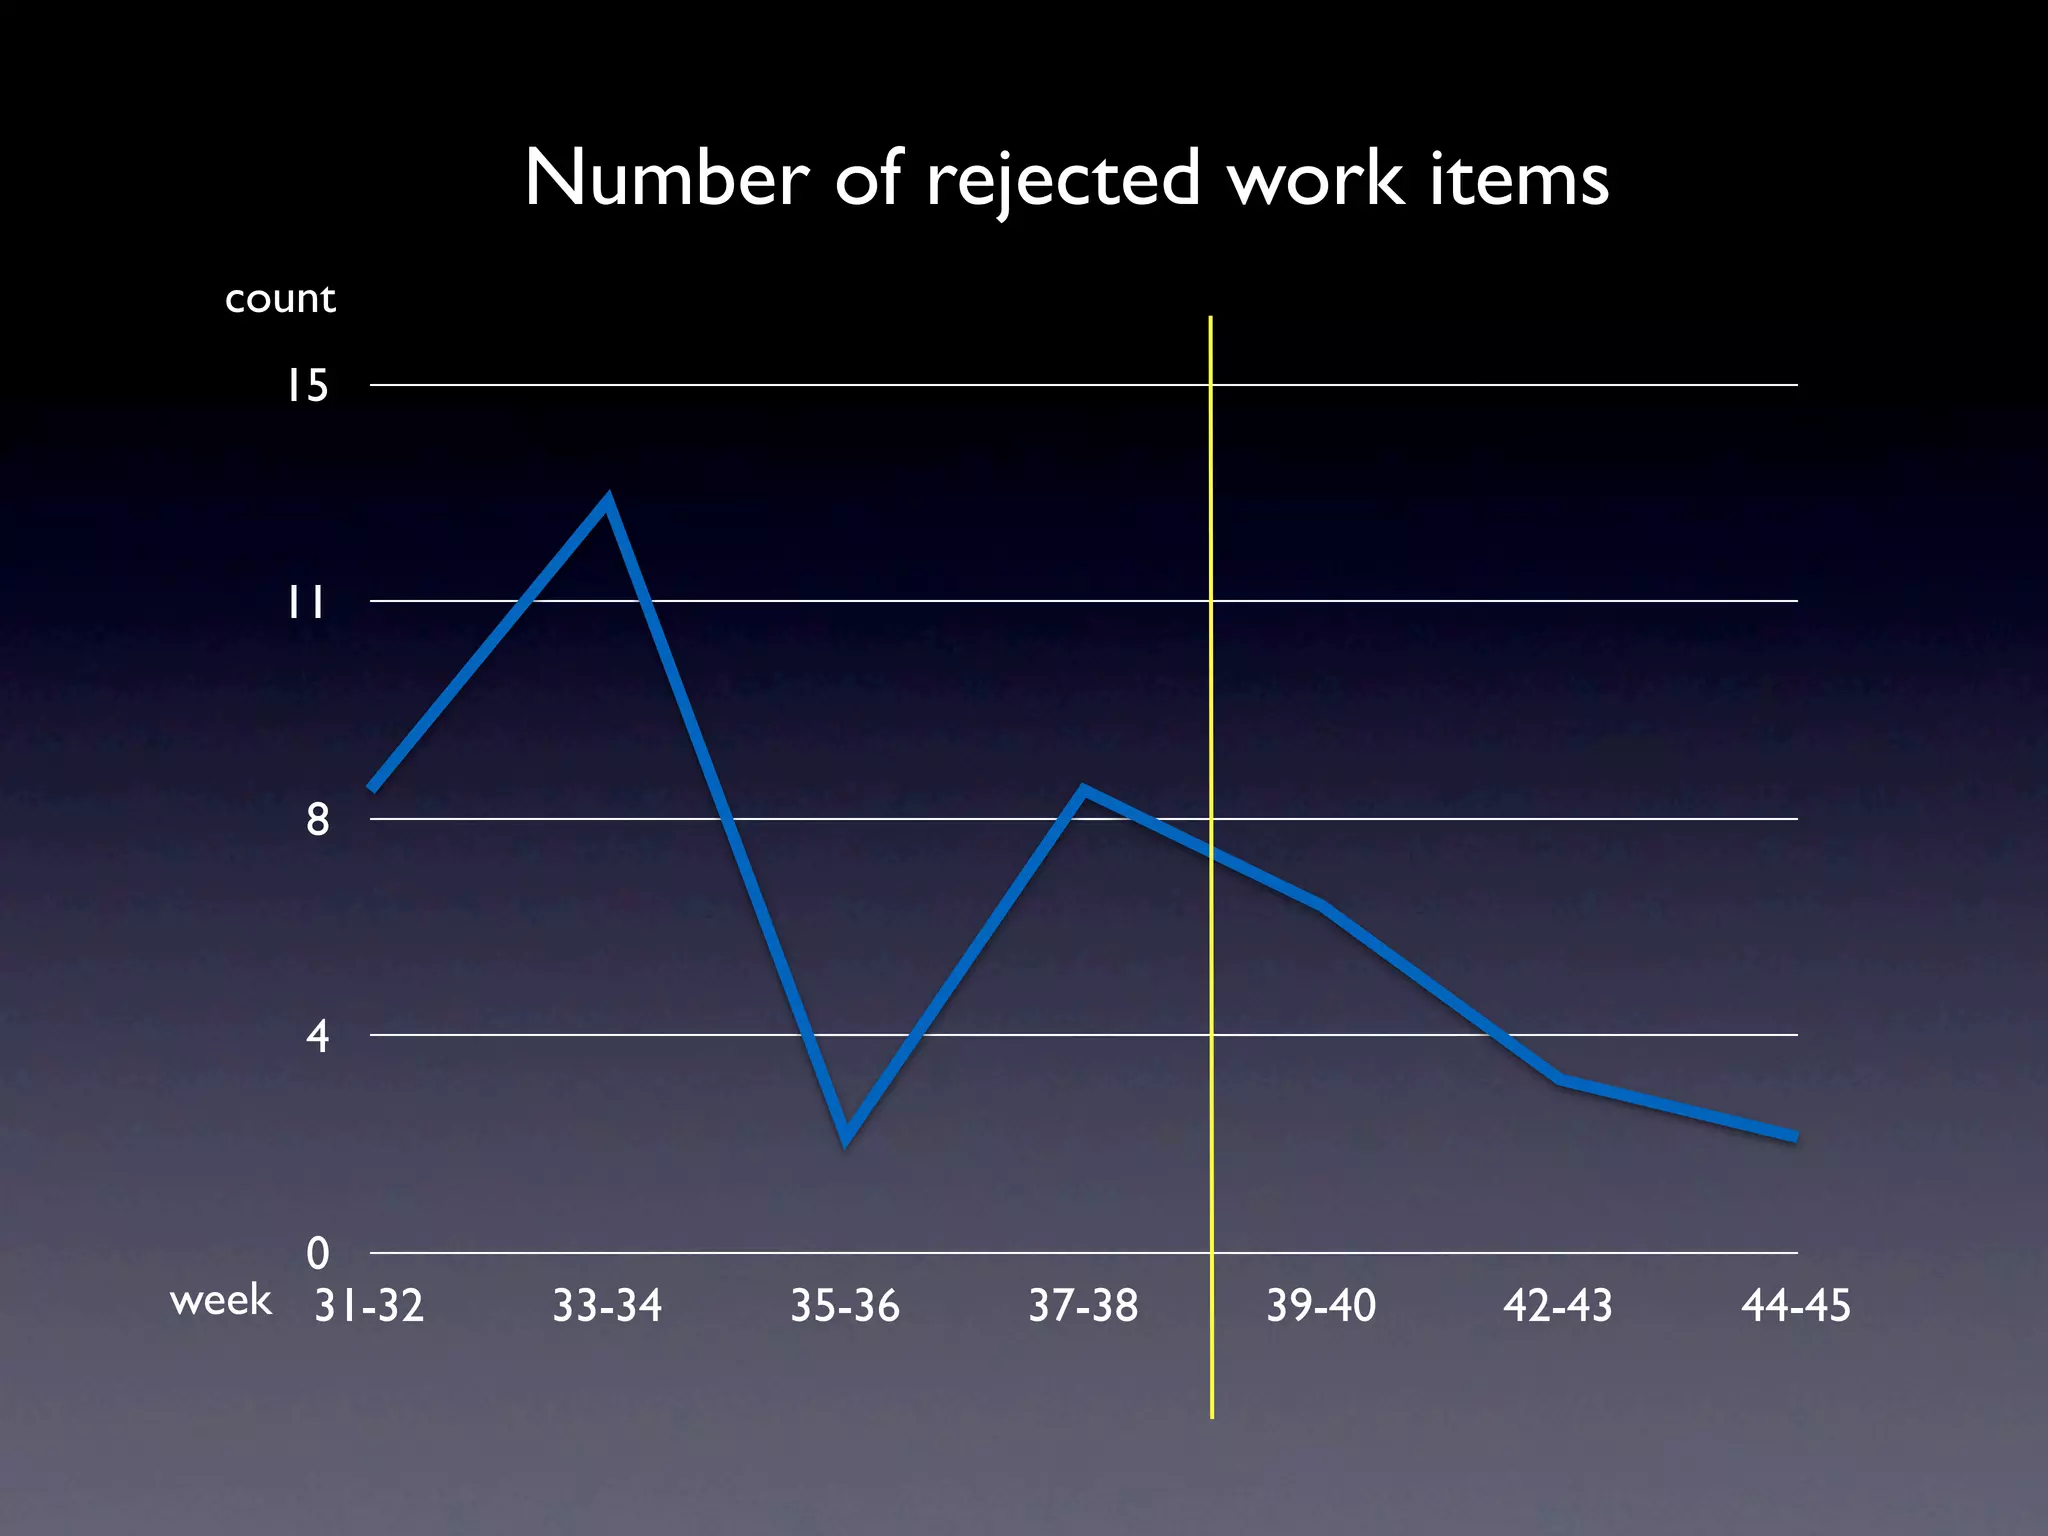
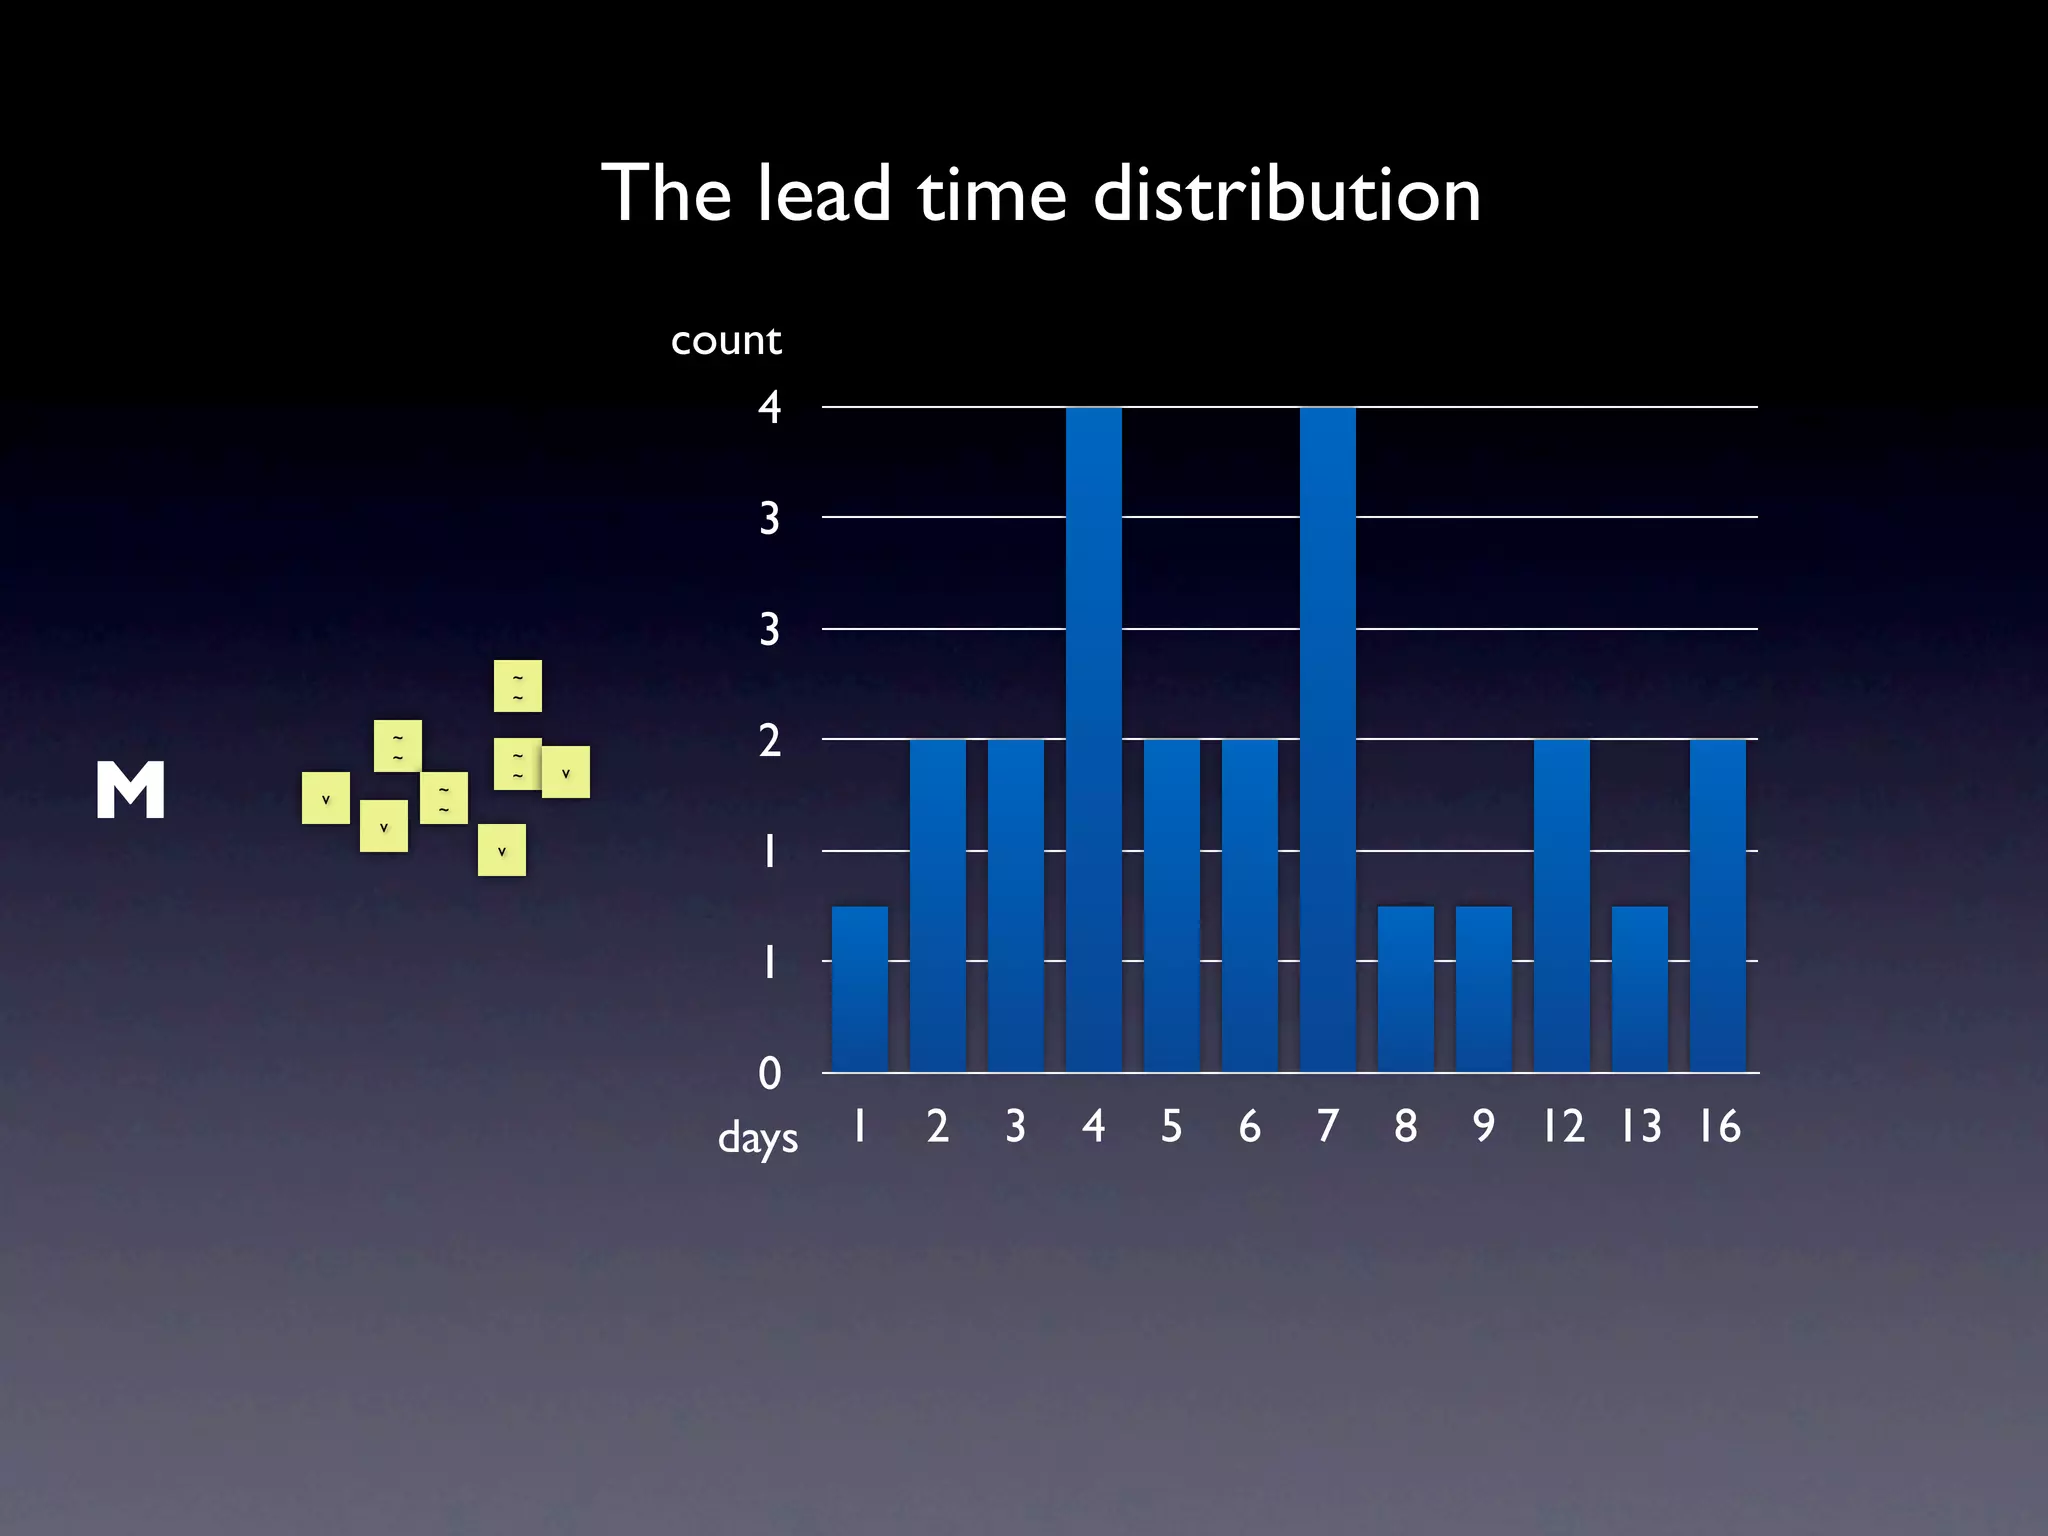
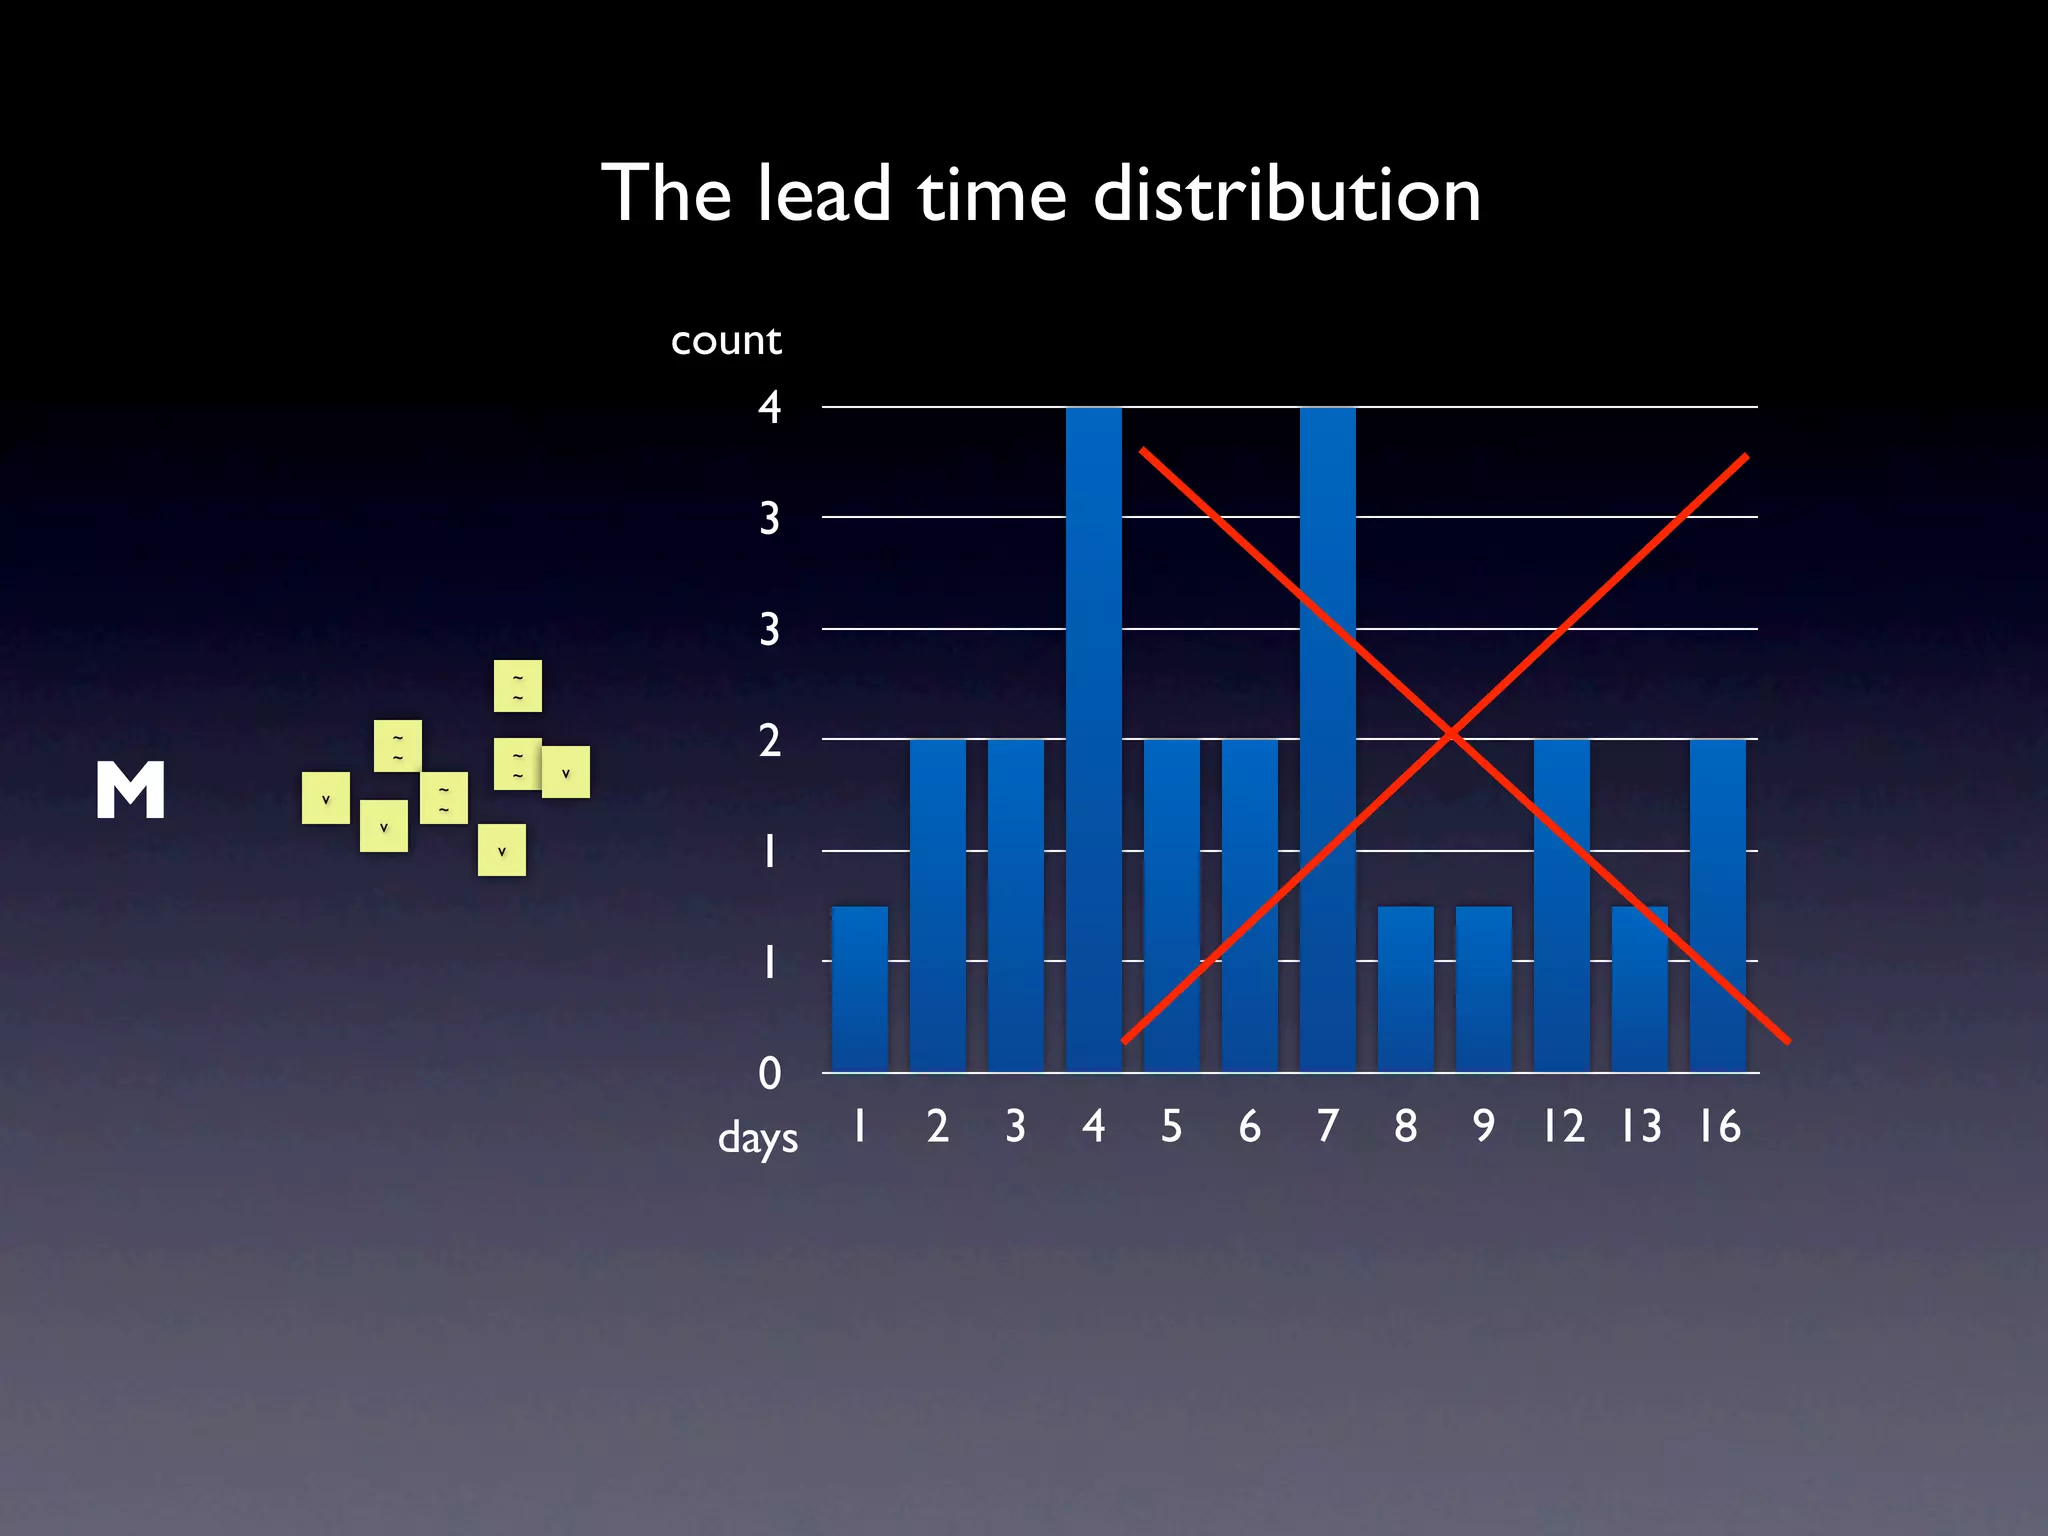
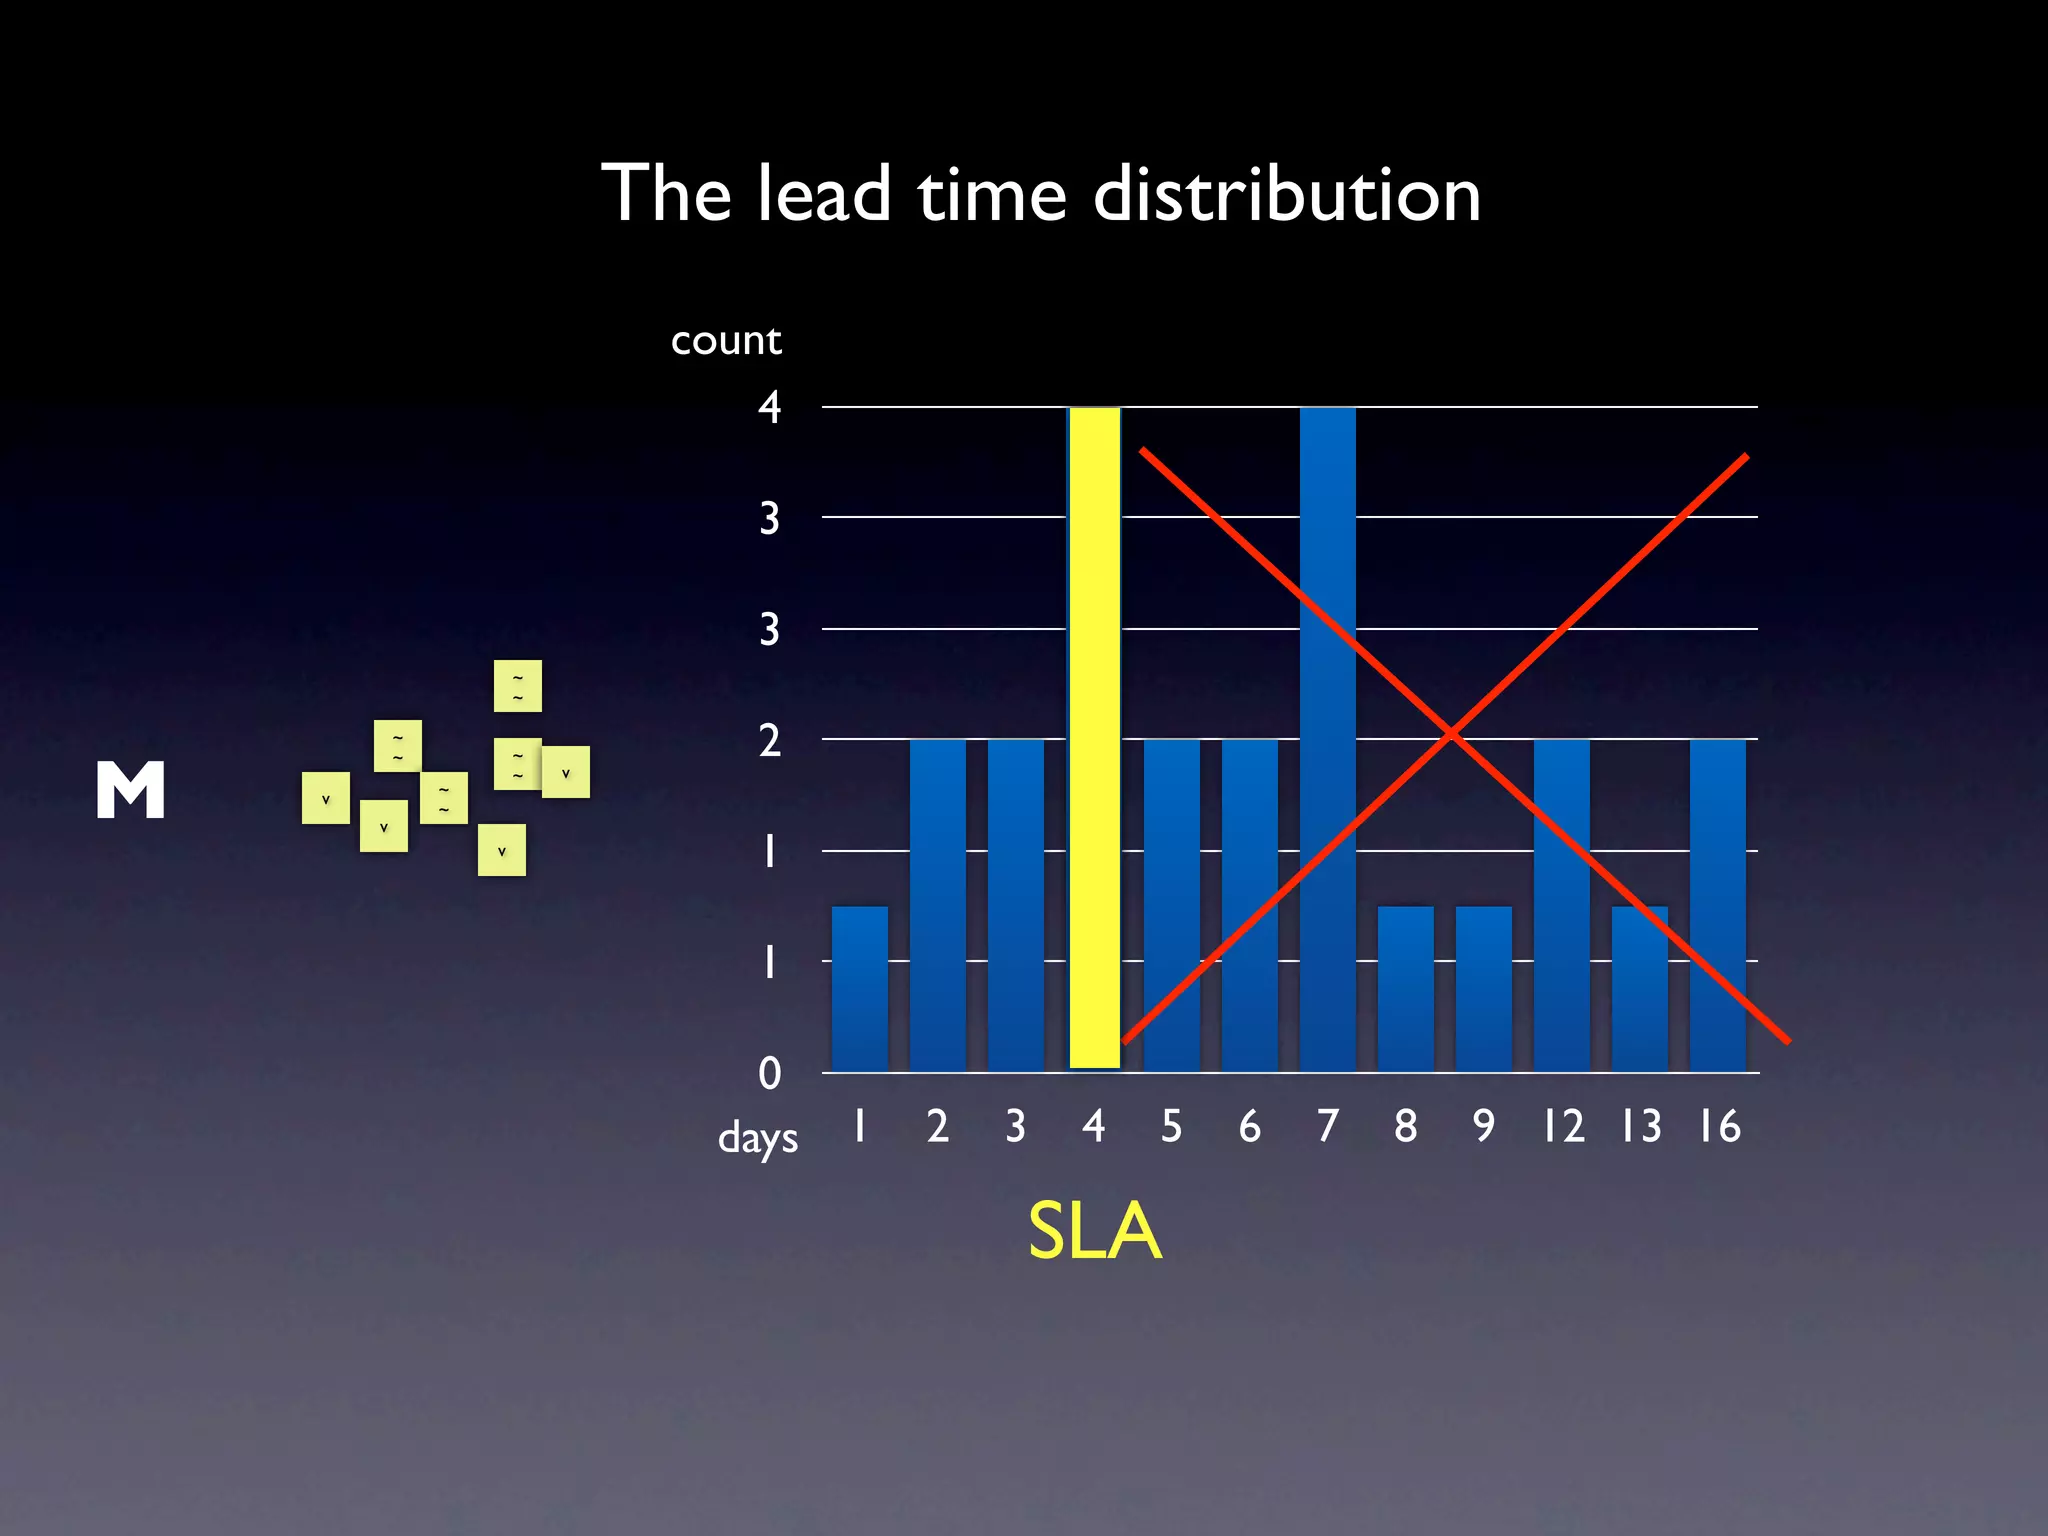
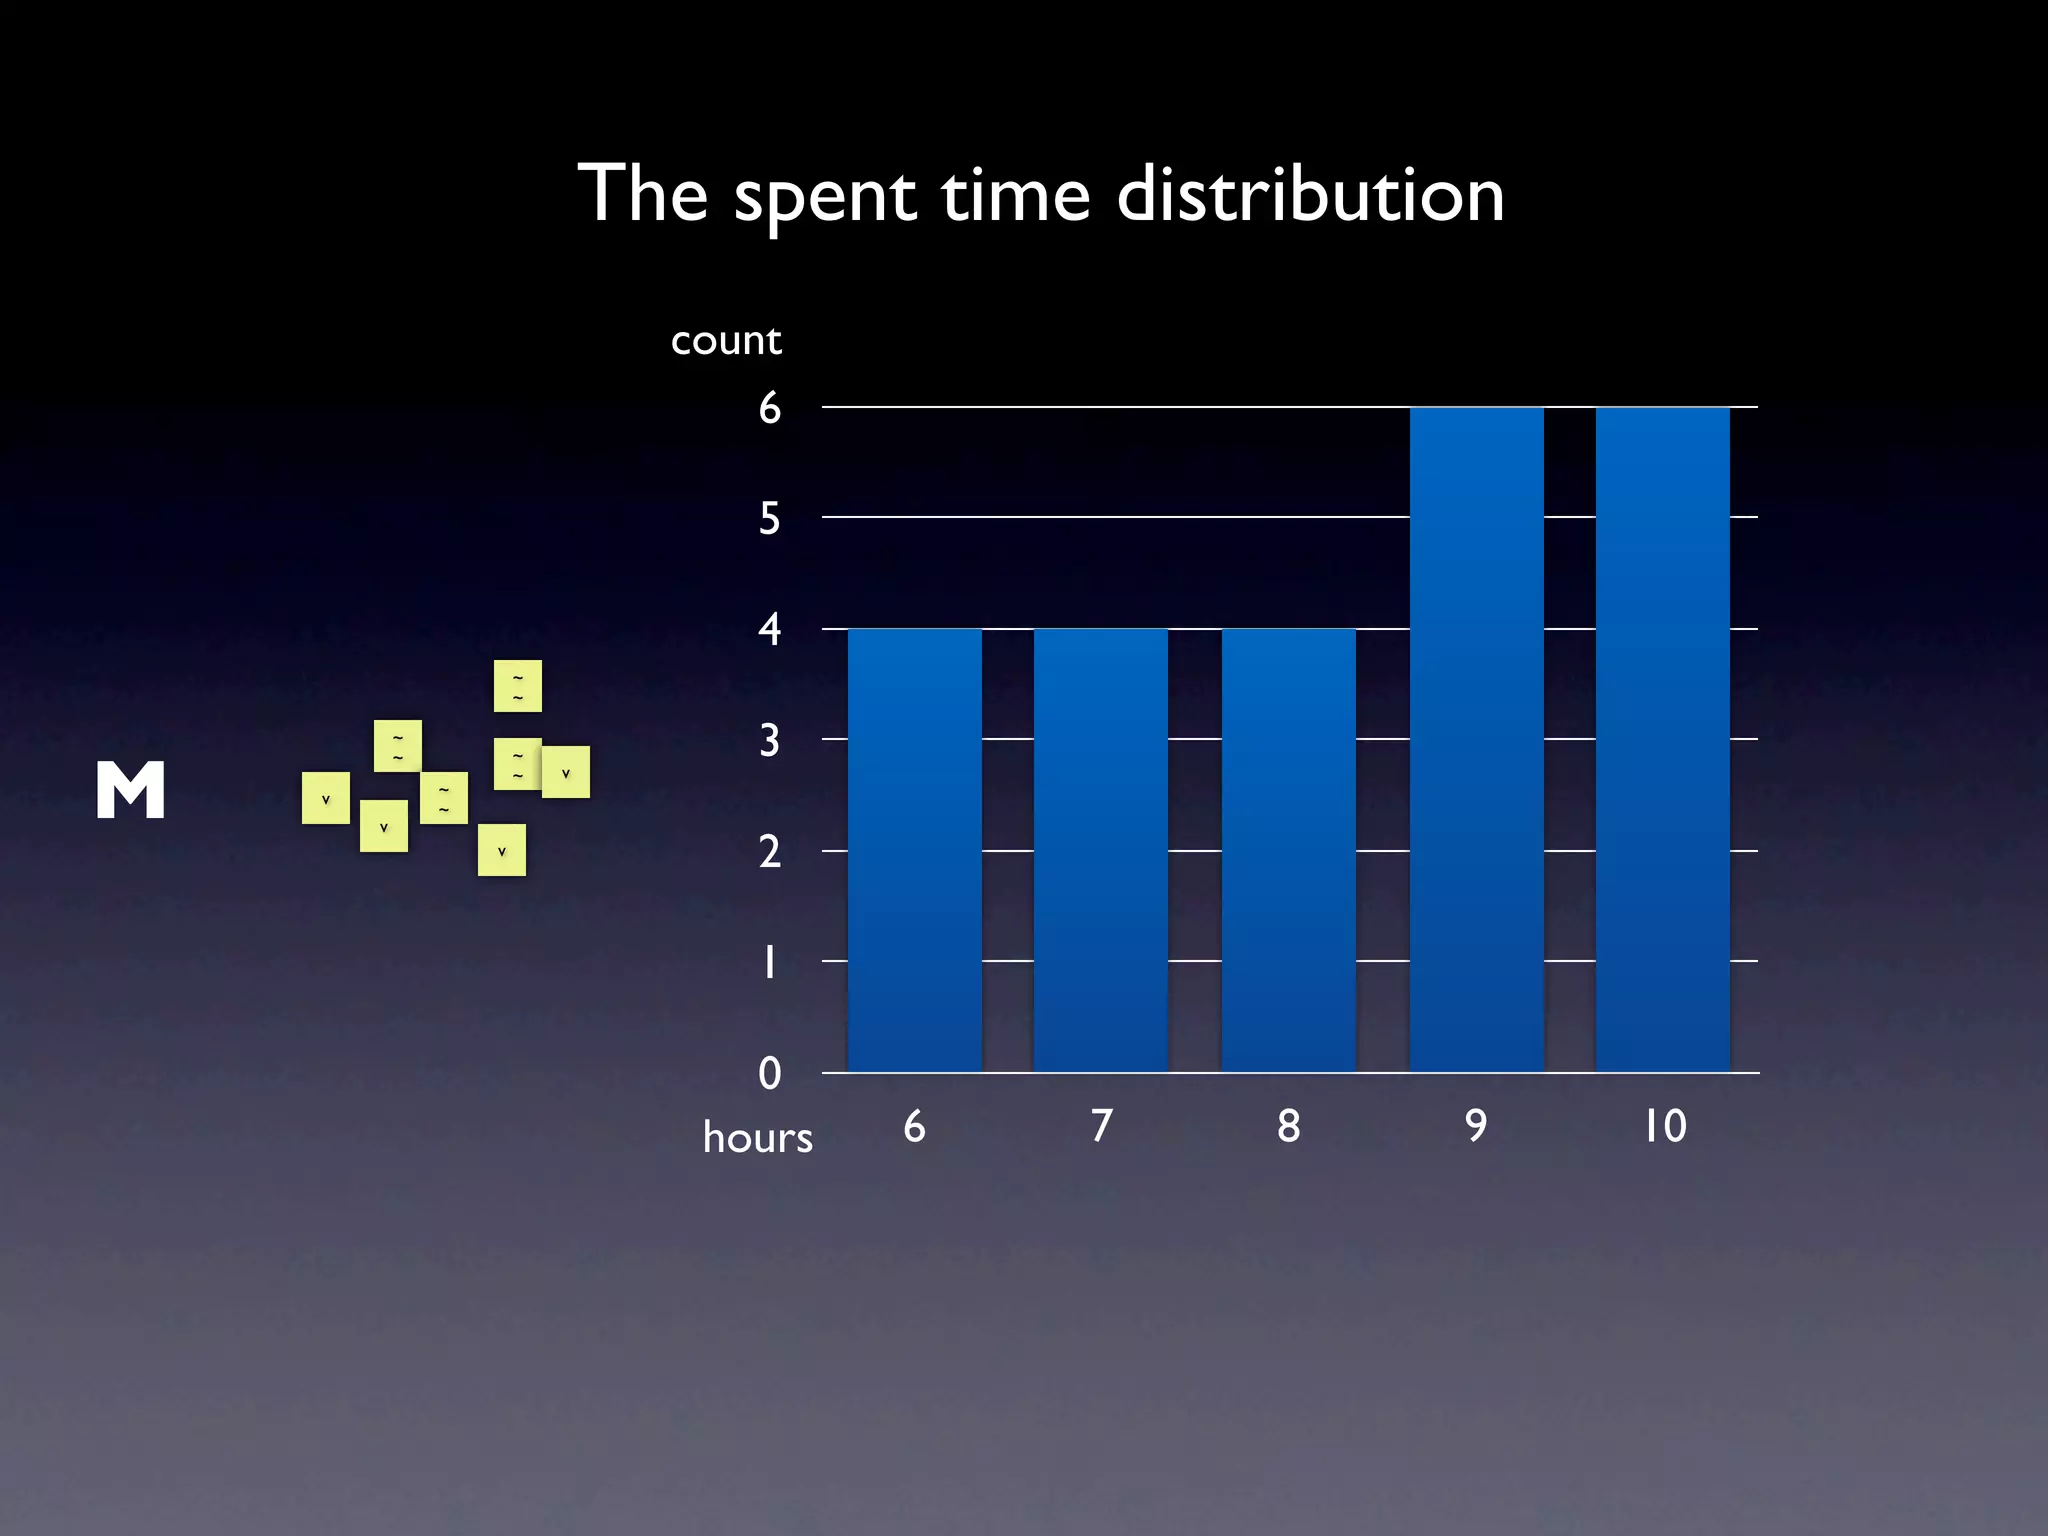
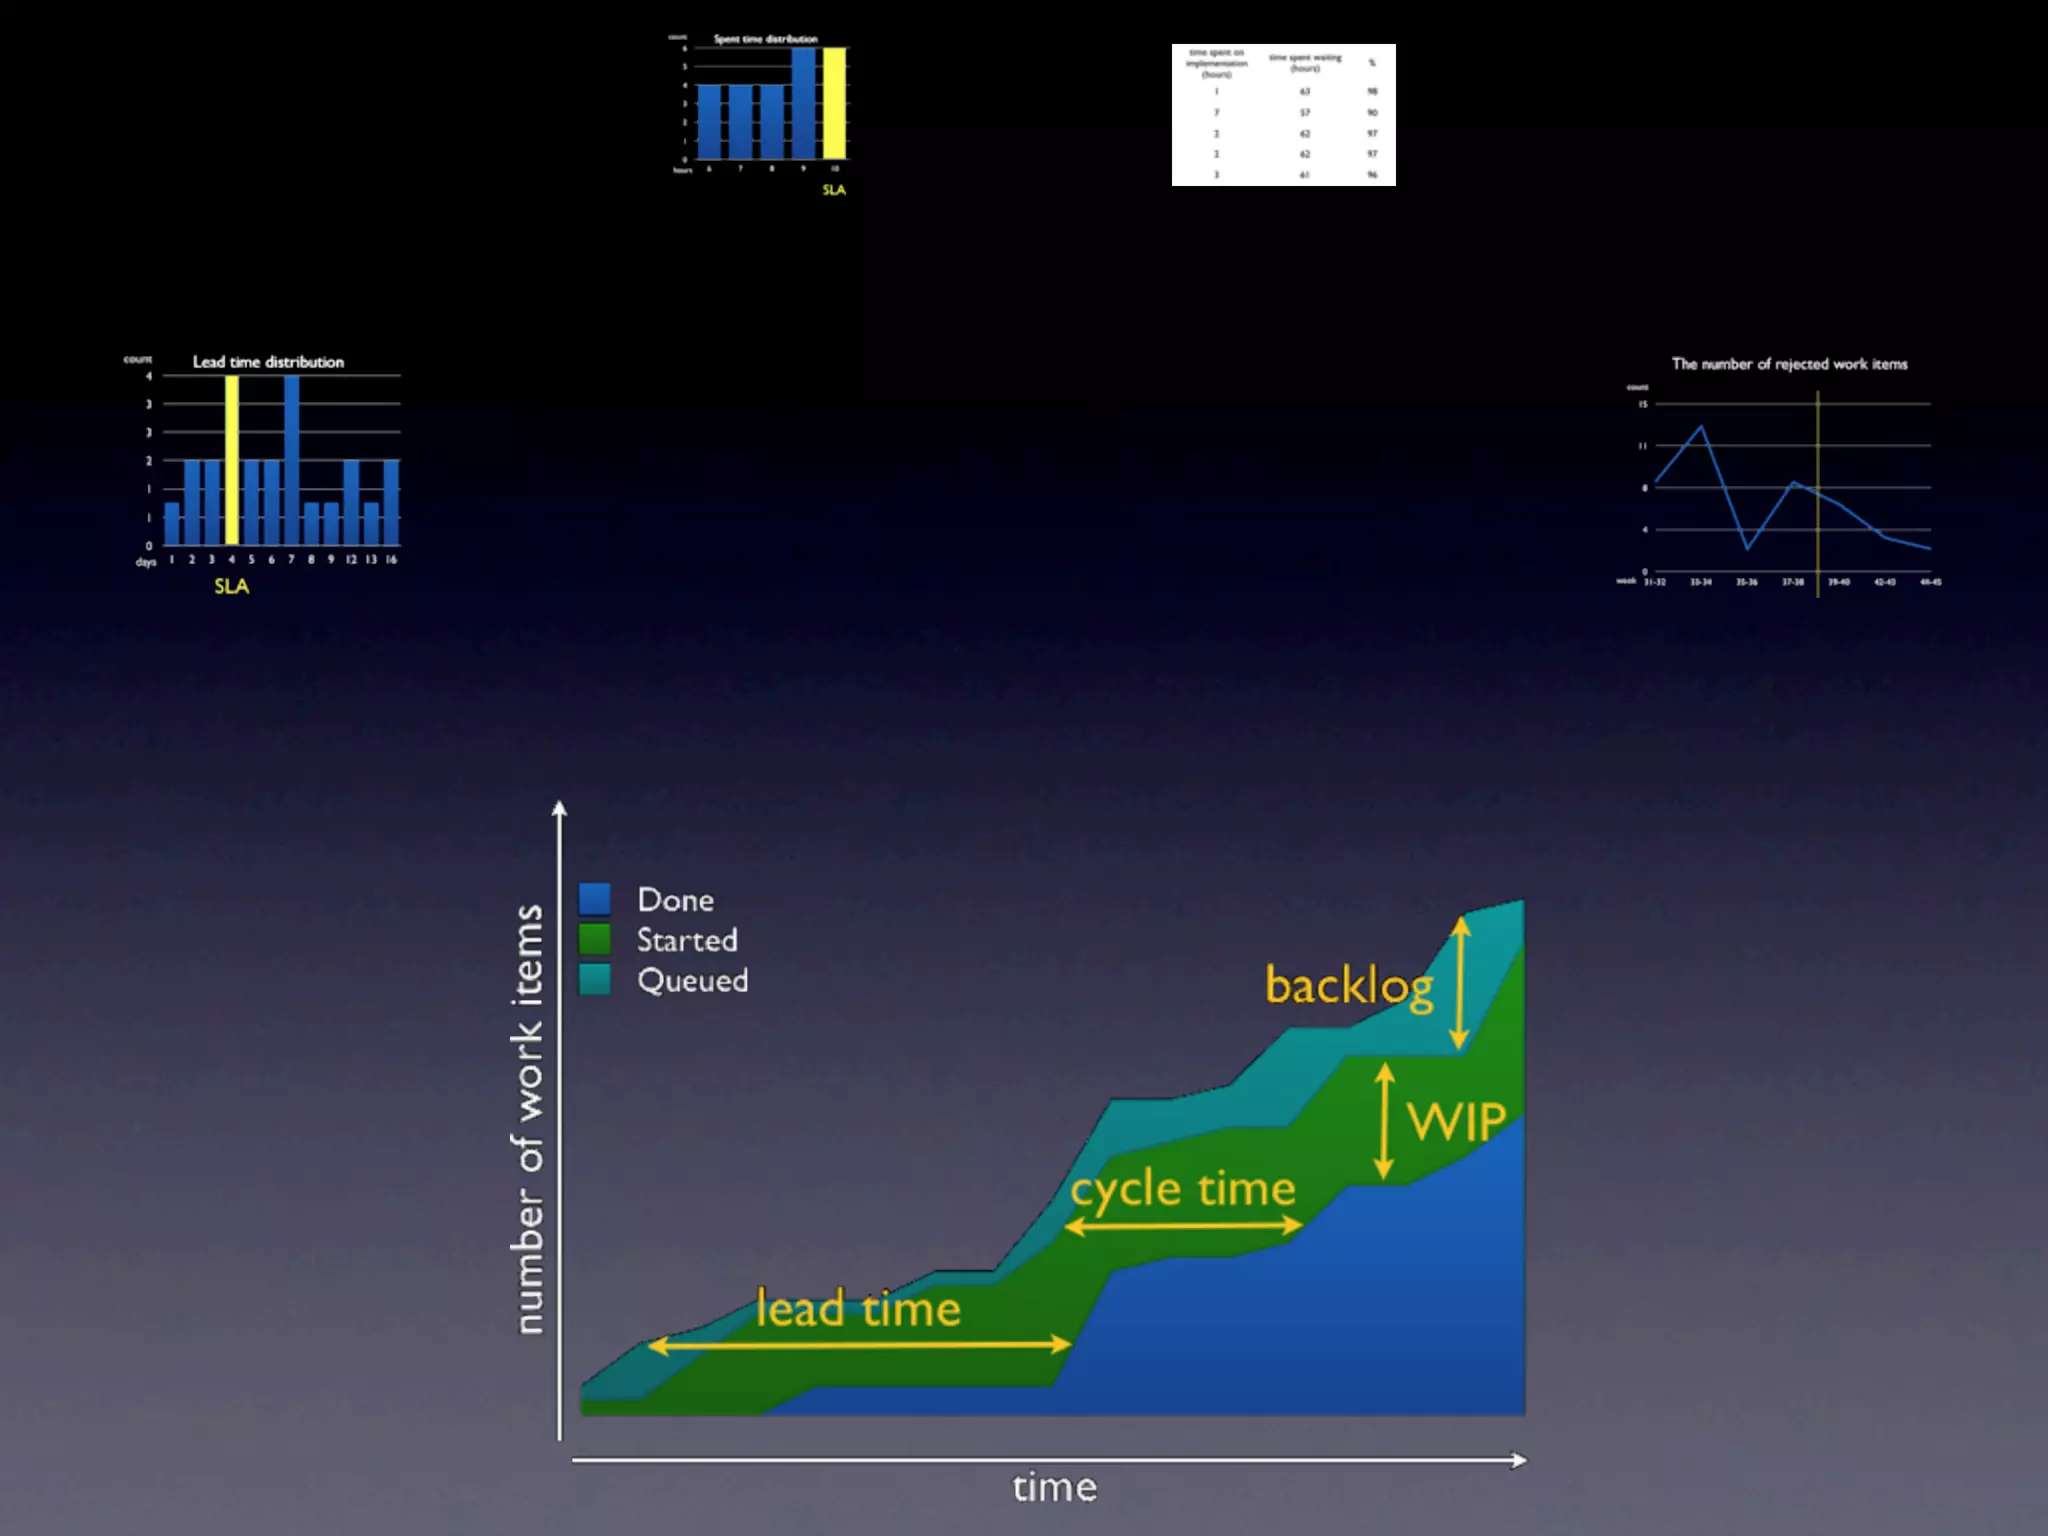
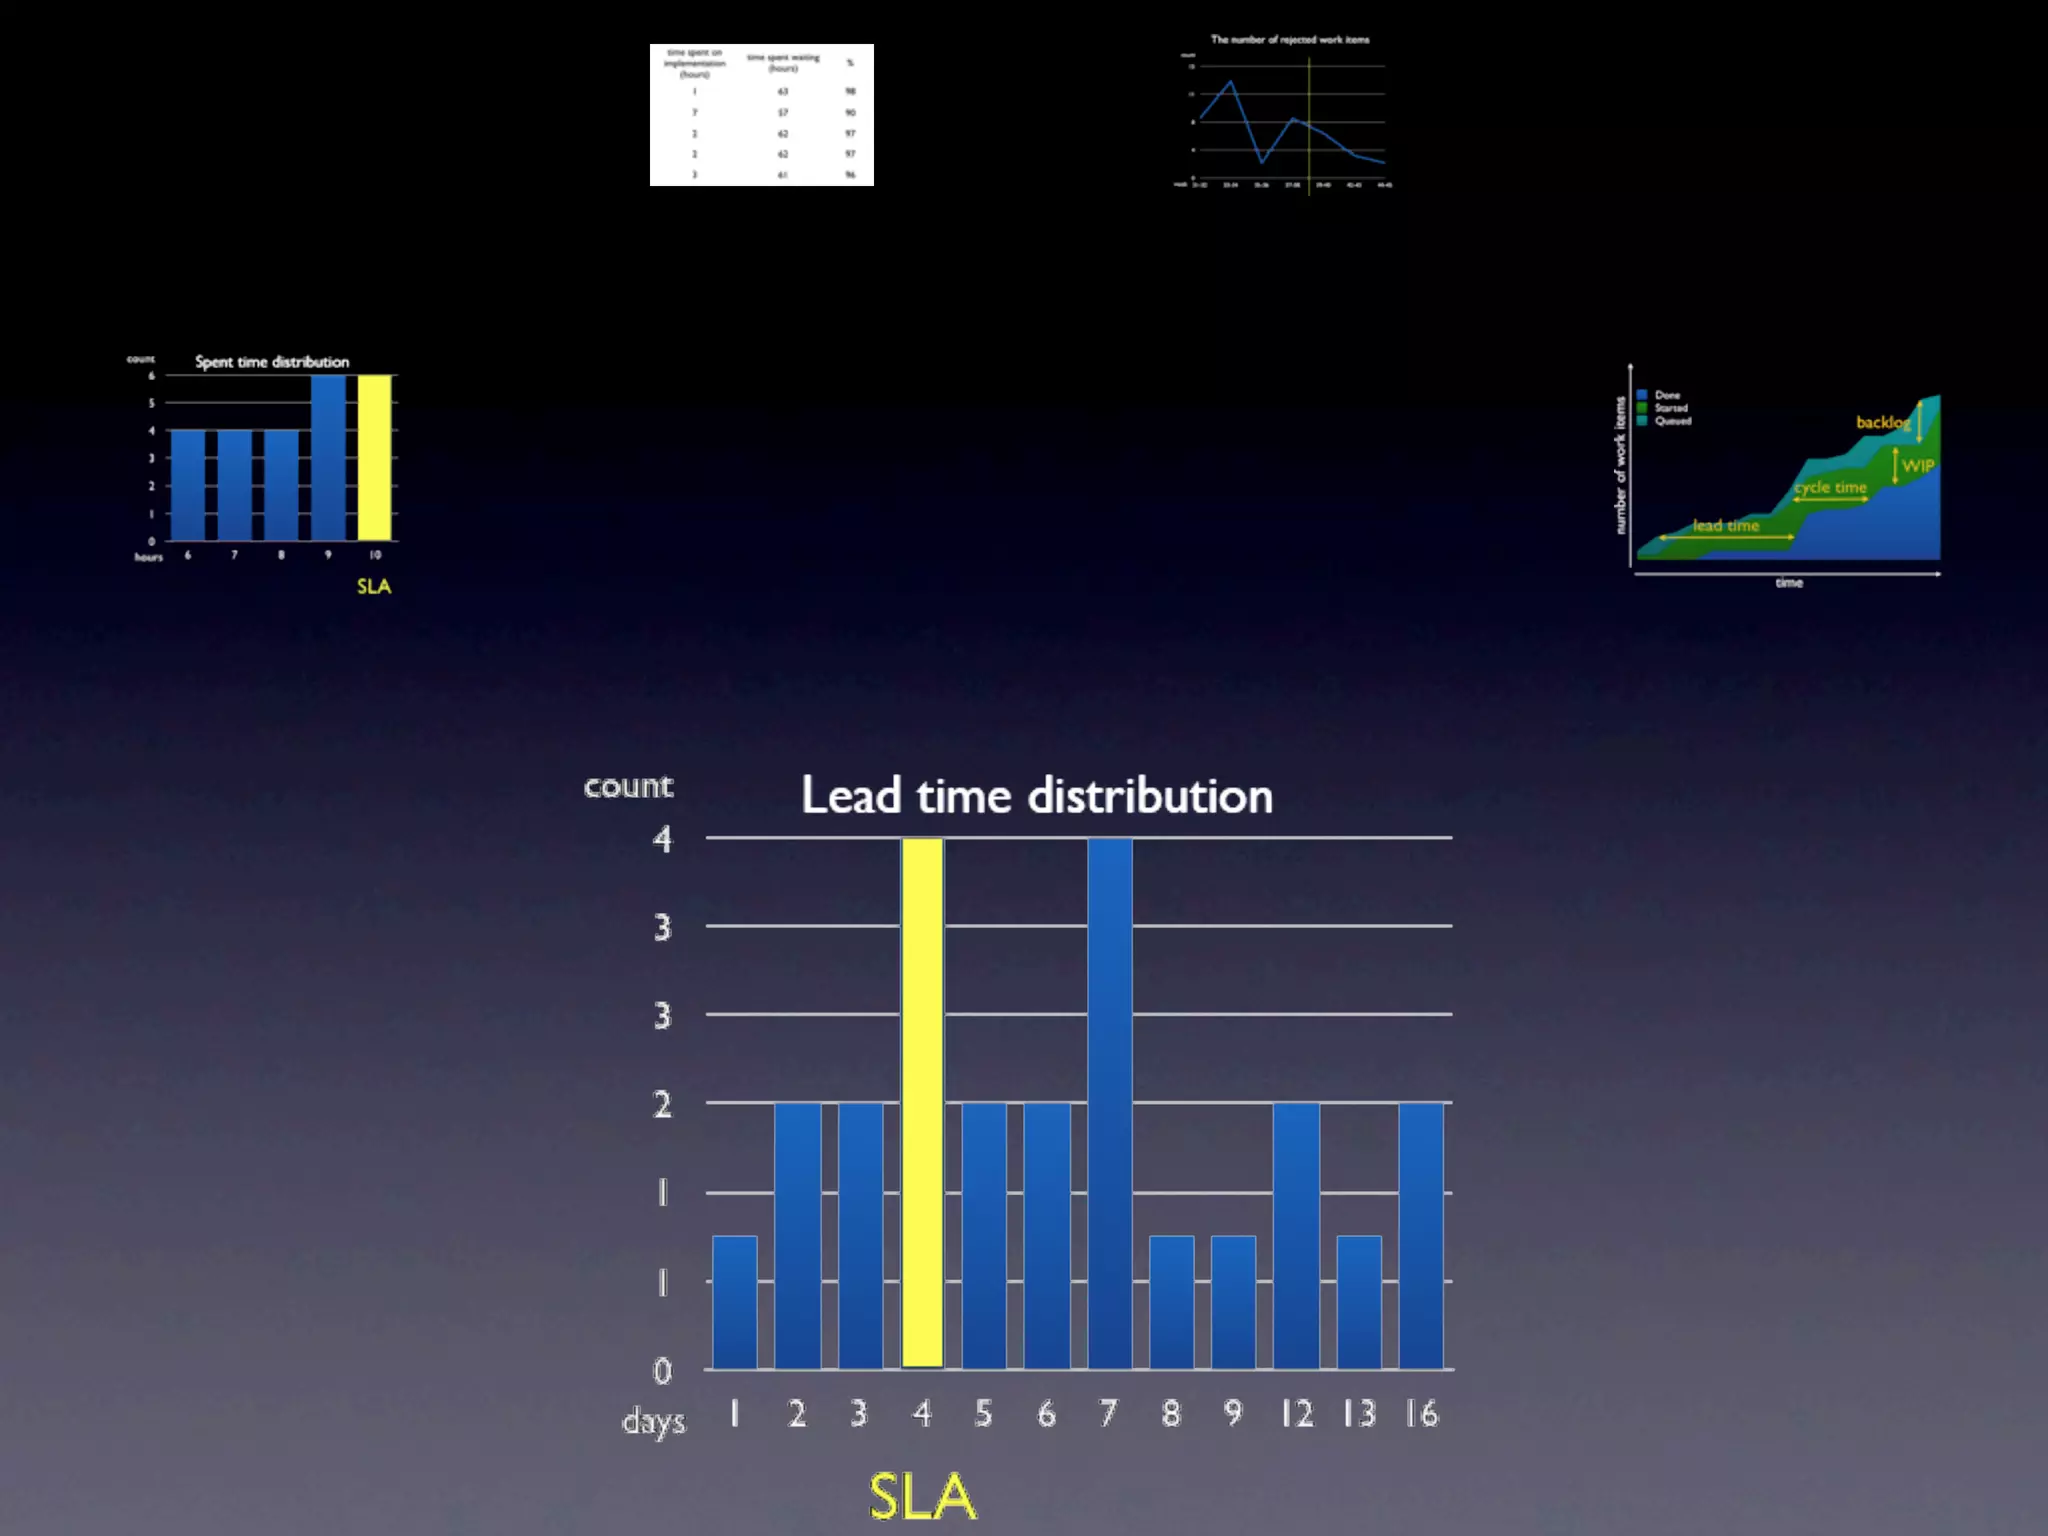
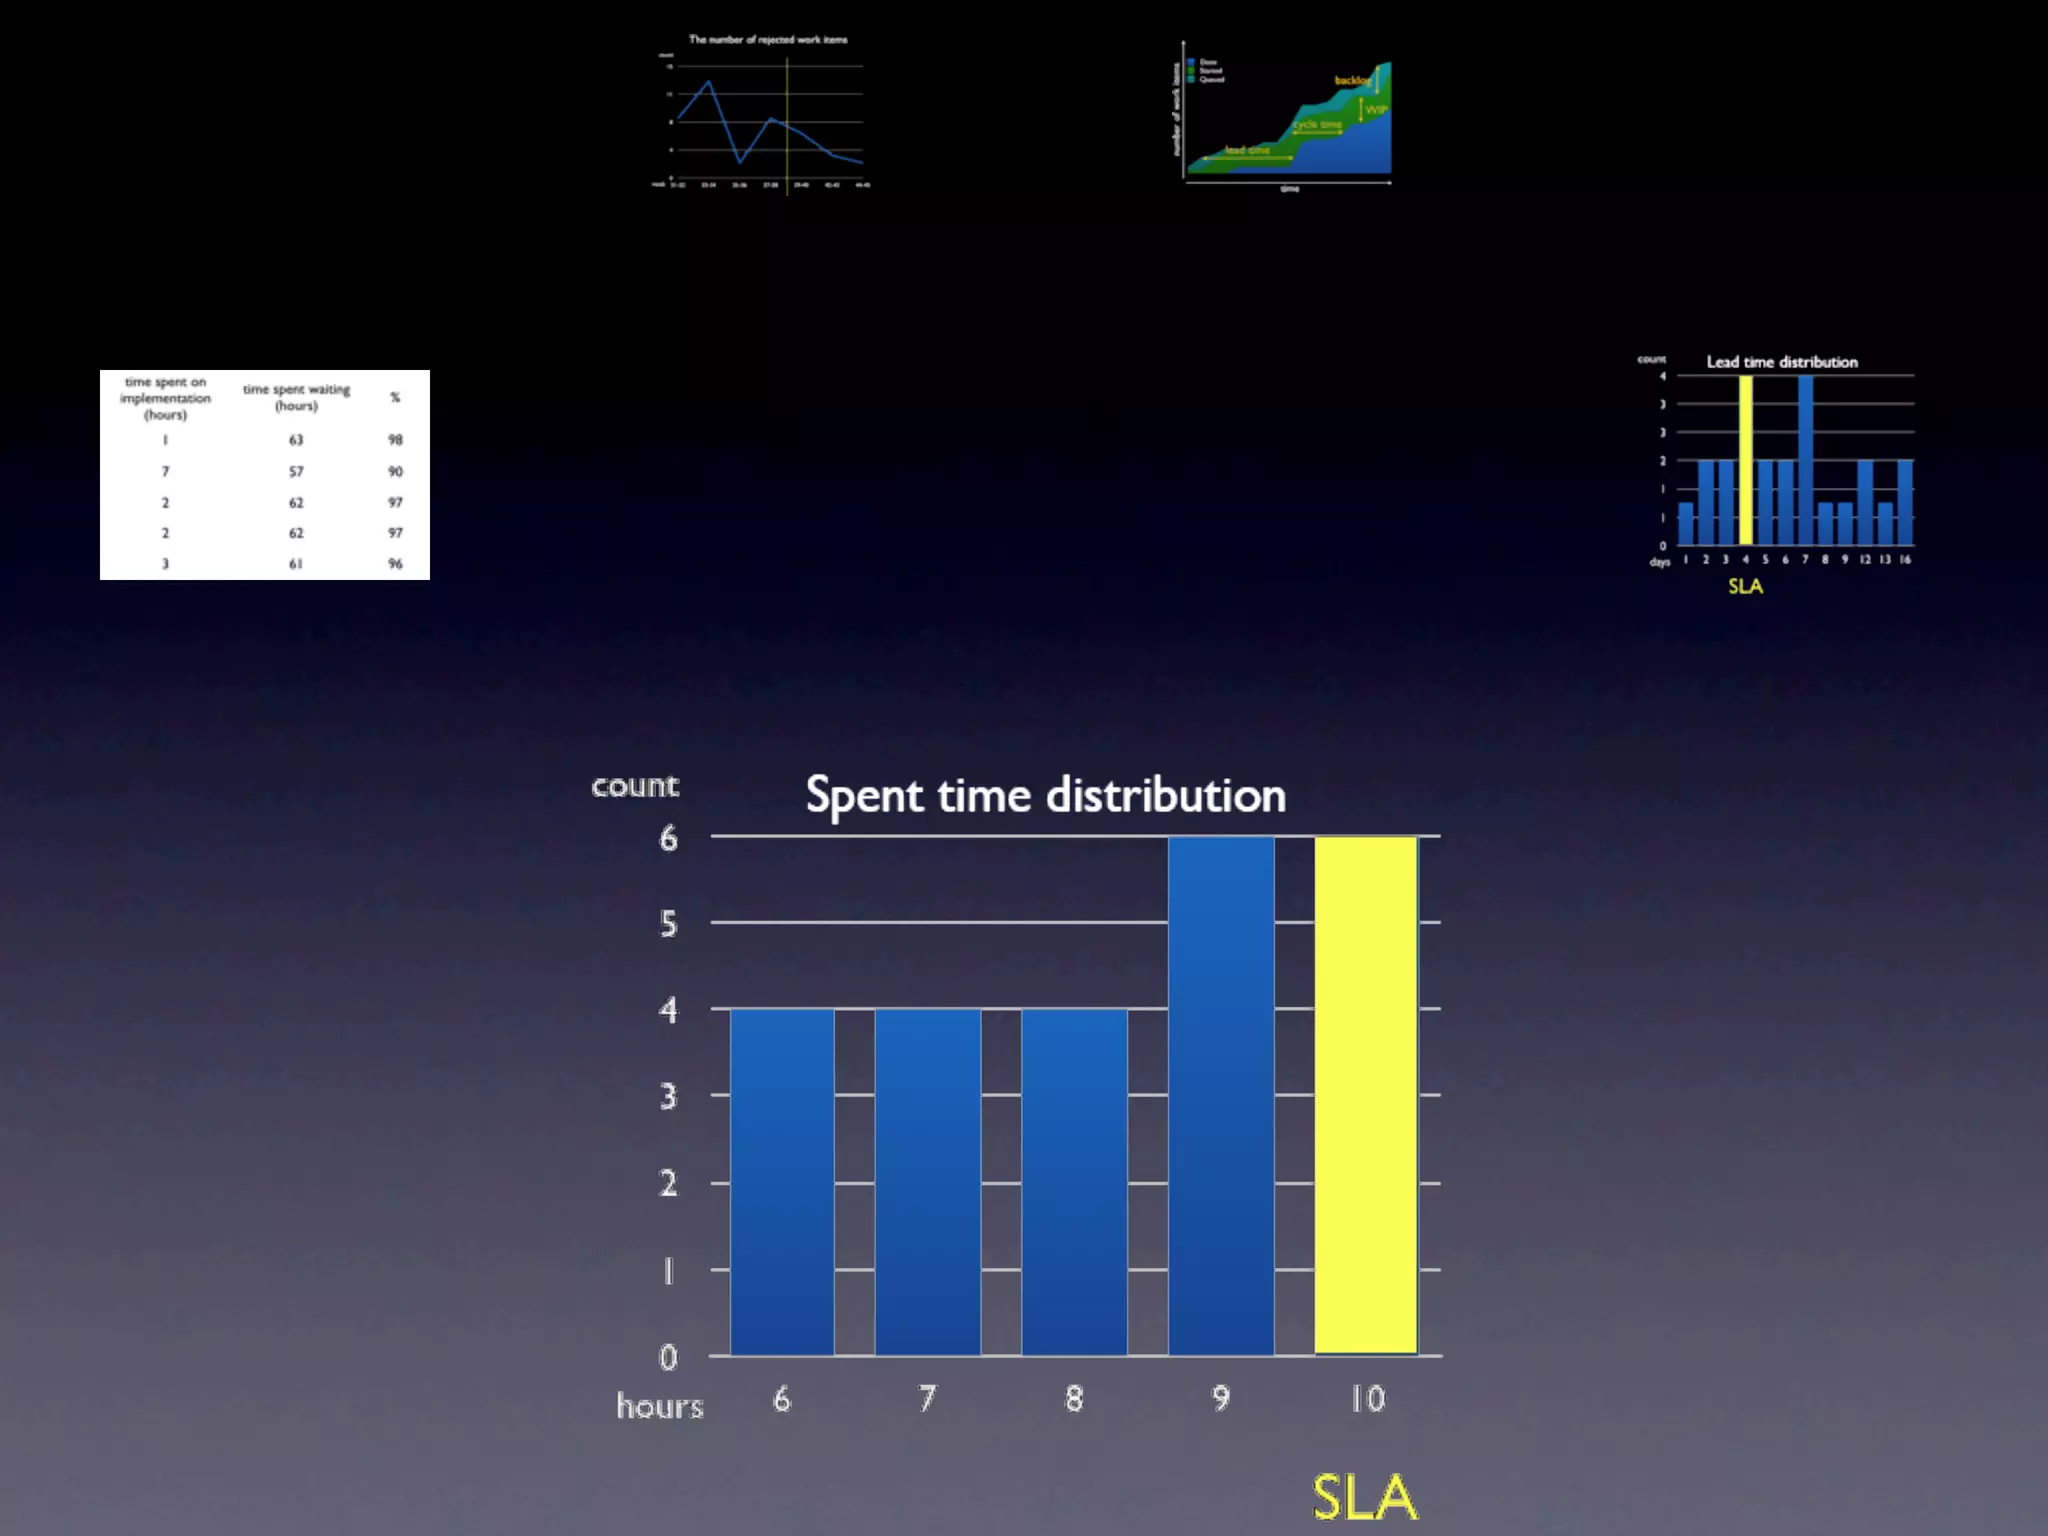
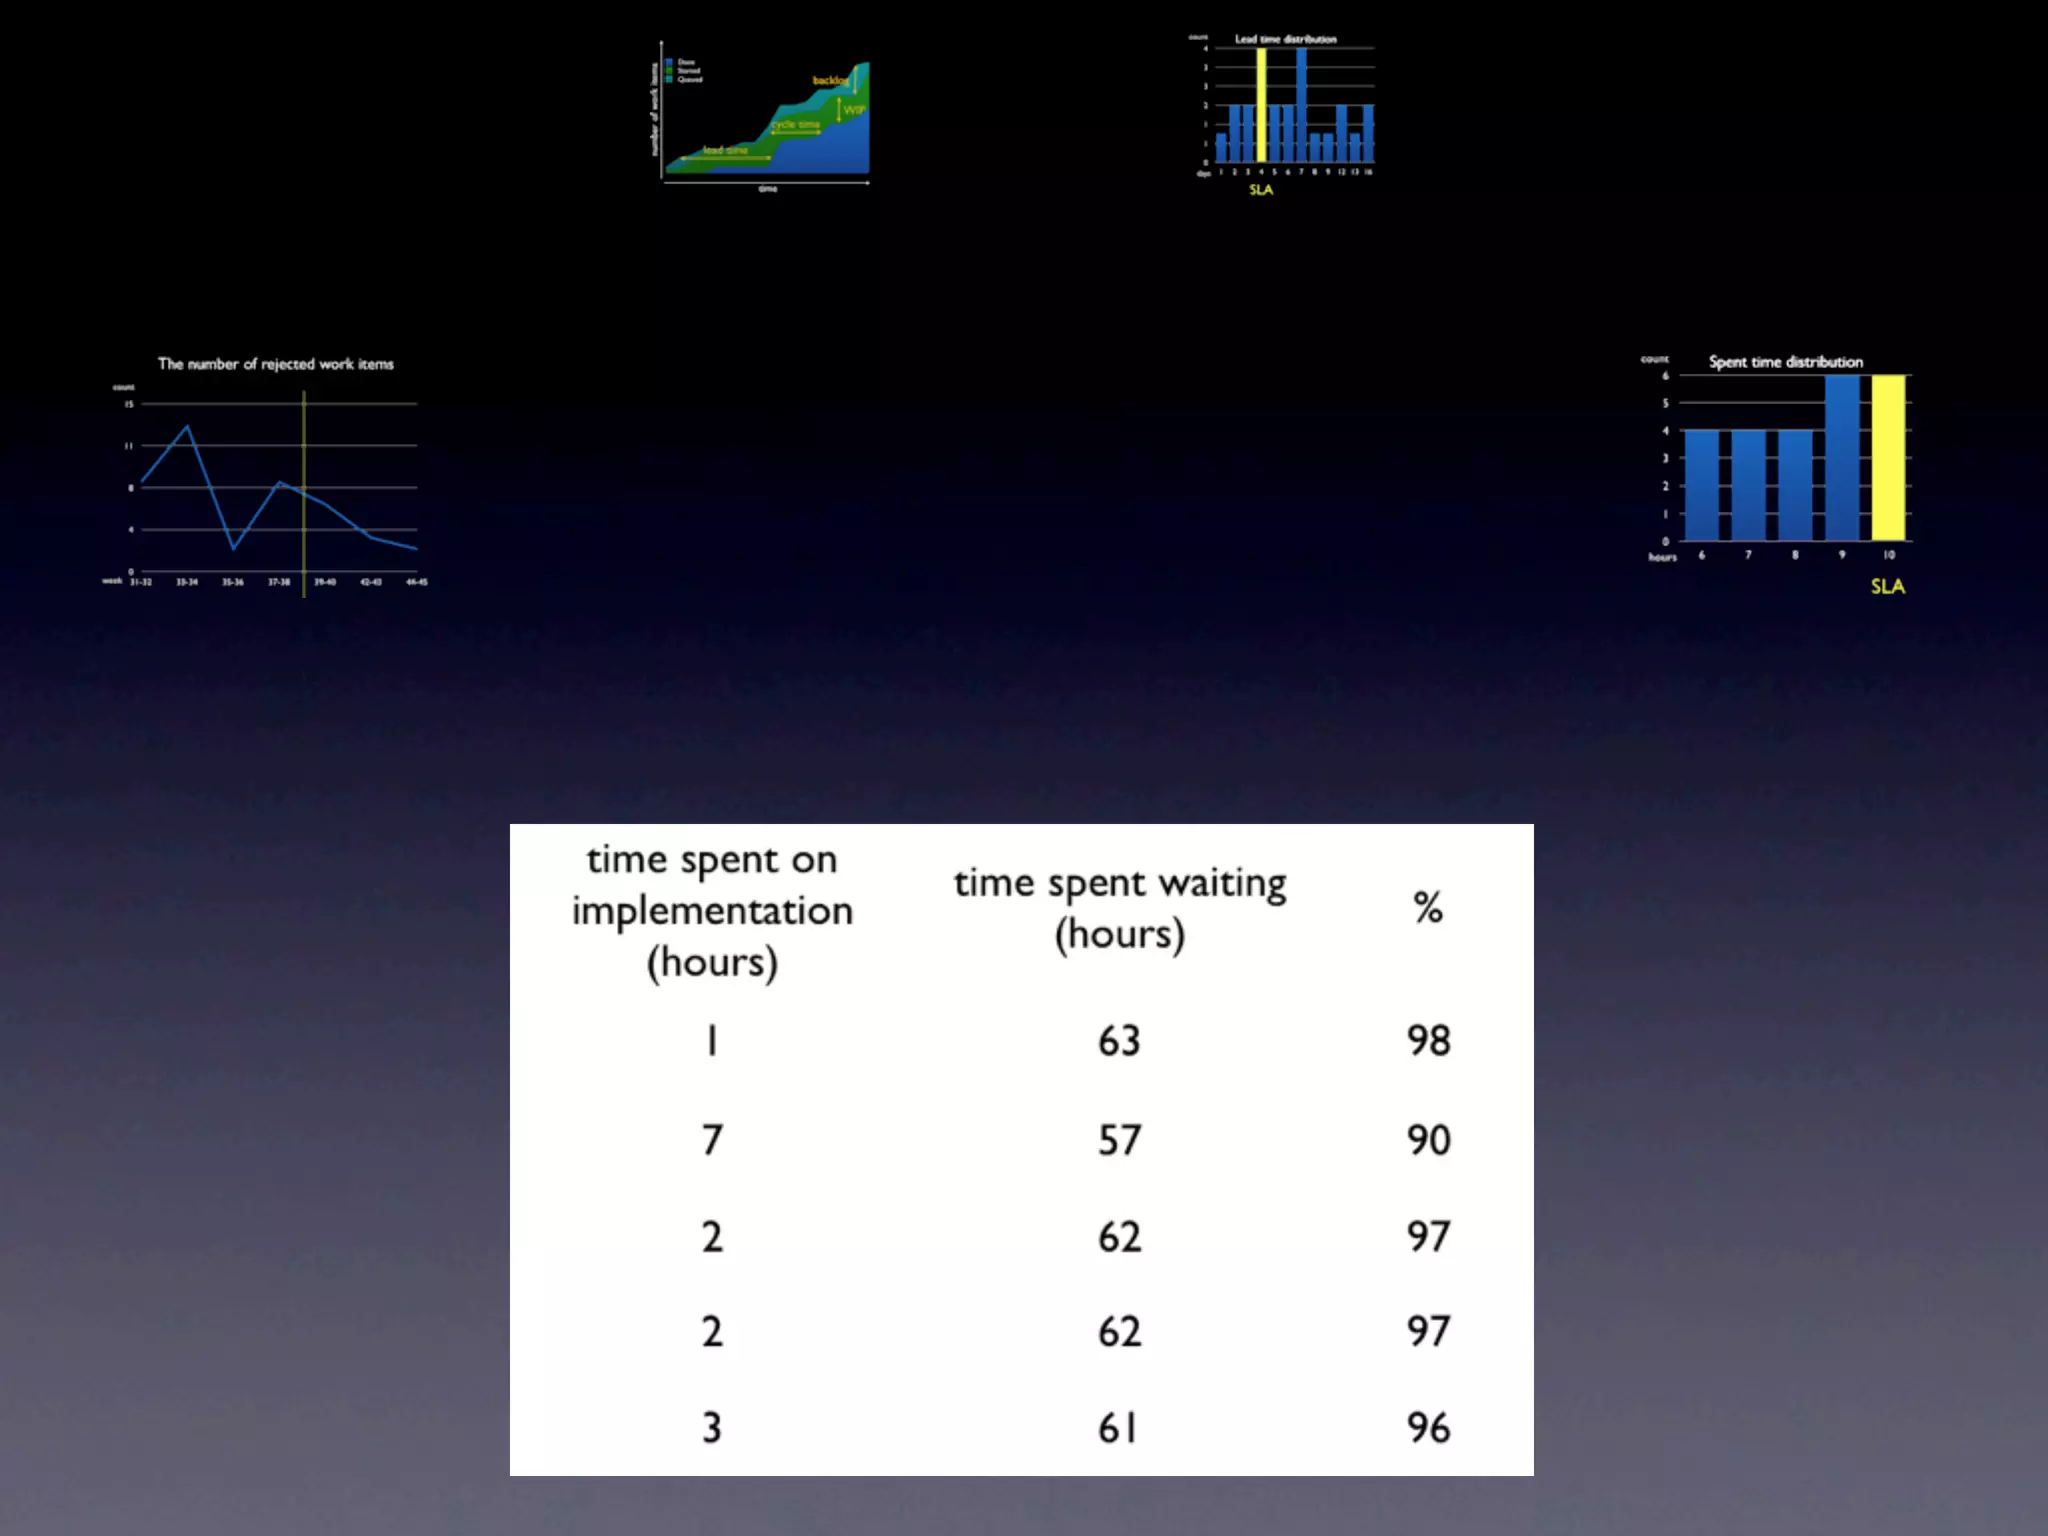
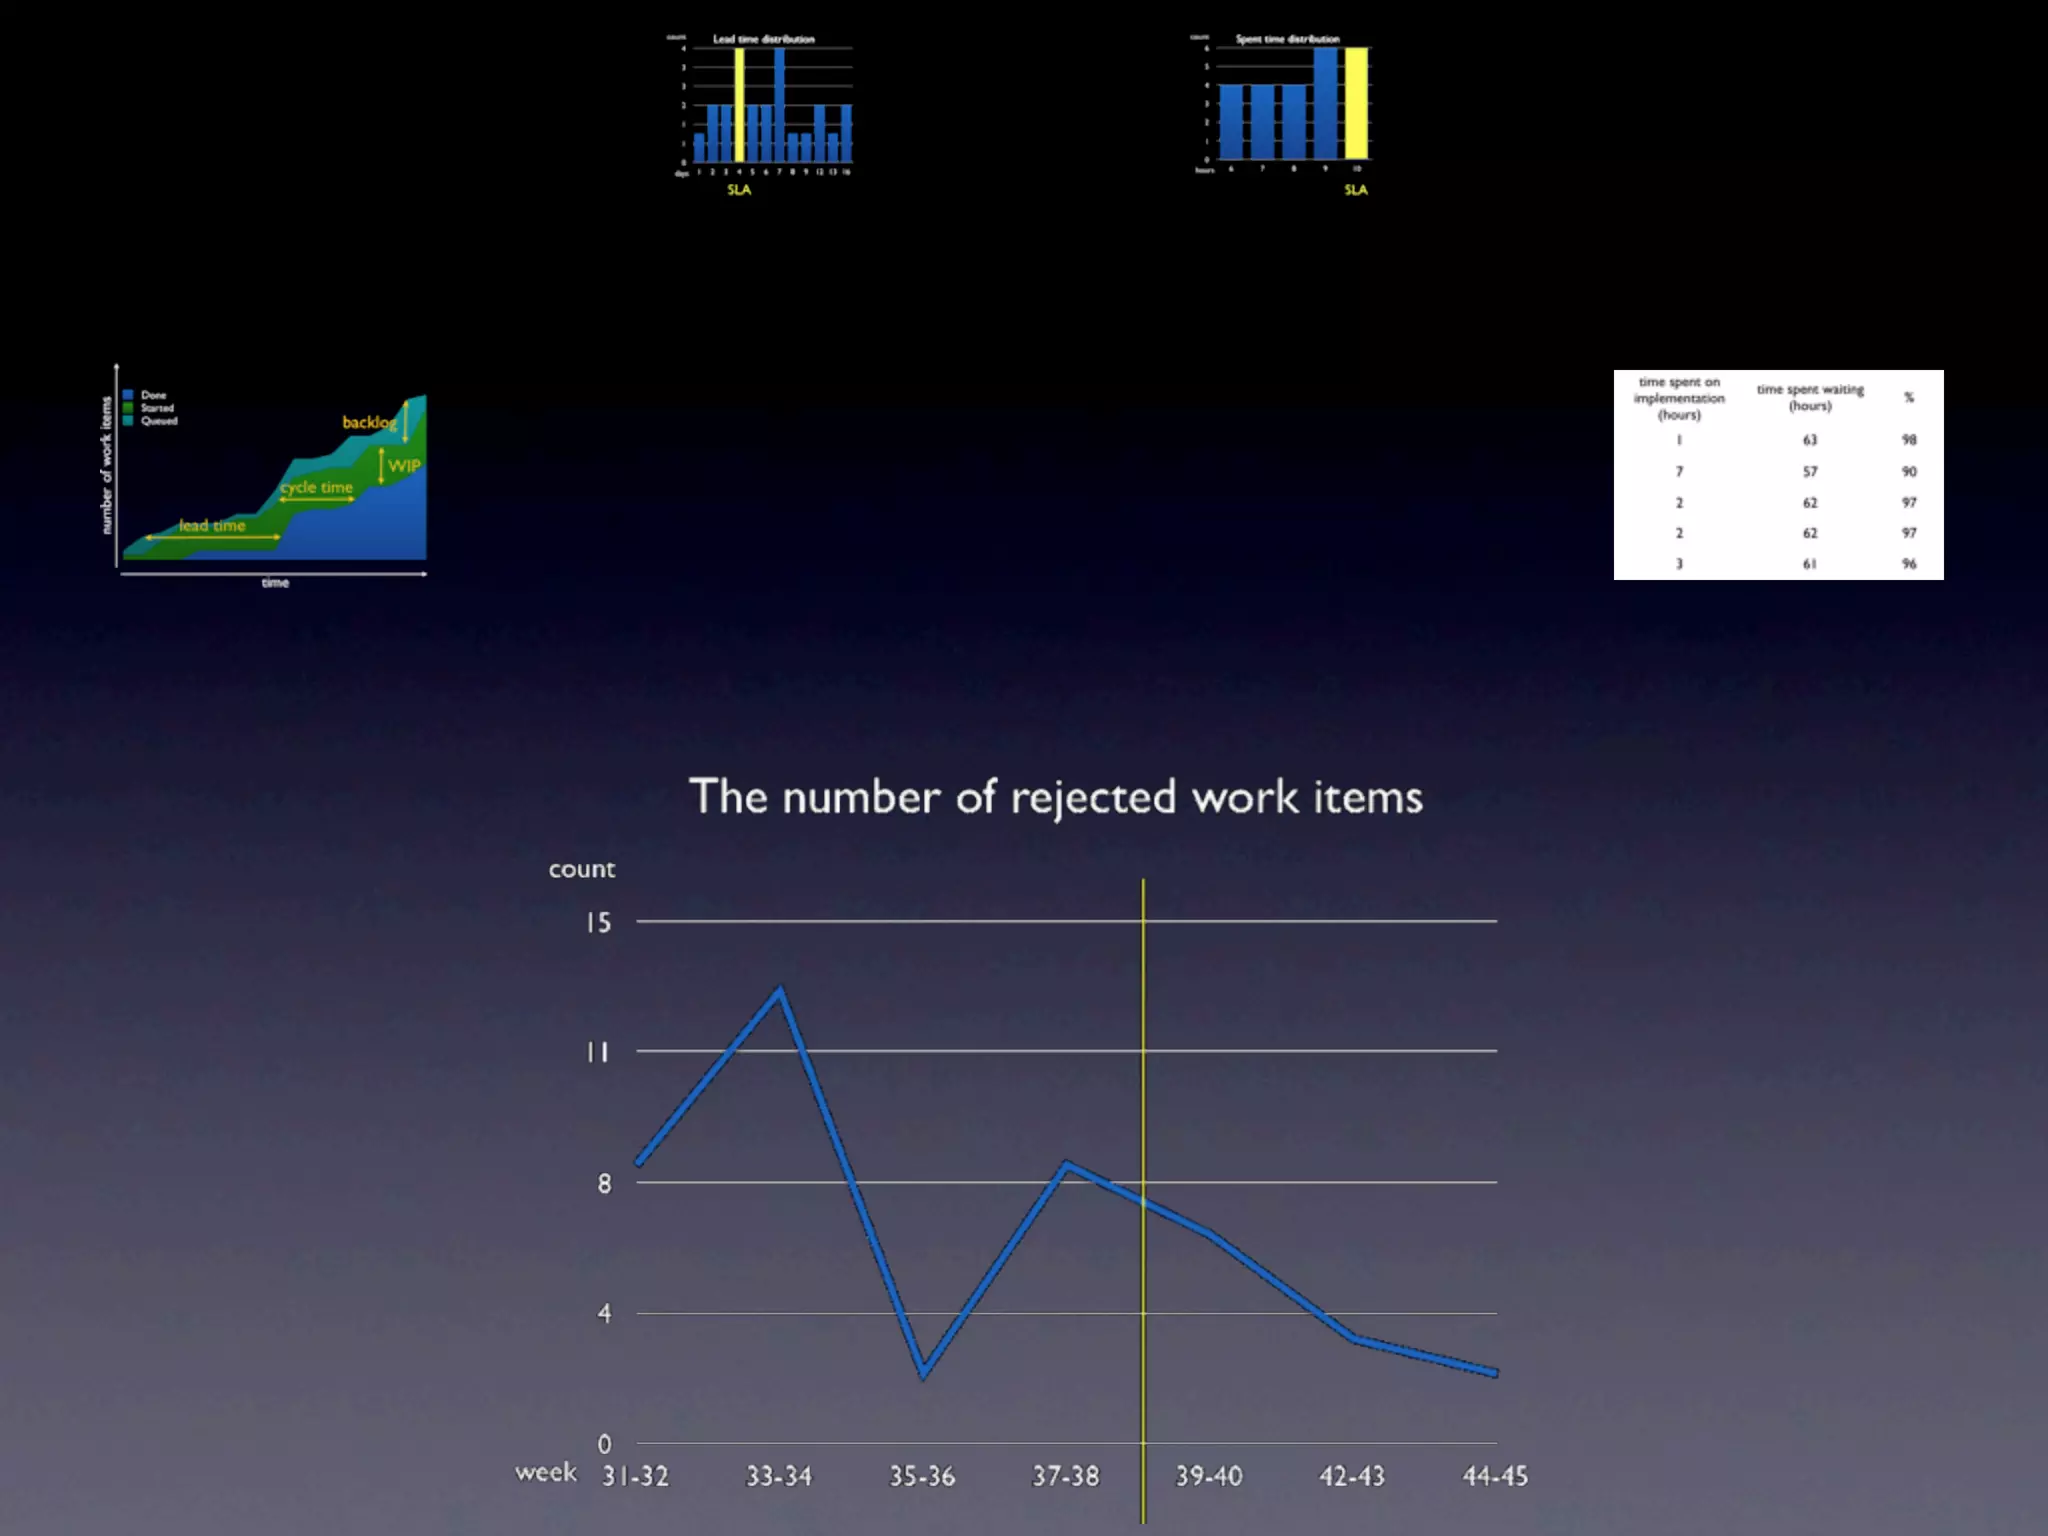
Measure and Manage Flow in Practice
              by Zsolt Fabók
                June 12th, 2012


@ZsoltFabok                       http://zsoltfabok.com
“Fast predictable deliveries and continuously
 improving products are the basis of a good
               client-customer relationship.”
There are several ways to do this...
... and today I’m going to show you how
understanding the “flow” can help you do it.
Definition of the production flow:

 “The movement of the products within the shop during
 each stage of the parts manufacturing process.”


http://www.toolingu.com/definition-900130-12169-product-flow.html
A very simple software development flow:

                        Customer


         Design
           ~
           ~                    Test
                                   ~
                                   ~


               Implementation
                ~          ~
                                          Delivery
                ~          ~

                                             ~
                                             ~
Benefits of understanding the whole flow:


 ‣Decisions are based on facts and objective data
  (no more guessing or assuming)


 ‣The improvements are serving the global vision
  (no more local optimization)
Working with the whole flow is not easy...
...but Kanban is a great method to do it.
Customer


Design
  ~
  ~                    Test
                          ~
                          ~


      Implementation
       ~          ~
                              Delivery
       ~          ~

                                 ~
                                 ~
1             2         1       1
Queue Design Implementation Test       Delivery Done
                       Customer


        Design
          ~
          ~                     Test
                                  ~
                                  ~


              Implementation
               ~            ~
                                        Delivery
               ~            ~

                                              ~
                                              ~
The five core principles of Kanban*


* based on David J. Anderson’s Kanban
The five core principles of Kanban*


   Q                     D              Visualize workflow
   ~     ~   ~   ~   ~    ~
   ~     ~   ~   ~   ~    ~


   ~         ~       ~    ~
   ~         ~       ~    ~


   ~         ~
   ~         ~

   ~
   ~


* based on David J. Anderson’s Kanban
The five core principles of Kanban*


   Q    3    4   1   2   D              Visualize workflow
   ~
   ~
         ~
         ~
             ~
             ~
                 ~
                 ~
                     ~
                     ~
                          ~
                          ~
                                        Limit work in progress
   ~         ~       ~    ~
   ~         ~       ~    ~


   ~         ~
   ~         ~

   ~
   ~


* based on David J. Anderson’s Kanban
The five core principles of Kanban*


   Q    3    4    1      2   D          Visualize workflow
   ~
   ~
         ~
         ~
              ~
              ~
                  ~
                  ~
                         ~
                         ~
                             ~
                             ~
                                        Limit work in progress
   ~          ~          ~   ~


                                        Measure and manage flow
   ~          ~          ~   ~


   ~          ~
   ~          ~

   ~
   ~


             lead time


* based on David J. Anderson’s Kanban
The five core principles of Kanban*


   Q    3    4    1      2   D          Visualize workflow
   ~
   ~
         ~
         ~
              ~
              ~
                  ~
                  ~
                         ~
                         ~
                             ~
                             ~
                                        Limit work in progress
   ~          ~          ~   ~


                                        Measure and manage flow
   ~          ~          ~   ~


   ~          ~
   ~          ~

   ~
   ~


        cycle time
             lead time


* based on David J. Anderson’s Kanban
The five core principles of Kanban*


   Q    3    4    1      2   D                Visualize workflow
   ~
   ~
         ~
         ~
              ~
              ~
                  ~
                  ~
                         ~
                         ~
                             ~
                             ~
                                              Limit work in progress
   ~          ~          ~   ~


                                              Measure and manage flow
   ~          ~          ~   ~


   ~          ~
   ~          ~

   ~
   ~


        cycle time               throughput
             lead time


* based on David J. Anderson’s Kanban
The five core principles of Kanban*


   Q    3    4    1      2   D                Visualize workflow
   ~
   ~
         ~
         ~
              ~
              ~
                  ~
                  ~
                         ~
                         ~
                             ~
                             ~
                                              Limit work in progress
   ~          ~          ~   ~


                                              Measure and manage flow
   ~          ~          ~   ~


   ~          ~
   ~          ~

   ~
   ~                                          Make process policies explicit
                                              Improve collaboratively
        cycle time               throughput
             lead time


* based on David J. Anderson’s Kanban
Our former
         Kanban board


The image is the courtesy of Digital Natives
That was the way we manage the whole flow,
      and this is how we measure it:
The Cumulative Flow Diagram


                       Done
number of work items


                       Started
                       Queued


                                     time
The Cumulative Flow Diagram


                       Done
number of work items


                       Started
                       Queued


                                 lead time


                                             time
The Cumulative Flow Diagram


                       Done
number of work items


                       Started
                       Queued


                                               cycle time

                                 lead time


                                             time
The Cumulative Flow Diagram


                       Done
number of work items


                       Started
                       Queued


                                                            WIP
                                               cycle time

                                 lead time


                                             time
The Cumulative Flow Diagram


                       Done
number of work items


                       Started
                       Queued                          backlog

                                                            WIP
                                               cycle time

                                 lead time


                                             time
The simplest way of collecting data:


       Q    3   4   1   2   D
        ~   ~   ~   ~   ~   ~
        ~   ~   ~   ~   ~   ~


        ~       ~       ~   ~
        ~       ~       ~   ~


        ~       ~
        ~       ~

        ~
        ~
Enough with the boring theoretical stuff!
The story of a real project
            Done
            Started
            Queued


The collected data is the courtesy of Digital Natives
4 short stories...
fast and predictable deliveries
                                                          #3 Still too many open items
                     #4 Being predictable


               #2 It takes too much time
4 short stories...


                     #1 Too many open items
# 1 Too many open items
WIP


Work items were waiting for
somebody who could test them...
# 2 It takes too much time to deliver
CFD is not much help here...


                               lead time
Distribution of lead times

          count
             15

            13

            10

             8

             5

average      3
median*
              0
           days 1 3 5 7 9 11 13 15 22 33


                          *Calculation of medians is a popular technique in summary statistics and summarizing
                          statistical data, since it is simple to understand and easy to calculate, while also giving a
                          measure that is more robust in the presence of outlier values than is the mean. Wikipedia
Some examples of work items with 8-day lead time

     time spent on
                      time spent waiting
    implementation ID description
                  #                        %
                           (hours)
        (hours)
          1                   63           98

          7                   57           90

          2                   62           97

          2                   62           97

          3                   61           96
95%
waste
Distribution of lead times
                  Before
count
   15

  13

  10

   8

   5

   3

    0
 days 1 3 5 7 9 11 13 15 22 33


        average
        median
Distribution of lead times
                  Before                          After
count                               count
   15                                  15

  13                                  13

  10                                  10

   8                                   8

   5                                   5

   3                                   3

    0                                   0
 days 1 3 5 7 9 11 13 15 22 33       days 1   3   5   7   9 11 13 22

        average
        median
# 3 Still too many open work items
How many times
  the item has
 been rejected
Number of rejected work items
  count
    15


    11


     8


     4


     0
week 31-32   33-34   35-36   37-38
Number of rejected work items
  count
    15


    11


     8


     4


     0
week 31-32   33-34   35-36   37-38   39-40   42-43   44-45
#4 Being predictable
Sales: “I want to know when the
new features can hit the market!”


Management: “I want to know how
much it will cost me!”
All the work items we had so far
        (~20 work items)


                        v

            ~                    v       ~
            ~               ~        v   ~
                    v       ~
                        v
                                         ~
                            v                v
                ~                        ~
                ~            ~
                             ~
                                         v
Categorizing them into three groups

       S
                                  v
                  ~
                  ~
                          v


                                          ~
                                          ~

                      ~


       M
                      ~                   ~
                                          ~   v
              v               ~
                              ~
                  v
                                      v


       L
                      ~
                                  v
                      ~

                              v
The lead time distribution
                                  count
                                      4

                                     3

                                     3
                        ~
                        ~

            ~
                                     2
M
            ~           ~
                        ~   v
    v           ~
                ~
        v
                    v
                                     1

                                     1

                                      0
                                    days   1   2   3   4   5   6   7   8   9 12 13 16

                                                   SLA
The spent time distribution
                                  count
                                      6

                                     5

                                     4
                        ~
                        ~

            ~
                                     3
M
            ~           ~
                        ~   v
    v           ~
                ~
        v
                    v
                                     2

                                     1

                                     0
                                   hours   6   7    8    9    10
The spent time distribution
                                  count
                                      6

                                     5

                                     4
                        ~
                        ~

            ~
                                     3
M
            ~           ~
                        ~   v
    v           ~
                ~
        v
                    v
                                     2

                                     1

                                     0
                                   hours   6   7    8    9     10

                                                              SLA
+1 Pressure won’t make a difference
#2 Nothing changed. Still the
                 same ratio


#1 We decided that we would
  force ourselves to be faster
Thank you very much for your attention!


http://zsoltfabok.com/          me@zsoltfabok.com

Targu Mures - Measure and Manage Flow in Practice

  • 1.
    Measure and ManageFlow in Practice by Zsolt Fabók June 12th, 2012 @ZsoltFabok http://zsoltfabok.com
  • 2.
    “Fast predictable deliveriesand continuously improving products are the basis of a good client-customer relationship.”
  • 3.
    There are severalways to do this...
  • 4.
    ... and todayI’m going to show you how understanding the “flow” can help you do it.
  • 5.
    Definition of theproduction flow: “The movement of the products within the shop during each stage of the parts manufacturing process.” http://www.toolingu.com/definition-900130-12169-product-flow.html
  • 6.
    A very simplesoftware development flow: Customer Design ~ ~ Test ~ ~ Implementation ~ ~ Delivery ~ ~ ~ ~
  • 7.
    Benefits of understandingthe whole flow: ‣Decisions are based on facts and objective data (no more guessing or assuming) ‣The improvements are serving the global vision (no more local optimization)
  • 8.
    Working with thewhole flow is not easy...
  • 9.
    ...but Kanban isa great method to do it.
  • 10.
    Customer Design ~ ~ Test ~ ~ Implementation ~ ~ Delivery ~ ~ ~ ~
  • 11.
    1 2 1 1 Queue Design Implementation Test Delivery Done Customer Design ~ ~ Test ~ ~ Implementation ~ ~ Delivery ~ ~ ~ ~
  • 12.
    The five coreprinciples of Kanban* * based on David J. Anderson’s Kanban
  • 13.
    The five coreprinciples of Kanban* Q D Visualize workflow ~ ~ ~ ~ ~ ~ ~ ~ ~ ~ ~ ~ ~ ~ ~ ~ ~ ~ ~ ~ ~ ~ ~ ~ ~ ~ * based on David J. Anderson’s Kanban
  • 14.
    The five coreprinciples of Kanban* Q 3 4 1 2 D Visualize workflow ~ ~ ~ ~ ~ ~ ~ ~ ~ ~ ~ ~ Limit work in progress ~ ~ ~ ~ ~ ~ ~ ~ ~ ~ ~ ~ ~ ~ * based on David J. Anderson’s Kanban
  • 15.
    The five coreprinciples of Kanban* Q 3 4 1 2 D Visualize workflow ~ ~ ~ ~ ~ ~ ~ ~ ~ ~ ~ ~ Limit work in progress ~ ~ ~ ~ Measure and manage flow ~ ~ ~ ~ ~ ~ ~ ~ ~ ~ lead time * based on David J. Anderson’s Kanban
  • 16.
    The five coreprinciples of Kanban* Q 3 4 1 2 D Visualize workflow ~ ~ ~ ~ ~ ~ ~ ~ ~ ~ ~ ~ Limit work in progress ~ ~ ~ ~ Measure and manage flow ~ ~ ~ ~ ~ ~ ~ ~ ~ ~ cycle time lead time * based on David J. Anderson’s Kanban
  • 17.
    The five coreprinciples of Kanban* Q 3 4 1 2 D Visualize workflow ~ ~ ~ ~ ~ ~ ~ ~ ~ ~ ~ ~ Limit work in progress ~ ~ ~ ~ Measure and manage flow ~ ~ ~ ~ ~ ~ ~ ~ ~ ~ cycle time throughput lead time * based on David J. Anderson’s Kanban
  • 18.
    The five coreprinciples of Kanban* Q 3 4 1 2 D Visualize workflow ~ ~ ~ ~ ~ ~ ~ ~ ~ ~ ~ ~ Limit work in progress ~ ~ ~ ~ Measure and manage flow ~ ~ ~ ~ ~ ~ ~ ~ ~ ~ Make process policies explicit Improve collaboratively cycle time throughput lead time * based on David J. Anderson’s Kanban
  • 19.
    Our former Kanban board The image is the courtesy of Digital Natives
  • 20.
    That was theway we manage the whole flow, and this is how we measure it:
  • 21.
    The Cumulative FlowDiagram Done number of work items Started Queued time
  • 22.
    The Cumulative FlowDiagram Done number of work items Started Queued lead time time
  • 23.
    The Cumulative FlowDiagram Done number of work items Started Queued cycle time lead time time
  • 24.
    The Cumulative FlowDiagram Done number of work items Started Queued WIP cycle time lead time time
  • 25.
    The Cumulative FlowDiagram Done number of work items Started Queued backlog WIP cycle time lead time time
  • 26.
    The simplest wayof collecting data: Q 3 4 1 2 D ~ ~ ~ ~ ~ ~ ~ ~ ~ ~ ~ ~ ~ ~ ~ ~ ~ ~ ~ ~ ~ ~ ~ ~ ~ ~
  • 27.
    Enough with theboring theoretical stuff!
  • 28.
    The story ofa real project Done Started Queued The collected data is the courtesy of Digital Natives
  • 29.
  • 30.
    fast and predictabledeliveries #3 Still too many open items #4 Being predictable #2 It takes too much time 4 short stories... #1 Too many open items
  • 31.
    # 1 Toomany open items
  • 32.
    WIP Work items werewaiting for somebody who could test them...
  • 33.
    # 2 Ittakes too much time to deliver
  • 34.
    CFD is notmuch help here... lead time
  • 36.
    Distribution of leadtimes count 15 13 10 8 5 average 3 median* 0 days 1 3 5 7 9 11 13 15 22 33 *Calculation of medians is a popular technique in summary statistics and summarizing statistical data, since it is simple to understand and easy to calculate, while also giving a measure that is more robust in the presence of outlier values than is the mean. Wikipedia
  • 37.
    Some examples ofwork items with 8-day lead time time spent on time spent waiting implementation ID description # % (hours) (hours) 1 63 98 7 57 90 2 62 97 2 62 97 3 61 96
  • 38.
  • 39.
    Distribution of leadtimes Before count 15 13 10 8 5 3 0 days 1 3 5 7 9 11 13 15 22 33 average median
  • 40.
    Distribution of leadtimes Before After count count 15 15 13 13 10 10 8 8 5 5 3 3 0 0 days 1 3 5 7 9 11 13 15 22 33 days 1 3 5 7 9 11 13 22 average median
  • 41.
    # 3 Stilltoo many open work items
  • 42.
    How many times the item has been rejected
  • 43.
    Number of rejectedwork items count 15 11 8 4 0 week 31-32 33-34 35-36 37-38
  • 44.
    Number of rejectedwork items count 15 11 8 4 0 week 31-32 33-34 35-36 37-38 39-40 42-43 44-45
  • 45.
  • 46.
    Sales: “I wantto know when the new features can hit the market!” Management: “I want to know how much it will cost me!”
  • 47.
    All the workitems we had so far (~20 work items) v ~ v ~ ~ ~ v ~ v ~ v ~ v v ~ ~ ~ ~ ~ v
  • 48.
    Categorizing them intothree groups S v ~ ~ v ~ ~ ~ M ~ ~ ~ v v ~ ~ v v L ~ v ~ v
  • 49.
    The lead timedistribution count 4 3 3 ~ ~ ~ 2 M ~ ~ ~ v v ~ ~ v v 1 1 0 days 1 2 3 4 5 6 7 8 9 12 13 16
  • 50.
    The lead timedistribution count 4 3 3 ~ ~ ~ 2 M ~ ~ ~ v v ~ ~ v v 1 1 0 days 1 2 3 4 5 6 7 8 9 12 13 16
  • 51.
    The lead timedistribution count 4 3 3 ~ ~ ~ 2 M ~ ~ ~ v v ~ ~ v v 1 1 0 days 1 2 3 4 5 6 7 8 9 12 13 16 SLA
  • 52.
    The spent timedistribution count 6 5 4 ~ ~ ~ 3 M ~ ~ ~ v v ~ ~ v v 2 1 0 hours 6 7 8 9 10
  • 53.
    The spent timedistribution count 6 5 4 ~ ~ ~ 3 M ~ ~ ~ v v ~ ~ v v 2 1 0 hours 6 7 8 9 10 SLA
  • 55.
    +1 Pressure won’tmake a difference
  • 56.
    #2 Nothing changed.Still the same ratio #1 We decided that we would force ourselves to be faster
  • 62.
    Thank you verymuch for your attention! http://zsoltfabok.com/ me@zsoltfabok.com