
Recommended
More Related Content
Similar to 252 CHAPTER 8Geologic Time (232 chapter 7Fire.docx
Similar to 252 CHAPTER 8Geologic Time (232 chapter 7Fire.docx (17)
More from eugeniadean34240
More from eugeniadean34240 (20)
Recently uploaded
Recently uploaded (20)
252 CHAPTER 8Geologic Time (232 chapter 7Fire.docx
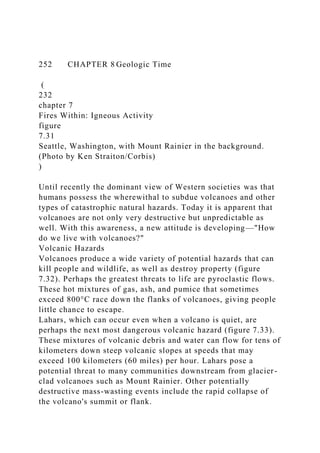
- 1. 252 CHAPTER 8 Geologic Time ( 232 chapter 7 Fires Within: Igneous Activity figure 7.31 Seattle, Washington, with Mount Rainier in the background. (Photo by Ken Straiton/Corbis) ) Until recently the dominant view of Western societies was that humans possess the wherewithal to subdue volcanoes and other types of catastrophic natural hazards. Today it is apparent that volcanoes are not only very destructive but unpredictable as well. With this awareness, a new attitude is developing—"How do we live with volcanoes?" Volcanic Hazards Volcanoes produce a wide variety of potential hazards that can kill people and wildlife, as well as destroy property (figure 7.32). Perhaps the greatest threats to life are pyroclastic flows. These hot mixtures of gas, ash, and pumice that sometimes exceed 800°C race down the flanks of volcanoes, giving people little chance to escape. Lahars, which can occur even when a volcano is quiet, are perhaps the next most dangerous volcanic hazard (figure 7.33). These mixtures of volcanic debris and water can flow for tens of kilometers down steep volcanic slopes at speeds that may exceed 100 kilometers (60 miles) per hour. Lahars pose a potential threat to many communities downstream from glacier- clad volcanoes such as Mount Rainier. Other potentially destructive mass-wasting events include the rapid collapse of the volcano's summit or flank.
- 2. Other obvious hazards include explosive eruptions that can endanger people and property hundreds of miles from a Eruption cloud Prevailing wind Ash fall 2009 steam and ash cloud ( figure 7.33 Soufriere Hills volcano on the Caribbean island of Montserrat has been active since 1995. A pyroclastic flow destroyed the airport and the capital city, Plymouth. About two thirds of the population have left the island. (NASA Photo) ) ( Lava dome collapse Pyroclastic flow
- 3. ) ( Fumaroles Lava flow Lahar (mud or debris flow) figure 7.3 2 Simplified drawing showing a wide variety of natural hazards associated with volcanoes. (After U.S. Geological Survey) ) Acid rain Pyroclastic flow Jf^- Eruption column Bombs Collapse of flank Lava dome ( The Chapter in Review 233 figure 7.34 Monitoring South Sister Volcano, Cascade Range, Oregon. This geologist is measuring the degree of infla tion of the volcano's surface for potential eruptive activity. )
- 4. volcano. During the past 15 years at least 80 commercial jets have been damaged by inadvertently flying into clouds of volcanic ash (Figure 7.33). One of these was a near crash that occurred in 1989 when a Boeing 747, with more than 300 passengers aboard, encountered an ash cloud from Alaska's Redoubt volcano. All four engines stalled after they became clogged with ash. Fortunately, the engines were restarted at the last minute and the aircraft managed to land safely in Anchorage. Monitoring Volcanic Activity Today a number of volcano-monitoring techniques are employed, with most of them aimed at detecting the movement of magma from a subterranean reservoir (typically several kilometers deep) toward the surface. The four most noticeable changes in a volcanic landscape caused by the migration of magma are (1) changes in the pattern of volcanic earthquakes; (2) expansion of a near-surface magma chamber, which leads to inflation of the volcano; (3) changes in the amount and /or composition of the gases that are released from a volcano; and (4) an increase in ground temperature caused by the emplacement of new magma. Almost a third of all volcanoes that have erupted in historic times are now monitored using seismographs, instruments that detect earthquake tremors. In general, a sharp increase in seismic unrest followed by a period of relative quiet has been shown to be a precursor for many volcanic eruptions. However, some large volcanic structures have exhibited lengthy periods of seismic unrest. For example, Rabaul Caldera in New Guinea recorded a strong increase in seismicity in 1981. This activity lasted 13 years and finally culminated with an eruption in 1994. Occasionally, a large earthquake triggers a volcanic eruption, or at least disturbs the volcano's plumbing. Kilauea, for example, began to erupt after the Kalapana earthquake of 1977. The roof of a volcano may rise as new magma accumulates in its interior—a phenomena that precedes many volcanic eruptions.
- 5. Because the accessibility of many volcanoes is limited, remote sensing devices, including lasers, Doppler radar, and Earth orbiting satellites, are often used to determine whether or not a volcano is swelling. The recent discovery of ground doming at Three Sisters volcanoes in Oregon was first detected using radar images obtained from satellites (figure 7.34). Volcanologists also frequently monitor the gases that are released from volcanoes in an effort to detect even minor changes in their amount and /or composition. Some volcanoes show an increase in sulfur dioxide (S02) emissions months or years prior to an eruption. On the other hand, a few days prior to the 1991 eruption of Mount Pinatubo, emissions of carbon dioxide (C02) dropped dramatically. The development of remote sensing devices has greatly increased our ability to monitor volcanoes. These instruments and techniques are particularly useful for monitoring eruptions in progress. Photographic images and infrared (heat) sensors can detect lava flows and volcanic columns rising from a volcano. Furthermore, satellites can detect ground deformation as well as monitor S02 emissions. The overriding goal of all monitoring is to discover precursors that may warn of an imminent eruption. This is accomplished by first diagnosing the current condition of a volcano and then using this baseline data to predict its future behavior. Stated another way, a volcano must be observed over an extended period to recognize significant changes from its "resting state." THE CHAPTER IN REVIEW • The primary factors that determine the nature of volcanic
- 6. eruptions include the magma's temperature, its composition, and the amount of dissolved gases it contains. As lava cools, it begins to congeal; and as viscosity increases, its mobility decreases. The viscosity of magma is directly related to its silica content. Rhyolitic lava, with its high silica content, is very viscous and forms short, thick flows. Basaltic lava, with a lower silica content, is more fluid and may travel a long distance before congealing. Dissolved gases provide the force that propels molten rock from the vent of a volcano. ; The materials associated with a volcanic eruption include lava flows (pahoehoe and aa flows for basaltic lavas); gases (primarily in the form of water vapor); and pyroclastic material (pulverized rock and lava fragments blown from the volcano's vent, which include ash, pumice, lapilli, cinders, blocks, and bombs). Dating with Radioactivity 249 250 CHAPTER 8 Geologic Time ( Of ) ( Rock unit A ) ( ft* ) ( N9 e Rock unit B ) ( DID YOU KNOW? Numerical dates of the fossil record show that life began in the ocean approximately 3.8
- 7. billion years ago. was once covered by a shallow sea, because that is where clams live today. Also, by using what we know of living or ganisms, we can conclude that fossil animals with thick shells capable of withstanding pounding and surging waves must have inhabited shorel ines. On the other hand, animals with thin, delicate shells probably indicate deep, calm offshore wa ters. Hence, by looking closely at the types of fossils, the ap proximate position of an ancient shoreline may be identified. Further, fossils can indicate the former temperature of the water. Certain present-day corals require warm and shal low tropical seas like those around Florida and the Bahamas. When similar corals are found in ancient limestones, they indi cate that a Florida-like marine environment m ust have existed when they were alive. These are just a few examples of how fossils can help unravel the complex story of Earth history. LA Dl O ACTIVITY ■ * Deciphering Earth History slffllgE Radiometric Dating In addition to establishing re lative dates by using the princi ples described in the preceding sections, it is also possible to obtain reliable numerical dates for events in the geologic )Age ranges of some fossil groups a past. We know that Earth is about 4.6 billion years old and that the dinosaurs became extinct about 65.5 million years ago.
- 8. Dates that are expressed in millions and billions of years truly stretch our imagination because our personal calendars involve time measured in hours, weeks, and years. Nevertheless, the vast expanse of geologic time is a reality, and it is radiometric dating that allows us to measure it accurately. In this section, you will learn about radioactivity and its application in radiometric dating. Reviewing Basic Atomic Structure s o figure 8.13 Overlapping ranges of fossils help date rocks more exactly than using a single fossil Recall from Chapter 1 that each atom has a nucleus containing protons and neutrons and that the nucleus is orbited by electrons. Electrons have a negative electrical charge, and protons have a positive charge. A neutron is actually a proton and an electron combined, so it has no charge (it is neutral). The atomic number (the element's identifying number) is the number of protons in the nucleus. Every element has a different number of protons in the nucleus and thus a different atomic number (hydrogen ■ 1, oxygen = 8, uranium = 92, etc.). Atoms of the same element always have the same number of protons, so the atomic number is constant. Practically all (99.9 percent) of an atom's mass is found in the nucleus, indicating that electrons have practically no mass at all. By adding together the number of protons and neutrons in the nucleus, the mass number of the atom is determined. The number of neutrons in the nucleus can vary. These variants, called isotopes, have different mass numbers. To summarize with an example, uranium's nucleus always has 92 protons, so its atomic number always is 92. But its neutron population varies, so uranium has three isotopes: uranium-234 (number of protons + neutrons = 234), uranium-235, and uranium-238. All three isotopes are mixed in nature. They look the same and behave the same in chemical reactions.
- 9. Radioactivity The forces that bind protons and neutrons together in the nucleus are usually strong. However, in some isotopes, the nuclei are unstable because the forces binding protons and neutrons together are not strong enough. As a result, the nuclei spontaneously break apart (decay), a process called radioactivity. What happens when unstable nuclei break apart? ( IP 8 ) ( ( Pb 2 ' _Pb 2t )Three common types of radioactive decay are illustrated in figure s. 14 and are summarized as follows: 1. Alpha particles (a particles) may be emitted from the nucleus. An alpha particle consists of 2 protons and 2 neutrons. Consequently, the emission of an alpha particle means (a) the mass number of the isotope is reduced by 4, and (b) the atomic number is decreased by 2. 2. When a beta particle (B particle), or electron, is given off from a nucleus, the mass number remains unchanged, because electrons have practically no mass. However, because the electron has come from a neutron (remember, a neutron is a combination of a proton and an electron), the nucleus contains one more proton than before. Therefore, the atomic number increases by 1. 3. Sometimes an electron is captured by the nucleus. The electron combines with a proton and forms an additional neutron. As in the last example, the mass number remains unchanged. However, because the nucleus now contains one less
- 10. proton, the atomic number decreases by 1. An unstable (radioactive) isotope is referred to as the parent. The isotopes resulting from the decay of the parent U" ■ 238 236 234 232 230 228 226 224 222 220 218 216 214 212 210 208 206 Alpha emission Beta emission Th2: ■ Pa234 Th230 .Ra22 BPo2' Bp Po2 BP«) Per™. ^ V 92 91 90 89 88 87 86 85 84 83 82 252 CHAPTER 8 Geologic Time ( Atomic number: 2 fewer Atomic mass: 4 fewer ) ( Unstable parent nucleus ) (
- 11. Daughter nucleus : - Neutron Alpha particle emission ) ( Daughter Atomic number: nucleus 1 more ).+ B. Beta Emission Unstable parent nucleus ( Unstable parent nucleus Atomic mass: no change Beta (electron) emission )Proton *6*^'*s A. Alpha Emission Neutron Electron » H & Proton Daughter Atomic number: nucleus 1 fewer , Atomic mass: £ no change C. Electron Capture Common types of radioactive decay. Notice that in each case, the number of protons (atomic number) in the nucleus changes, thus producing a different element. FIGURE 8.15 The most common isotope of uranium (U-238) is an example of a radioactive decay series. Before the stable end product (Pb-206) is reached, many different isotopes are produced as intermediate steps.
- 12. are the daughter products, figure 8. is provides an example of radioactive decay. When the radioactive parent, uranium-238 (atomic number 92, mass number 238), decays, it follows a number of steps, emitting eight alpha particles and six beta particles before finally becoming the stable daughter product lead-206 (atomic number 82, mass number 206). Certainly among the most important results of the discovery of radioactivity is that it provides a reliable method of calculating the ages of rocks and minerals that contain particular radioactive isotopes. The procedure is called radiometric dating. Why is radiometric dating reliable? The rates of decay for many isotopes have been precisely measured and do not vary under the physical conditions that exist in Earth's outer layers. Therefore, each radioactive isotope used for dating has been decaying at a fixed rate ever since the formation of the rocks in which it occurs, and the products of decay have been accumulating at a corresponding rate. For example, when uranium is incorporated into a mineral that crystallizes from magma, there is no lead (the stable daughter product) from previous decay. The radiometric "clock" starts at this point. As the uranium in this newly formed mineral disintegrates, atoms of the daughter product are trapped and measurable amounts of lead eventually accumulate. Half-Life The time required for one half of the nuclei in a sample to decay is called the half-life of the isotope. Half-life is a common way of expressing the rate of radioactive disintegration. figure 8.16 illustrates what occurs when a radioactive parent decays directly into its stable daughter product. When the Dating with Radioactivity 25 I 1 40 o
- 13. 30 c 2 i a 20 ( Radioactive Stable Daughter Currently Accepted Parent Product Half-Life Values Uranium-238 Lead-206 4.5 billion years Uranium-235 Lead-207 713 million years Thorium-232 Lead-208 14.1 billion years Rubidium-87 Strontium-87 47.0 billion years Potassium-40 Argon-40 1.3 billion years Table 8.1 Radioactive isotopes frequently used in radiometric dating ) ( 50 100 atoms of parent isotope ) ( 25 atoms of parent 75 atoms of daughter product ) (
- 14. 50 atoms of parent 50 atoms of daughter product 13 atoms of parent 87 atoms of daughter product ••••••••• **••••••»* «•»»•••••* ) ( •••••••••• , )6 atoms of parent 94 atoms of daughter product 10 •••••••••• T 2 3 Number of half-lives FIGURE 8.16 The radioactive decay curve shows change that is exponential. Half of the radioactive parent remains after one half-life. After a second half-life, one-quarter of the parent remains, and so forth. quantities of parent and daughter are equal (ratio 1:1), we know that one half-life has transpired. When one-quarter of the original parent atoms remain and three-quarters have decayed to the daughter product, the parent/daughter ratio is 1:3, and we know that two half-lives have passed. After three half-lives, the ratio of parent atoms to daughter atoms is 1:7 (one parent atom for every seven daughter atoms). If the half-life of a radioactive isotope is known and the parent- daughter ratio can be determined, the age of the sample can be calculated. For example, assume that the half-life of a hypothetical unstable isotope is 1 million years and the parent- slaughter ratio in a sample is 1:15. Such a ratio indicates that
- 15. four half-lives have passed and that the sample must be 4 million years old. Radiometric Dating Notice that the percentage of radioactive atoms that decay during one half-life is always the same: 50 percent. However, the actual number of atoms that decay with the passing of each half-life continually decreases. As the percentage of radioactive parent atoms declines, the proportion of stable daughter atoms rises, with the increase in daughter atoms just matching the drop in parent atoms. This fact is the key to radiometric dating. Of the many radioactive isotopes that exist in nature, five have proved particularly important in providing radiometric ages for ancient rocks (Table 8.1). Rubidium-87, uranium-238, and uranium-235 are used for dating rocks that are millions of years old, but potassium-40 is more versatile. Although the half-life of potassium-40 is 1.3 billion years, analytical techniques make possible the detection of tiny amounts of its stable daughter product, argon-40, in some rocks that are younger than 100,000 years. Another important reason for its frequent use is that potassium is abundant in many common minerals, particularly micas and feldspars. It is important to realize that an accurate radiometric date can be obtained only if the mineral remained a closed system during the entire period since its formation. A correct date is not possible unless there was neither the addition nor loss of parent or daughter isotopes. This is not always the case. In fact, an important limitation of the potassium-argon method arises from the fact that argon is a gas, and it may leak from minerals, throwing off measurements. Remember that although the basic principle of radiometric dating is simple, the actual procedure is quite complex. The analysis that determines the quantities of parent and daughter must be painstakingly precise. In addition, some radioactive materials do not decay directly into the stable daughter product. As you saw in Figure 8.15 uranium-238 produces 13 intermediate unstable daughter products before the fourteenth
- 16. and final daughter product, the stable isotope lead-206, is produced. Dating with Carbon-14 To date very recent events, carbon-14 is used. Carbon-14 is the radioactive isotope of carbon. The process is often called radiocarbon dating. Because the half-life of carbon-14 is only 5,730 years, it can be used for dating events from the historic past as well as those from very recent geologic history. In some cases, carbon-14 can be used to date events as far back as 75,000 years. DID YOU KNOW? One common precaution against sources of error in radiometric dating is the use of cross checks. This simply involves subjecting a sample to two different methods. If the two dates agree, the likelihood is high that the date is reliable. If an appreciable difference is found, other cross checks must be employed to determine which, if either, is correct. Carbon-14 is continuously produced in the upper atmosphere as a consequence of cosmic-ray bombardment. Cosmic rays, which are high-energy particles, shatter the nuclei of gas atoms, releasing neutrons. Some of the neutrons are absorbed by nitrogen atoms (atomic number 7), causing their nuclei to emit a proton. As a result, the atomic number decreases by 1 (to 6), and a different element, carbon-14, is created (figure 8.i7a). This isotope of carbon quickly becomes incorporated into carbon dioxide, which circulates in the atmosphere and is absorbed by living matter. As a result, all organisms contain a small amount of carbon-14, including yourself. While an organism is alive, the decaying radiocarbon is continually replaced, and the proportions of carbon-14 and carbon-12 remain constant. Carbon-12 is the stable and most common isotope of carbon. However, when any plant or animal dies, the amount of carbon-14 gradually decreases as it decays to nitrogen-14 by beta emission (figure 8.17b). By comparing
- 17. the proportions of carbon-14 and carbon-12 in a sample, radiocarbon dates can be determined. Although carbon-14 is useful in dating only the last small fraction of geologic time, it has become a valuable tool for anthropologists, archaeologists, and historians, as well as for geologists who study very recent Earth history. In fact, the development of radiocarbon dating was considered so important that the chemist who discovered this application, Willard F. Libby, received a Nobel prize. Importance of Radiometric Dating Radiometric dating methods have produced literally thousands of dates for events in Earth history. Rocks exceeding 3.5 billion years in age are found on all of the continents. Earth's oldest rocks (so far) are gneisses from northern Canada near Great Slave Lake that have been dated at 4.03 billion years (b.y). Rocks from western Greenland have been DID YOU KNOW? Dating with carbon-14 is useful to archeologists and historians as well as geologists. For example, University of Arizona researchers used carbon-14 to determine the age of the Dead Sea Scrolls, considered among the great archeological discoveries of the twentieth century. Parchment from the scrolls dates between 150 B.c. and 5 B.C. Portions of the scrolls contain dates that match 'those determined by the carbon-14 measurements. dated at 3.7 to 3.8 b.y., and rocks nearly as old are found in the Minnesota River Valley and northern Michigan (3.5 to 3.7 b.y.), in southern Africa (3.4 to 3.5 b.y.), and in western Australia (3.4 to 3.6 b.y.). It is important to point out that these ancient rocks are not from any sort of "primordial crust" but originated as lava flows, igneous intrusions, and sediments deposited in shallow water—an indication that Earth history began before these rocks formed. Even older mineral grains have been dated.
- 18. Tiny crystals of the mineral zircon having radiometric ages as old as 4.3 b.y. have been found in younger sedimentary rocks in western Australia. The source rocks for these tiny durable grains either no longer exist or have not yet been found. Radiometric dating has vindicated the ideas of Hutton, Charles Darwin, and others who inferred that geologic time must be immense. Indeed, modern dating methods have proved that there has been enough time for the processes we observe to have accomplished tremendous tasks. Deciphering Earth History Geologic Time Scale ( Nitrogen-14 atomic number 7 atomic mass 14 Neutron capture A. Production of carbon-14 Carbon-14 atomic number 6 atomic mass 14 Proton emission ) ( Neutron Proton (-) Beta (electron) emission Carbon-14 B. Decay of carbon-14 Nitrogen-14 figure 8.17 A. Production and B. decay of carbon-14. These sketches repre sent the nuclei of the respective atoms. )Geologists have divided the whole of geologic history into
- 19. units of varying magnitude. Together, they comprise the geologic time scale of Earth history (figure 8.18). The major units of the time scale were delineated during the nineteenth century, principally by scientists in Western Europe and Great Britain. Because radiometric dating was unavailable at that time, the entire time scale was created using methods of relative dating. It was only in the twentieth century that radiometric dating permitted numerical dates to be added. Structure of the Time Scale The geologic time scale divides the 4.6-billion-year history of Earth into many different units and provides a meaningful time frame within which the events of the geologic past are arranged. As shown in Figure 8.18, eons represent the greatest expanses of time. The eon that began about 542 million years ago is the Phanerozoic, a term derived from Greek words meaning "visible life." It is an appropriate description because the rocks and deposits of the Phanerozoic eon contain abundant fossils that document major evolutionary trends.