SlideShare a Scribd company logo
1 of 87
1
PAGE
3
CTW2
David Gijon
Georgia State University
7/21/2014
1. Monetary policies in the wake of the Financial Crisis of 2008
The initial response of the Federal Reserve Bank of America
was in the form of cutting interest rates by 50 basis points. With
the realization the financial hardship was still persistent across
the nation, the Federal Open Committee moved in to reduce the
(FFR) Federal Funds Rate, which originally stood at 5.25%. The
new rate was now 2 percent. This reduction was carried out in
the period between September 2007 and April 2008 (Thornton,
2010). Additionally, the basic lending rate was brought down to
25 basis points. This was also followed by the introduction of
Term Auction Facility. At a significant level the Fed has
historically contracted or expanded its balance sheet through its
investing and lending activities. The effect of these monetary
policies was to expand or contract
the monetary base as well as the supply of credit. Considering
the banking system structure, as well as, the reserve
requirements; changes in monetary base are aimed at altering
the money supply. The effect on the supply of money is the
manner in which the Fed influences the interest rates (Thornton,
2004). This brings about the liquidity effect
which is characterized by a high supply of money and reduced
interest rates. Despite the fact that the demand for money may
not be necessarily influenced by interest rates the lending and
investing activities of the Fed affect the availability of credit.
One instance where such monetary policy was used by the Fed
is in the aftermath of the Lehman Bros collapse. In what was
termed as quantitative easing 1, the Fed purchased securities
backed by mortgages, agency debt and long term treasuries.
This was followed by quantitative easing 2 QE2 whereby further
long term treasuries were purchased (Joyce et al., 2010). These
measures by the Fed were aimed at increasing aggregate demand
through a reduction of long term yields.
Sadly the QEs did not achieve the desired long term yields as
the Feds had anticipated. Generally, borrowing too did not pick
up as had been anticipated in the increase of credit supply.
2. Fiscal policies after the financial melt down
The reasonable thing to do in the event of a financial crisis is to
induce aggregate demand. There exists a disagreement on the
manner in which aggregate demand can be expanded.
Government spending is one of the commonly used fiscal
policies: it is usually aimed at reversing the effects of
recessions such as unemployment, loss of benefits, and decline
in tax revenues, which stem from the decline in the economic
activities. On the same note other discretionary measures such
as tax rates reduction or tax holidays on businesses and
households can be used to quicken the economic recovery. The
government would also try to offer loans to states and firms as
well as, grants and contracts for investment. These were the
fiscal tools employed by the federal government in the wake of
the financial crisis of 2008. The government employed several
government expenditures which are rare countercyclical
measures. The first initial government expenditure was used by
G.W. Bush in the purchase of huge non-performing financial
assets from banks on the verge of collapse. These activities are
considered fiscal because for purchase of such private liabilities
by the fed must be approved by the congress. In a budget funded
by the congress at a cost of $700 billion the treasury bought the
assets from the troubled banks. This initiative was known as
Troubled Asset Relief Program (TARP). Through the TARP
initiative funds were induced into the ailing corporations such
as GM
, AIG and Citigroup. The underlying idea was to strengthen
banks’ balance sheet with an aim of inducing the flow of credit
easily to finance investments. Another fiscal action taken by the
government was the ARRA (American Recovery and
Reinvestment Act) of 2009. This approach appropriated $787
billion in terms of tax cuts, as well as benefits to firms and
individuals. The government also used other measures such as
TANF (Temporary Assistance to Needy Families) program in
conjunction with other emergency funds (Gali, Lopez-Salido &
Valles, 2005). The ARRA and TANF were positive measure but
sadly only comprised 10 percent of the GDP. Additionally, the
measures had a small impact as they were inadequate when it
comes to direction and size. The programs had insignificant
contribution to the recovery of the economy perhaps due to their
small size.
3. Further steps the Federal reserve/government cab stimulate
the economy.
The Federal Reserve achieves its target
by controlling the interest rates when inflation goes up and
when the economy is struggling. This move aims at controlling
the supply of money in the economy. FFR (Federal Funds Rates)
are some of the tools the Federal Reserve uses to control the
supply of money. Federal Funds Rate is the charged on inter-
bank borrowing. This borrowing occurs between banks with
excess reserves and those with a shortage in the authorized
reserves (Alesina & Giavazzi, 2013). The interest charged on
such borrowing is called Federal Funds Rate which is controlled
by the actions of reserves demand and supply. Regulation of the
funds rate is a sure way to improve the economy.
Good description of monetary and fiscal policies. Needs to
include policy recommendations, applications of a model,
introduction, and conclusion. Grammar is pretty good, needs
proofreading.
References
Gali, J. Lopez-Salido, D. and Valles, J. (2005). “Understanding
the Effects of Government Spending on Consumption,” CREI.
Joyce et al., (2010). “The Financial Market Impact of
Quantitative Easing,” Bank of England Working Paper 393.
Thornton, D.L. (2010c). “Monetary Policy and Longer-Term
Rates: An Opportunity for Greater Transparency,” Federal
Reserve Bank of St. Louis Economic Synopses, No. 36.
Thornton, D.L. (2004). “The Fed and Short-term Interest Rates:
Is It Open Market Operations, Open Mouth Operations or
Interest Rate Smoothing?” Journal of Banking and Finance,
28(3), 475-98.
Alesina, A., & Giavazzi, F. (2013). Fiscal policy after the
financial crisis. University of Chicago Press: Chicago.
�Which one? Apply a model from the book
�What?
�How would this work? Use a model
�Different bailout
�Not enough detail. Evidence? Apply the policies to a model
�Target what?
�Doesn’t this belong in the monetary policy section? You
talked about how the Fed already used this tool
PAGE
3
Industrial Marketing Management 40 (2011) 128–138
Contents lists available at ScienceDirect
Industrial Marketing Management
Motivating the industrial sales force in the sales forecasting
process
Teresa M. McCarthy Byrne a,⁎, Mark A. Moon b,1, John T.
Mentzer b,1
a Bryant University, Department of Marketing, 1150 Douglas
Pike, Smithfield, RI 02917, USA
b University of Tennessee, Department of Marketing and
Logistics, 324 Stokely Management Center, Knoxville, TN
37996, USA
⁎ Corresponding author. Tel.: +1 401 232 6801.
E-mail addresses: [email protected] (T.M. McCar
(M.A. Moon).
1 Tel.: +1 865 974 8062.
0019-8501/$ – see front matter © 2010 Elsevier Inc. Al
doi:10.1016/j.indmarman.2010.06.003
a b s t r a c t
a r t i c l e i n f o
Article history:
Received 14 July 2008
Received in revised form 2 June 2009
Accepted 10 May 2010
Available online 10 July 2010
Keywords:
Sales forecasting
Motivation
Job satisfaction
Job seriousness
Forecasting training
Previous research has recognized the value of the industrial
salesperson's role in the sales forecasting process, and
offered normative descriptions of what that role should be.
However, no studies have been conducted to
determine the variables that motivate industrial sales force
involvement in and contribution to the sales
forecasting process. This study employed depth interviews and
survey research to develop and test a conceptual
model of industrial sales force forecasting motivation. The
research identifies five environmental signals that can
be employed by managers to impact an industrial salesperson's
level of satisfaction with, effort directed towards,
and seriousness placed in the sales forecasting process.
thy Byrne), [email protected]
l rights reserved.
© 2010 Elsevier Inc. All rights reserved.
1. Introduction
The integral role of sales forecasting in the corporate planning
process and as a contributor to corporate success is widely
recognized
(Dalrymple, 1975, December, Fildes, and Beard, 1992;
Makridakis, and
Wheelwright, 1977, October; Mentzer, and Moon, 2005; Reid,
1985).
The critical role of an organization's sales force in developing
the
forecast has also been well established (Dalrymple, 1975,
Decem-
ber;1987; McCarthy, Davis, Golicic, and Mentzer, 2006,
August;
Mentzer, and Kahn, 1995a; Moon, Mentzer, and Thomas, 2000).
For
example, a company's salespeople can contribute valuable
information
tothe sales forecastingprocess byacquiringmarket intelligence
through
direct conversations with their customers. Indeed, research has
shown
that sales force composite continues to be a popular and
frequently used
forecasting technique (Dalrymple, 1987; McCarthy et al., 2006,
August;
Mentzer, and Kahn, 1995a). Furthermore,the trendtoward
partnerships
within the supply chain has fueled the practice of collaborative
forecasting (McCarthy, and Golicic, 2002; Sriram, Krapfel, and
Spekman,
1992, December), and the sales force fulfills this boundary-
spanning
forecasting function between the organization and its
downstream
supply chain partners.
Despite the important role of the industrial sales force in sales
forecasting, research illustrates that many salespeople are
unmotivated
to perform their forecasting responsibilities, arising from a
belief that
time spent on forecasting usurps time that should be spent
developing
customer relationships and selling products (Moon, and
Mentzer,
1999). Research on sales force forecasting is largely devoted to
empirical
studies examining the salesperson's impact on forecast accuracy
related
to the use of a specific technique or practice, such as sales force
composite (Peterson, 1993), the assortment forecasting method
(Småros, and Hellström, 2004), survey of buyer intention
(Peterson,
1988), and involvement in quota setting (Wotruba, and Thurlow,
1976).
Inaddition,severalapplied cases describethe natureof
thesalesperson's
involvement in a particular company's forecasting process (e.g.,
Barash,
and Mitchell, 1998; Reese, 2000; Riehm, 2001; Småros, and
Hellström,
2004). Cox (1989) and Moon, and Mentzer (1999) descriptive
studies
recommend strategies for improving sales force forecasting
perfor-
mance. Notwithstanding the contribution of these studies to
increasing
our knowledge of the role of salespeople in sales forecasting,
there is a
dearth of research focused on identifying the specific factors
that
motivate and direct industrial sales force behavior in the sales
forecasting process. Our study fills this gap in the literature by
identifying and testing variables that impact sales force
motivation in
the sales forecasting process. The purpose of this paper is to
develop a
theory of industrial sales force forecasting that will inform
managers of
the controllable variables that can motivate sales force
involvement in
their forecasting responsibilities.
The following section reviews the theory building approach and
methodologies applied in this paper. In the next section we
employ
qualitative interviews and literature review to identify the
variables
and develop a conceptual model relevant to motivating the
industrial
sales force in the sales forecasting process. Subsequently, we
develop
an exploratory measurement instrument to empirically test the
model
using survey methodology. Results of the exploratory survey are
http://dx.doi.org/10.1016/j.indmarman.2010.06.003
mailto:[email protected]
http://dx.doi.org/10.1016/j.indmarman.2010.06.003
http://www.sciencedirect.com/science/journal/00198501
Fig. 1. Conceptual model of industrial sales force sales
forecasting motivation.
129T.M. McCarthy Byrne et al. / Industrial Marketing
Management 40 (2011) 128–138
presented and discussed, followed by implications and
suggestions for
future research.
2. Theory building
Our research follows the Reynolds (1971) three-step approach
to
theory building: exploratory, descriptive, and explanatory
research.
Among the data-gathering methods recommended for theory
devel-
opment are observation, unstructured and structured interviews,
surveys, documents, and experiments (Schendel, and Hofer,
1979;
Reynolds, 1971). Mentzer, and Kahn (1995b) recommend that
researchers begin the idea generation process with observation
and
literature review. As such, in this multi-method study, we
employ
observation from depth interviews, literature review, and a
survey
questionnaire to build theory.
Specifically, for the exploratory stage of theory building, our
study
employs observation and analysis of the sales forecasting
manage-
ment practices at 24 industrial marketing companies to “identify
the
phenomena of interest and describe its key characteristics”
(Schendel,
and Hofer, 1979, p. 385.), as well as a review of the literature
related to
sales forecasting and industrial sales force motivation. Our
descriptive
stage involves developing the theoretical model and hypotheses
explaining the relationships between variables identified in the
first
stage. The explanatory stage empirically tests the relationships
hypothesized in the second stage using exploratory survey
method-
ology. Following the description and findings of each stage of
the
research presented below, discussion, implications, and
recommen-
dations for industrial marketing managers and for future
research are
presented.
2.1. Exploration and description
Depth interviews were conducted following conventional
protocols
developed by Churchill (1979, February) and McCracken (1988)
at 24
industrial marketing companies toobserve sales forecasting
management
practices. Informed by persistent themes emerging from the
interviews,
we reviewed the extant literature on industrial sales force
motivation and
sales forecasting practices to provide a theoretical foundation
for the
interview themes. This dual approach to exploration allows for
triangulation whereby the researcher is constantly tacking back
and
forth among the data sources – including the interview data and
relevant
literature – to discern the dimensions associated with sales force
forecasting, and to facilitate development and refinement of
constructs
and measures for the descriptive stage of theory building
(Morgan,
Anderson, and Mittal, 2005, July). Specifically, in this section,
we conduct
exploration by reviewing the qualitative interview data and the
sales force
motivation and sales force forecasting literature to identify
relevant
situational and motivational variables, and description by
discerning
patterns and making empirical generalizations in the form of
identifying
relationships among the variables. We explore the situational
variables
that lead to increased motivation in industrial sales force
forecasting, and
then examine the specific motivational dimensions related to
sales
forecasting productivity. The variables that emerged from the
depth
interviews and the sales force motivation and forecasting
literature
review, and the relationships between those variables, are
shown in Fig. 1.
The companies that participated in the interviews span a variety
of
industries,2 and are representative of all levels in the industrial
2 Interviews were conducted at the following industrial
marketing companies: AET
Films, AlliedSignal, Applied Micro Circuits Corporation, Avery
Dennison, ConAgra,
Continental Tire, Cooper Tire, Corning, Cummins Filtration,
DuPont, Eastman Chemical,
Exxon-Mobil, Federal Express, John Deere, Lucent
Technologies, Maxtor, Michelin,
Motorola, Orbit, Peerless Pump, ProSource, Smith & Nephew,
Sysco, and Union Pacific
Railroad.
marketing supply chain: raw material suppliers, manufacturers,
and
distributors. At these companies, over 1000 individuals from
across
multiple functional areas were interviewed, including sales
people,
sales managers, and sales executives. The roles these
individuals play
in the forecasting process were explored in depth, as were
issues
surrounding forecasting systems utilized, performance
measurement,
customer participation in sales forecasting, feedback, training,
and
how sales forecasts are used in the firm. The following findings
from
the interviews and literature suggest that the presence of certain
situational variables increases industrial sales force motivation
in the
sales forecasting process.
2.1.1. Situational variables
Bagozzi (1978, November) describes situational variables as “a
bundle of physical characteristics that are in some way
coercive,
facilitative, or constraining on the individual or his or her
perfor-
mance, or some other physical events related to the individual”
(1978,
p. 521). We adapt Bagozzi's term situational variables in this
study to
indicate the environmental signals that coerce, facilitate,
constrain or
motivate industrial sales force forecasting. Environmental
signals are
comprised of managerial and financial resources provided by
the
organization to assist the industrial sales force forecasting
process.
Following is a discussion of nine environmental signals (see
Fig. 1)
that emerged from the interview data and literature review as
impacting industrial sales force motivation in the sales
forecasting
process. The discussion for each variable begins with
presentation
of the depth interview findings followed by a review of the
relevant literature in industrial sales force motivation and sales
force forecasting.
2.1.1.1. Compensation and performance evaluation. One theme
that
persistently emerged from interviews within every company was
related to perceptions of the impact of compensation and perfor-
mance evaluation in motivating sales force forecasting.
Consistently,
individuals from sales expressed frustration that they were
asked to
spend considerable time and energy forecasting, although their
efforts were neither measured nor rewarded for this activity.
The
impact of the absence of forecasting compensation and
performance
evaluation was manifest in the salespeople's resistance towards
forecasting responsibilities, which were perceived as an
unnecessary
complexity beyond the scope of their sales function.
Furthermore,
individuals within the firm who are downstream users of the
forecasts developed by the sales organization frequently
expressed
a lack of confidence in the forecasts, often because they
perceived a
lack of accountability.
Research has shown that salespeople often resent having to
perform
their forecasting responsibilities because they consider sales
forecasting
as ancillary to and incompatible with their primary function,
which they
130 T.M. McCarthy Byrne et al. / Industrial Marketing
Management 40 (2011) 128–138
believe is to sell (Harris, and Pike, 1996; Mentzer, and Moon,
2005). In
an environment in which the role of the sales force is
characterized as
increasingly complex (Jones, Brown, Zoltners, and Weitz,
2005),
inclusion of forecasting responsibilities to the role expectations
of
salespeople can result in feelings of role incongruity and
incompatibility
(Behrman, and Perreault, 1984, p. 12). Incongruity and
incompatibility
of expectations often stem from a failure of incentive structures
such as
compensation and performance evaluation to encompass and
thereby
motivate the expected performance (Brown, Evans, Mantrala,
and
Challagalla, 2005). In these situations, the importance of the
salesperson
in the forecasting process and the resultant organizational
performance
implications must be made evident to mitigate feelings of role
incongruity. Thus, developing compensation schemes and
performance
evaluations incorporating incentives for forecast accuracy is one
approach to underscoring the importance of sales force
forecasting
accountability (Mantrala, and Raman, 1990). Based on the
interview
data and literature review, compensation for and performance
evaluation of forecasting responsibilities are environmental
signals
that motivate industrial sales force forecasting.
2.1.1.2. Use of environmental conditions. Interview informants
per-
ceived importance in having access to information related to
internal
and external environmental factors that impact demand.
Information
regarding endogenous factors that were noted as important
included
the timing of new product introductions, and changes in
organiza-
tional marketing expenditures and pricing policies. Among the
exogenous conditions identified by informants were industry
trends,
competitive trends, and economic forecasts. The perceived
impor-
tance of access to environmental conditions was emphatically
expressed by the interview informants, particularly when the
information salespeople desired was neither accurate nor timely.
One forecast analyst described the reaction of salespeople when
asked
to submit a 12 month forecast without sufficient information;
“They
hate it…. It's like pulling teeth.… They aren't given enough
information regarding pricing and new products to create an
accurate
12 month forecast.” As described by one salesperson
recognizing the
inadequacy of the information supplied, “the forecast becomes a
joke.” In situations where salespeople were not given accurate
and
timely information, they clearly expressed dissatisfaction with
the
process, took the process less seriously, and spent less time and
effort
developing their forecasts.
Research indicates that a determinant of salesperson
performance
relates to the level and quality of information and knowledge
needed
to perform the role adequately (Agarwal, 1999, Brown, and
Peterson,
1993, February; Churchill, Ford, Hartley, and Walker, 1985,
May;
Johlke, Duhan, Howell, and Wilkes, 2000). The sales literature
(Baldauf, and Cravens, 2002; Matsuo, and Kusumi, 2002)
supports
the concept advanced by the knowledge-based view of the firm
suggesting that “knowledge is the critical characteristic which
enables
salespeople to cope effectively with their dynamic, competitive
environments” (Rapp, Ahearne, Mathieu, and Schillewaert,
2006, p.
281). Knowledge of endogenous and exogenous environmental
conditions are resources that can be used by salespeople to
inform
the forecasting process (Moon, and Mentzer, 1999).
2.1.1.3. Use of judgmental input. Most salespeople in the
interviews
recognized the value they could add to the forecast stemming
from
information collected during formal and informal conversations
with
customers. Examples of judgmental information that informants
used
as input to the forecast include perceived probability of opening
new
or closing existing accounts, conversations with customers
about
orders placed with competitors due to the focal firm's inability
to
meet the customer's demand, changes in the customers' selling
efforts, changes in competitors' marketing activity, and
probabilities
of securing large orders.
Several studies have recognized the importance to the
forecasting
process of the salespersons' subjective or judgmental input
stemming
from conversations with customers and exposure to other
external
environments (Dalrymple, 1987; McCarthy, and Golicic, 2002;
Mentzer, and Kahn, 1995b; Sanders, and Ritzman, 2004). The
exposure salespeople have to customers and other externalities
often results in aggregation of a tacit and disperse knowledge
base
that can be used as a valuable source of input to the forecast,
such as
those identified above during the interviews. This type of tacit
information has been shown to add value to the forecast under
certain
conditions, particularly in changing environments and when
little
historical data exist (Webby, and O'Connor, 1996).
Although salesperson judgment was noted as critical to
effective
sales forecasting in both the interviews and literature, a key
issue with
judgmental input that emerged from the interviews was the
“game-
playing” that often takes place when salespeople contribute to
judgment based forecasts. The interviews identified two
categories
of game-playing in which salespeople often engage. First, if
salespeo-
ple perceive that their judgment-based forecasts will affect their
quotas or targets, they will underestimate future demand so that
those targets are more easily reached. Second, if salespeople
perceive
that product shortages are likely, they will overestimate future
demand so that when allocations are made, their customers will
receive the actual quantity desired. In either case, the
credibility of the
judgmental input developed by the sales force is compromised
by
such game-playing. Therefore, although the literature suggests
that
the use of judgmental input is an environmental signal
motivating
sales force forecasting, the interview results were equivocal.
2.1.1.4. Forecasting training. Another situational variable that
emerged
from the interviews is related to forecasting training, or more
precisely, the lack thereof. In most companies, both salespeople
and
downstream users of the forecast expressed frustration with the
absence of forecasting training for salespeople, which they
believed
would improve sales forecasting efforts. Very few of the 24
companies
provided any formal sales forecasting training for their
salespeople. In
most cases, forecasting was an afterthought, and any training
that did
take place was to informally show salespeople how to input
their
numbers. In fact, in many of the companies participating in the
interviews, salespeople were unaware of what happened to their
forecasts after they were submitted. Thus, not only are
salespeople
frequently not trained on how to forecast, they are frequently
not
trained on why they forecast.
Ingram, LaForge, Avila, Schwepker, and Williams (2001)
discuss the
importance of sales force training to achieve role clarification;
that is,
a clear understanding of what tasks are to be performed, how
they are
to be performed, and how such efforts lead to improved
outcomes.
Jantan, Honeycutt, Thellen and Ashraf (2004) suggest that a
strong
commitment to sales training improves role perceptions and
salesperson performance. Ramlall (2004) asserts that
organizations
cannot afford to passively assume that sources of knowledge are
being
accessed and utilized throughout an organization, such as the
use of
judgmental information obtained by salespeople during
conversa-
tions with customers. Sales managers that train the sales force
in
application of the various sources of knowledge in the sales
forecasting process work toward reducing role ambiguity.
Training
in knowledge management practices, including coaching,
mentoring,
and workshops for knowledge sharing, is considered essential
for a
company to translate tacit knowledge into more objective and
codified explicit knowledge (Demers, 2003; Nonaka, and
Takeuchi,
1995). For example, McCarthy, and Golicic (2002) found that
judgmental input improved sales forecast accuracy when firms
actively commit resources to train salespeople in intelligence
gathering and forecasting. Therefore, we include forecasting
training
as an environmental signal that motivates industrial sales force
forecasting.
131T.M. McCarthy Byrne et al. / Industrial Marketing
Management 40 (2011) 128–138
2.1.1.5. Feedback on forecasting performance. Another
environmental
signal that was evidenced as a pain point due to its absence is
feedback
from managers on forecasting performance. Very few of the
companies
provided individual salespeople with concrete forecasting
performance
data, although many informants indicated that they desired the
information and expressed frustration with the absence of
feedback.
Among the companies that did measure and communicate
forecast
accuracy, salespeople were readily able to recall their level of
accuracy
and often discussed targeted improvement goals. In many cases,
lack of
feedback resulted from lack of systems capability to measure
forecast
accuracy at the individual salesperson level. The interviews
revealed
that if individual measurement took place, it often required
manipula-
tion of data outside the formal forecasting system, and it was
the rare
company that went to this length to provide such feedback.
Locke, and Latham (1990) identify managerial feedback as an
important motivator of performance. Clear and frank
supervisory
feedback provides clarification of performance expectations
leading
to increased job satisfaction, effort, and performance (Brown,
and
Peterson, 1993, February; Chakrabarty, Oubre, and Brown,
2008,
Humphreys, and Einstein, 2004, Teas, and Horrell, 1981,
February). A
formal process providing salespeople with feedback about sales
forecast accuracy or the reasons for inaccuracy is a tool that can
be
used by salespeople to adjust their performance, and by
management
to emphasize accountability for forecast accuracy performance.
2.1.1.6. Knowledge of how the forecast is used throughout the
organization. In some companies involved in the interviews,
processes
were established to ensure that salespeople understood the
impact of
their forecasting efforts on corporate performance. These
companies
discussed having regularly scheduled sales and operations
planning
(S&OP) meetings attended by salespeople, resulting in a
consensus
understanding of the forecast and how it was used to inform
resource
allocation decisions throughout the company. In other
companies, the
interview data revealed a common lack of understanding among
the
salespeople concerning the impact of their forecast on the
supply
chain. In these companies we observed a cultural disconnect
between
the demand and supply sides of the enterprise, and salespeople
showed little understanding of the effects their forecasts had on
production planning, procurement, logistics planning, and other
aspects of supply chain management. In one example,
salespeople
were no longer invited to attend S&OP meetings because their
input
was “disruptive.” As a result, one salesperson commented, “I
don't
care what happens after I send my forecast to [the forecast
analyst],”
resulting in the prevalent attitude characterized as “it's our job
to sell,
and their job to supply.” These interview results indicate that a
lack of
understanding regarding how the salespeople's forecasts are
used
throughout the company results in a lack of motivation in the
forecasting process.
In his research on motivation in the workplace, Pinder (1997)
asserts that overall effectiveness of employees is significantly
related
to the perceived importance of performing a task. Specifically,
employees who believe that their contribution in performing a
task
impacts the entire organization will be motivated to perform the
task
more effectively. Salespeople's perceptions of the importance of
the
forecast explain the dichotomy in levels of engagement with the
forecasting process between those who understand the impact of
their forecasting efforts on corporate performance and those
who do
not. Therefore, managers are enjoined to educate salespeople
about
the use of their forecast within the company and the impact of
the
forecast throughout the organization.
2.1.1.7. Access to a forecasting computer program. Thus far, the
interview data have identified multiple sources of information
that
can be used to reduce role conflict and ambiguity and,
correspond-
ingly, to motivate salespeople to add value to the forecasting
process.
However, it became clear in the interviews that without the
proper
tools and technology, effectively organizing, storing, retrieving,
and
analyzing the abundant sources of data can become a daunting
task,
resulting in underutilization of the data. Among the
participating
organizations, a wide variety of tools were provided (or not
provided)
to salespeople to support their forecasting efforts. At one
company,
salespeople were given access to the formal forecasting system,
presented with the system-generated statistical forecast for their
“A”
level customers and their “A” level products, and provided with
a
space to enter their adjustments to the system-generated
forecast as
well as a space to note their reasons for making adjustments. At
this
company, the tools greatly supported the process. More
commonly,
many companies reported reliance on spreadsheets to create and
share forecasts for which a common procedure and data source
were
not utilized. The abundance of personal spreadsheet forecasts
was
characterized by one firm as “spreadsheet mania.” At other
compa-
nies, salespeople were simply asked to send an e-mail to the
forecasting department if they knew of anything occurring that
might affect future demand. Clearly, at these companies, system
tools
were not provided to enhance the salespeople's forecasting
perfor-
mance. One salesperson who had experience with both
spreadsheet
forecasting and computer programs described her efforts with
the
computer program as more “substantive” and “rewarding” than
the
effort associated with the manual data input necessary with
spreadsheet forecasting.
Brown et al. (2005) suggest that technology facilitates the
storage,
organization, and flow of information, thereby improving the
quality
of communications within and across firms. Forecasting
computer
programs provide a common procedure and data source for
forecasting, and reduce the need for manual data input and
potential
for error associated with personal spreadsheet forecasts. Thus,
organizations providing salespeople access to forecasting
computer
programs can help them manage and optimize use of the
abundant
information available in the forecasting process.
2.1.1.8. Level of others' seriousness placed in the salesperson's
forecast.
Insights from the interview database were at times discouraging
concerning the level of seriousness placed upon the
salesperson's
forecasts by others in the organization. Frequently, substantial
disconnects were observed between the users of salesperson-
generated forecasts and the sales organization. As described
previ-
ously, forecast users often perceive that significant “game-
playing” is
taking place, rendering the forecasts generated by salespeople
less
than useful. In some firms, forecast users perceive that
salespeople are
“sandbagging,” or understating the potential demand in
anticipation
that these understated forecasts will result in lower sales quotas.
In
other firms, users perceive salespeople to be unrealistically
optimistic.
In yet others, users perceive that salespeople “pad” their
forecasts to
try to assure adequate product supply. In all these cases, there is
a
perception by forecast users that salespeople are not
accountable for
the accuracy of their forecasts and therefore the forecasts are
not
taken seriously.
Other observations emerging from the interviews illustrating a
perceived lack of seriousness relate to the “executive override.”
Salespeople expressed frustration when the forecasts they
developed
were altered by the executive team, thereby undermining the
salespersons' efforts. As stated by one salesperson,
“[Management]
flushes all my analytics for 1 h of qualitative judgment.”
Executive
changes to the forecast were often not communicated back to
the
salespeople, compounding the perception that their forecasting
efforts were not taken seriously. As described by one
salesperson,
“That loop doesn't get closed.” Managers suggested their
incentive for
overrides may stem from conflicting objectives, such as
pressure to
inflate the forecast to achieve favorable earnings projections. In
total,
these insights from the interviews paint a picture of salespeople
not
being taken seriously by users of the forecast. The lack of
seriousness
is often perceived by salespeople, and when they believe their
132 T.M. McCarthy Byrne et al. / Industrial Marketing
Management 40 (2011) 128–138
forecasts are not being taken seriously, they feel intense
reluctance to
spend time working on their forecasting tasks. As one
salesperson
commented, “they don't believe what I tell them anyway, so why
should I bother?”
The literature supports the notion that salespeople whose
forecasting efforts are not taken seriously will perceive a
disconnect
with their forecasting responsibilities. When individuals
perceive that
their work is taken seriously by others, they are more motivated
to
expend attention and effort toward the task (Nissenbaum, 1998,
Stevens, 1996) and take it seriously themselves. A rich body of
literature on motivational theories underscores the importance
of
considering the expectations of significant others in predicting
effective task performance (e.g., Hackman, and Oldham, 1980;
Mitchell, and Nebeker, 1973; Ramlall, 2004). Thus, in order to
motivate sales force behavior in the forecasting process, the
sales
force's role in developing the forecast needs to be taken
seriously by
others in the organization.
In sum, analysis of the interview data as supported by previous
research on sales forecasting and sales force motivation
suggests
several environmental signals that managers can utilize as
resources
to motivate sales force forecasting: compensation and
performance
evaluations tied to forecasting performance; ability to use
environ-
mental conditions and judgment; forecasting training; feedback
on
forecasting performance; knowledge of how the forecast is used
throughout the organization; access to a forecasting computer
program; and the level of seriousness others in the organization
place in the salesperson's forecast. These environmental signals
represent resources and direction provided by the organization
to
assist and motivate the industrial sales force sales forecasting
process.
In the following section, we further explore the literature on
sales
force motivation to describe the motivational dimensions that
are
impacted by the environmental signals present for the sales
force.
2.1.2. Motivational dimensions
Motivational research in the sales literature generally deals with
efforts to increase sales force performance and productivity
toward
organizational goals (Brown et al., 2005). Ramlall (2004)
suggests
four motivational theories that are generally applicable to
motivating
sales people: (1) need theory, (2) equity theory, (3) expectancy
theory, and (4) job design (see Ramlall, 2004 for a
comprehensive
review of each of these theories). Need theory identifies
internal
factors that stimulate behavior. Equity theory is concerned with
the
level of reward received for behavior as well as the level of
reward
relative to what others receive. Expectancy theory focuses on
anticipatory end states or goals, thereby modeling motivation as
a
function of the expectation that certain performance will result
from a
given action. Job design theory suggests that the combination of
tasks
comprising a job impacts employee motivation to perform.
2.1.2.1. Satisfaction with the forecasting process. In Ramlall
(2004)
summary of the core dimensions and outcomes of these four
theories,
one of the dimensions most frequently associated with the
theories is
satisfaction. For example, expectancy theory posits that
salespeople's
affective orientation toward their job is related to the level of
satisfaction they expect to receive from performing the job
(Ramlall,
2004; Vroom, 1964). In discussing need theories, Steers, and
Porter
(1983, p. 32) suggest, “Managers have the responsibility to
create a
proper climate in which employees can develop to their fullest
potential. Failure to provide such a climate would
theoretically…
result in lower job satisfaction.” Champagne, and McAfee
(1989))
offer several approaches to satisfying employees that include
providing praise and economic rewards, clearly explaining job
function expectations, encouraging creativity, and providing
training.
Among the factors that lead to job satisfaction in the job
character-
istics model of motivation are recognition, responsibility,
feedback,
knowledge of the results of one's efforts, and learning
(Hackman, and
Oldham, 1980; Ramlall, 2004). In the context of sales force
forecasting,
managers enabling the environmental signals identified above
create
an environment leading to satisfaction with the forecasting
process to
motivate performance.
2.1.2.2. Forecasting effort. Motivational theories also
consistently
recognize level of effort as an outcome associated with various
job-
related situational factors (Igalens, and Roussel, 1999). Need
theory,
expectancy theory, equity theory, and job characteristics theory
each perceives effort as a function of managerial practices that
motivate behavior (Ramlall, 2004). For example, Porter, and
Lawler
(1968) perceive effort as a function of perceived value of a
reward
(e.g., recognition or compensation), and that employees exhibit
higher levels of effort with higher levels of reward. Ultimately,
as
seen in Fig. 1, motivational theories advance the belief that the
right
combination of variables impacts a salesperson's level of
satisfaction
and level of effort. Introducing environmental signals to reduce
feelings of incongruity and incompatibility with job
expectations,
and that provide salespeople with the tools needed to perform
the
expected role will result in increased satisfaction with the
forecasting process, (Behrman, and Perreault, 1984; Brown, and
Peterson, 1993, February) and increased effort expended on
forecasting responsibilities.
2.1.2.3. Seriousness placed in the forecasting process. In
addition to
satisfaction and effort as dimensions that are impacted by
environ-
mental signals motivating sales force forecasting behavior,
process
models of behavior suggest that seriousness is related to
responsive-
ness to a task (Schwartz, 1977, Shiarella, 1998 (1998, January).
When
assessing a task, individuals who perceive higher levels of
seriousness
are more likely to direct attention toward the task than those
perceiving lower levels of seriousness. Describing the job
character-
istics model of motivation, Pinder (1997) advocates designing
work
environments to generate experiences that are meaningful and,
thus,
taken seriously. Meaningfulness results from allowing the
salesperson
to exercise a certain amount of autonomy, and from
understanding
how one's actions contribute to the organization (Pinder, 1997).
In the
context of sales forecasting, salespeople who are allowed to use
their
own judgment as input into the forecast, and know the impact of
their
forecasting efforts on the organization, take their
responsibilities
more seriously. In addition, Hackman, and Oldham (1980, p. 78)
suggest “the degree to which a job requires a variety of
different
activities in carrying out the work, involving the use of a
number of
different skills and talents of the person” results in job
meaningful-
ness. Thus, in order to achieve consistent improvements in
forecasting
performance within companies, the sales force must find
meaning-
fulness in their forecasting responsibilities and take those
responsi-
bilities seriously.
In summary, the interview data supported by the review of
literature on sales forecasting and sales force motivation reveals
that
having the right combination of environmental signals leads to
satisfaction with, effort directed towards, and seriousness
placed in
the forecasting process. The conceptual framework presented in
Fig. 1
reflects the variables and relationships among the variables
observed
above in the exploration and description stages of theory
develop-
ment. In the next section, we move to the explanation stage of
theory
development and empirically test the relationship between each
situational variable and the motivational dimensions associated
with
sales force forecasting.
2.2. Explanation
In the third stage of theory development, explicit theory
development serves to explain the empirical generalizations
observed
repeatedly in the earlier stages of the research. We therefore
empirically test the relationships between the environmental
signals
133T.M. McCarthy Byrne et al. / Industrial Marketing
Management 40 (2011) 128–138
and the motivational dimensions of satisfaction, seriousness,
and
effort (see Fig. 1). The environmental signals identified in the
interview data and the literature that were measured and tested
include: (1) compensation based on forecasting performance, (2)
performance evaluation based on forecasting performance, (3)
access
to environmental conditions provided by the company, (4) sales-
person's use of their own judgment as input into the forecast,
(5)
forecasting training, (6) feedback on forecast accuracy, (7)
knowledge
of how the forecast impacts the organization, (8) access to
forecasting
computer programs, and (9) others' level of seriousness.
2.2.1. Methodology
To test the relationships between the environmental signals and
the motivational dimensions, a survey of salespeople was
conducted
across a variety of industries and sales settings, as
recommended by
Schendel, and Hofer (1979). The sample of 1024 was taken from
a
commercially purchased mailing list of salespeople who
indicated
their involvement in selling products and/or services to
companies
(in other words, industrial marketing, not retail sales or sales to
individuals). From this mailing, 382 returned a postcard
indicating
that they were appropriate respondents and willing to complete
the
survey. The survey was mailed to these individuals and 262
completed surveys were returned from business-to-business
sales-
people (68.6% response rate). The survey was designed to
capture
data that would allow us to test for patterns in relationships
between
variables identified in the exploratory and descriptive stages of
research that motivate sales force participation in the
forecasting
process, leading to a prescriptive theory of industrial sales force
sales
forecasting. As such, the survey was developed to collect
information
regarding the salesperson's role in sales forecasting, the level of
satisfaction, effort, and seriousness placed on the forecasting
process,
and the presence of environmental signals that motivate sales
force
forecasting. In addition, demographic data were collected to
further
explore possible patterns among variables. The items and
frequen-
cies used to measure the variables are presented in Appendix A.
3. Data analysis and results
Results indicate that, among the 262 respondents, 18.3 percent
(n=48) do not have any forecasting responsibilities. The
remaining
results reported in this paper pertain only to those 214
respondents
who are engaged in the forecasting process. The respondents'
characteristics indicated that they were well qualified to address
the
issues under consideration. In addition to indicating that they
were
responsible for forecasting in their territory, the average
respondent
had “10 to 15 years” in sales. They also worked in a variety of
industries, including manufacturing (55.3%), service providers
(22.2%), wholesaling (14.0%), publishing (3.7%), health care
(2.8%),
and financial institutions (2.0%).
Table 1
Survey results.
Variable Variable name Seriousness
R2=.598,α=.000
β t-stat
V1 Compensation .025 .2
V2 Performance evaluation .147 1.5
V3 Use of environmental conditions .153 1.7
V4 Use of judgment −.228 −1.8
V5 Training .301 2.4
V6 Feedback −.131 −1.4
V7 Knowledge .286 5.8
V8 Forecasting computer program −.023 −.2
V9 Others' level of seriousness .488 9.7
a=significant at pb.05.
b=significant at p≤ .001.
The explanatory power of the relationships between the environ-
mental signals and motivational variables (Fig. 1) is
investigated by
the following multiple regression equations:
Equation 1: Y1 = β0 + β1V1 + β2V2 + … + β9V9 + E1
Equation 2: Y2 = β0 + β1V1 + β2V2 + … + β9V9 + E2
Equation 3: Y3 = β0 + β1V1 + β2V2 + … + β9V9 + E3
where Y1, Y2, and Y3 denote the dependent variables,
seriousness
placed in the forecasting process (Seriousness), satisfaction
with
forecasting process (Satisfaction), and forecasting effort
(Effort),
respectively; β0 represents the intercept terms; β1, β2, … β9
denote
the regression coefficients; V1, V2, … V9 denote the predictor
variables described in the Appendix; and E1, E2, and E3 denote
the
error terms associated with each equation. Although R2 can be
inflated with an increased quantity of independent variables, the
number of variables in the model falls within the accepted rule
of
thumb (i.e., no more than one independent for each 10 cases in
the
sample) (SAS Institute Inc. 2002). Results from collinearity
diagnos-
tics indicate model fit is not affected by multicollinearity.
Tolerance
statistics range from .683 to .955, all above the .20 threshold
(Hair,
Black, Babin, Anderson & Tatham, 2005); VIF ranges from 1.05
to
1.46 — within acceptable criteria; and proportion of variation
parameters reveals none of the variables contribute strongly (0.5
or
above) with two or more variables (Belsley, Kuh & Welsch,
1980). As
shown in Table 1, in each equation the dependent variable is
well
fitted by the set of independent variables as reflected by the
significant R2 coefficients of determination. The set of
independent
variables explains the largest percent of variability in the
dependent
variable Seriousness (R2=.598), followed by Effort (R2=.198)
and
Satisfaction (R2=.155) (see1).
Among the environmental signals in the model predicting
Serious-
ness, the coefficients for training (β=.301,α=.030), knowledge
of
how the forecast is used (β=.286,α=.000), and others' level of
seriousness (β=.488,α=.000), were positive and significant (see
Table 1). Results indicated Satisfaction with the forecasting
process is
associated with higher levels of training (β= .949,α=.021) and
feedback (β=.844,α=.001). Three environmental signals were
sig-
nificantly associated with level of Effort. Knowledge of how the
forecast
is used (β=.366,α=.049) and access to forecasting computer
program
(β=1.382,α=.003) had positive significant relationships, and
feed-
back revealed a negative relationship (β=−.877,α=.013).
We also tested for interaction between variables. It is intuitive
that
receiving forecasting training may have an interaction with
other
variables, specifically, using a forecasting computer program
and
knowledge of how the forecast is used. When added to the
regression
equations, the interaction variables were not significant.
Satisfaction
R2=.155,α=.000
Effort
R2=.198,α=.001
istic β t-statistic β t-statistic
27 .005 .019 −.478 −1.122
32 −.234 −.986 .625 1.670
59 −.368 −1.706 .612 1.789
33 .066 .214 −.284 −.582
66a .949 3.145a .429 .897
59 .844 3.767b −.877 −2.498a
11b .107 .880 .366 2.008a
01 −.212 −.739 1.382 3.035a
43b −.123 .984 .018 .090
134 T.M. McCarthy Byrne et al. / Industrial Marketing
Management 40 (2011) 128–138
4. Discussion
4.1. Seriousness in the forecasting process
Results from the multiple regression analysis indicate that the
environmental signals account for 59.8% of the variability in
the level
of seriousness placed in the forecasting process, with three
variables –
training, feedback, and knowledge of how the forecast is used –
demonstrating a significant relationship. Survey results were
consis-
tent with the findings from the interview data indicating
managers
striving to create a serious forecasting environment train their
salespeople in forecasting processes and techniques. The
interview
data suggest that very few companies provide training, and
survey
results were consistent, with only 14% of respondents receiving
forecasting training from their companies. Managers that
dedicate
resources for forecasting training establish a commitment to the
process and inculcate performance expectations among
salespeople.
Multiple regression results also revealed that salespeople take
forecasting responsibilities more seriously when they are
knowledge-
able about how their forecast is used to inform other decisions
throughout the company. Results indicate a wide range of
knowledge
among respondents regarding how their forecasts are used, with
52%
indicating they have “a good deal of knowledge” to “a great
deal of
knowledge” about what is done with their forecasts after they
are
submitted. As evidenced in the interview data, formally
involving
salespeople in sales and operations planning (S&OP) meetings
is a
practice that has been successfully used to expose salespeople
to the
various resource allocation decisions for which their forecasts
are
used, thereby elevating the perceived importance of the task and
reducing role ambiguity.
The finding that salespeople are more likely to take their
forecasting responsibilities seriously when others in the
organization
also regard those forecasting efforts seriously confirmed
patterns
observed in the interview data. During the interviews,
salespeople
identified two groups of people they often perceived were not
taking
their forecasts seriously — management and downstream users
of the
forecast such as production and purchasing. Management's
unilateral
changes to forecasts developed by the sales force undermined
the
salespersons' efforts and discouraged them from taking the
process
seriously. Downstream users of the forecast often believed that
salespeople developed forecasts that were intentionally high or
low in
an effort to achieve some other objective – such as assuring
adequate
product availability or exceeding quota – and thus adjusted the
forecasts to align with their beliefs. To create a climate in
which
salespeople perceive others are taking their forecasting efforts
seriously, managers can align sales forecasting processes to
mitigate
lack of seriousness in the forecast by users and managers by
establishing an S&OP process in which a shared interpretation
and
consensus agreement on the forecast is established.
4.2. Satisfaction with the forecasting process
Quantitative results indicate that the environmental signals
explain 15.5% of the variability in salespersons' satisfaction
with the
forecasting process, with two variables – training and feedback
–
showing a significant relationship. Salespeople who receive
forecast-
ing training are significantly more likely to be satisfied with the
forecasting process. Training provides direction for the
salesperson's
forecasting input and thus reduces role ambiguity, thereby
increasing
satisfaction with the process. Training was the only variable
significantly related to both Satisfaction and Seriousness and,
as
such, is an important factor motivating sales force forecasting.
The
complexity of processes, techniques, and technology can render
forecasting a daunting challenge for those not trained
adequately.
Salespeople receiving training are more able to identify
valuable
sources of demand information and use the forecast as a tool
with
which to disseminate the information.
In addition, salespeople receiving feedback on the accuracy of
their
forecasts were found to be more satisfied with the process.
Without
feedback on forecast accuracy, salespeople are unaware if their
efforts
are worthwhile or if they need to be improved. Salespeople in
the
interviews expressing frustration with absence of feedback
perceived
their forecasting efforts to be “busy work” that added little
value and
detracted from their selling responsibilities. Conversely, one of
the
managers in the interviews that provided feedback used forecast
accuracy as a tool to motivate salespeople by relating accuracy
to
customer service levels. Performance feedback can provide a
sense of
justification for the salesperson's efforts in the forecasting
process,
thus reducing role ambiguity and increasing satisfaction.
4.3. Forecasting effort
Results from the multiple regression analysis indicate that the
environmental signals account for 19.8% of variability in the
level of
seriousness placed in the forecasting process, with three
variables –
feedback, knowledge of how the forecast is used, and
forecasting
computer program – demonstrating a significant relationship.
The
negative relationship between receiving adequate feedback and
forecasting effort is counterintuitive. It is possible that the same
level of feedback may be perceived as adequate by salespeople
spending the most time on the forecast but inadequate by those
spending a lesser amount of effort on the forecast. For example,
if
those spending less time on the forecast experience lower levels
of
forecast accuracy than those spending more time, they may
perceive
the need for more feedback and instruction on what can be done
to
improve their performance. Based on the positive relationship
between feedback and satisfaction and the negative relationship
between feedback and effort, it is important for managers to
establish
a mechanism to determine if the salesperson perceives the level
of
feedback adequate.
Salespeople who are knowledgeable about how their forecasts
are
used throughout the company spend significantly more time
forecasting than those who are less knowledgeable. These
regression
analysis results support the qualitative data suggesting that
when
employees believe their efforts have a direct impact on the
company's
performance, they are more motivated to allocate time and
effort to
the task. As discussed in the literature review, motivational
theories
suggest that employee's efforts toward a task are conditioned by
the
ability to achieve desirable goals through those efforts
(Ramlall,
2004). Managers who create an environment in which
salespeople
understand the impact of their forecasting efforts on the
company –
for example encouraging involvement in S&OP meetings –
create an
expectation of attainment of goals such as improved
organizational
performance resulting in increased financial rewards.
Furthermore,
personal achievements such as improved self esteem can result
from
the knowledge that the salesperson's forecasting efforts are a
critical
aspect impacting the performance of several processes
throughout
the organization.
The third environmental signal to exhibit a significant
relationship
with forecasting effort was access to a forecasting computer
program.
The fact that salespeople who have access to a forecasting
computer
program spend more time and effort developing their forecasts
than
those without a computer program may seem counterintuitive
because the system should allow them to work more efficiently.
However, the system provides immediate access to abundant
information that the salesperson might not be able to consider
using a simple forecasting spreadsheet. In addition, as
salespeople
acquire new demand information from external sources, they
may be
more likely to utilize the computer system to analyze the impact
on
demand as they acquire the information rather than waiting to
communicate the information until the next period in which a
135T.M. McCarthy Byrne et al. / Industrial Marketing
Management 40 (2011) 128–138
forecast update is due. As described in the qualitative research,
the
salespersons' time and efforts are more substantive and
rewarding
when making forecasting decisions with the computer program.
The
significant finding between the environmental signal forecasting
computer program and the motivational dimension Effort
illustrates
that motivational theories can be applied in a sales forecasting
context, suggesting that work effort is motivated by the
perceived
value of the reward.
To summarize, among the 9 environmental signals in the model,
5
significantly impact the motivational dimensions of sales force
forecasting: training, feedback, knowledge of how the forecast
is
used, forecasting computer program, and others' level of
seriousness.
Three of the environmental signals demonstrated significant
relation-
ships with two of the motivational dimensions: Training had a
significant positive relationship with seriousness and
satisfaction;
feedback was positively associated with satisfaction but
negatively
associated with effort; and knowledge of how the forecast is
used was
positively related to seriousness and effort.
5. Managerial implications
Successfully managing the sales forecasting process involves
much
more than deciding what techniques and computer system to
adopt
within an organization. This research provides a model for
managers
interested in motivating the industrial sales force in their sales
forecasting efforts. Recognition of the important role of the
sales force
in improving the quality of sales forecasts can provide a source
of
competitive advantage for firms that rely on the forecast to
inform
other organizational processes such as purchasing,
manufacturing,
warehousing, capacity planning, and logistics scheduling, to
name a
few. The survey research revealed five environmental signals
that
motivate sales force forecasting. Managers investing in these
resources can alter the prevailing attitude among salespeople
that
forecasting is a non-value added activity which constrains the
time
they can devote to selling.
5.1. Forecasting training
Providing forecasting training for the sales force increases both
satisfaction with and seriousness placed on the process.
Forecasting
training provides structure and direction for the sales force to
identify
sources of information that impact demand and how that
information
is most effectively used as an input to the forecast. Training
programs
can be designed to include those aspects of forecasting that are
most
relevant to the sales force, such as identifying, gathering, and
interpreting qualitative intelligence from customers and other
external sources that can impact demand. Salespeople can also
be
trained to understand how the qualitative customer data can
complement a statistically generated forecast. Moon, and
Mentzer
(1999) found that salespeople's forecasting efforts are most
effective
when they are asked to alter a statistical forecast rather than
create a
new forecast. However, to be most effective, salespeople should
be
trained with a basic understanding of the variables that have
been
considered in the statistical forecast so any changes they make
are
adding value rather than duplicating the impact of variables
already
included.
5.2. Knowledge of how the forecast is used throughout the
organization
Educating the sales force on how their forecasting efforts are
used
throughout the firm increases seriousness placed in and effort
devoted to the process. Managers can establish this
environmental
signal by involving the sales people in cross-functional
meetings such
as S&OP to illustrate the systemic effect of their forecast on
other
organizational process decisions. S&OP is the process by which
an
organization develops a consensus understanding of demand
result-
ing in a single-number forecast that drives the operational plans
to
match supply and demand. Managers are encouraged to involve
salespeople in the S&OP process to demonstrate how their sales
force
forecasting efforts directly impact production and order
fulfillment
rates. Salespeople who understand that the quality of their
forecasting
efforts ultimately impacts their order fulfillment and customer
service
levels will take the process more seriously and devote more
effort to
producing quality forecasts.
5.3. Feedback on forecasting performance
Providing forecasting feedback increases satisfaction with the
process. Without regular reports of forecast accuracy,
salespeople
have little incentive to strive for improved accuracy.
Forecasting
management systems have been developed that track the
accuracy of
forecasting input for each individual that contributes to the
forecast.
Managers can utilize these system tools to monitor and provide
feedback on the accuracy of forecasting efforts among the sales
force.
Existing forecast accuracy performance can also be used as a
benchmark for setting goals for improvement for each
salesperson.
The negative relationship found between feedback and
forecasting
effort indicates that managers must gauge the appropriate
amount
and content of the feedback based on the salespersons' needs
and
level of forecast accuracy. If those spending less time on the
forecast
experience lower levels of accuracy than those spending more
time,
they may perceive the need for more feedback. Forecasting
manage-
ment systems can allow managers to customize automated
accuracy
reports at varying levels and varying frequencies based on the
feedback needs of the individual salesperson, and eliminate the
burdensome responsibility associated with manual manipulation
of
the numbers.
5.4. Access to a forecasting computer program
Fourth, managers are also encouraged to make the investment in
a
forecasting computer program that can assist the sales force in
effectively organizing, analyzing, and communicating
information
that can impact demand. Providing forecasting software tools
that are
interfaced with the company's central database enables
salespeople to
complete their forecasting responsibilities efficiently. For
example,
forecasting software packages eliminate the need for manual
input of
historical data thereby reducing potential for error, and improve
the
ability for salespeople to view and analyze multiple dimensions
of the
forecast, such as by product category, customer, channel, time
horizon, or geographic region, to name a few. As described in
the
interview, the forecasting efforts become more “substantive”
and
“rewarding” with a computer program as more effort is
dedicated to
understanding the customer and the business rather than trying
to
determine how to manage complex sets of data. However, sales
managers are cautioned against assuming a forecasting software
package is a panacea for all forecasting problems. The
technology
becomes useful when it is used as a tool to enhance an existing
forecasting process (Mentzer, and Moon, 2005).
5.5. Level of others' seriousness placed in the salesperson's
forecast
Finally, if managers want their salespeople to take the
forecasting
process more seriously, it is important to ensure that others in
the
organization also regard the salespeople's forecasting efforts
serious-
ly. Once again, the S&OP meeting is a forum in which the
content and
quality of the sales force's forecasts can be shared with a cross-
functional group to increase awareness of and seriousness
placed in
the forecast. Sales force involvement in S&OP may reduce the
incidence of game-playing and thus reduce the skepticism with
which many users of the forecast view the salespersons' efforts,
and
thereby increase the level of seriousness conferred upon the
forecast.
136 T.M. McCarthy Byrne et al. / Industrial Marketing
Management 40 (2011) 128–138
In addition, communicating the rationale behind “executive
over-
rides” that alter a salesperson's forecast will “close the loop”
and
reduce the perception that the salesperson's forecasting efforts
are not
taken seriously.
To our knowledge, this is the first study to identify variables
that
specifically motivate sales force behavior related to sales
forecasting.
The large majority of research on sales force forecasting has
focused
on the salesperson's use of a specific technique or practice
rather than
an overall assessment of how managers can motivate the
industrial
sales force to improve their forecasting efforts. The lack of
research
related to sales forecasting motivation may explain why, in
spite of
the significant findings from our quantitative study, many
companies
are not employing these environmental signals in practice. An
implication is that, although not addressed in this study,
training
sales managers in state-of-the-art forecasting and coaching
techni-
ques may be necessary before implementation of the five
environ-
mental signals can be effective. Ultimately, our research
suggests that
organizations that devote managerial and financial resources to
provide the environmental signals identified in this study foster
an
atmosphere in which salespeople are more satisfied with and
spend
more effort on the forecasting process and take the process
more
seriously.
6. Theoretical implications
Our paper developed a theory of industrial sales force
forecasting.
The theory suggests that salespeople are more motivated to
perform
their forecasting responsibilities when the necessary
environmental
signals are provided. Given that studies over the last thirty
years have
shown no real improvement in sales forecasting accuracy
(McCarthy
et al., 2006), and given the fact that a preponderance of sales
forecasting research during that time period has concentrated on
improved techniques and systems, perhaps less research
attention
should be paid to the techniques and systems of sales
forecasting, and
more to the management of the function. This is the major
theoretical
implication of this study. Industrial salespeople have
considerable
insight to provide to the sales forecasting process, if their input
is
properly managed, rewarded, and supported. This fact deserves
considerable future theory development and testing.
The finding that compensation and performance evaluation were
not significantly related to the motivational dimensions of
industrial
sales force forecasting was surprising given the frequency with
which
they were mentioned in the interviews. In addition, abundant
research on sales force productivity focuses on how judicious
design
of compensation plans align salespeople's goals with
organizational
objectives and, thus, motivate behavior to achieve desired
outcomes
(Brown et al., 2005). However, an explanation for the lack of
significance for compensation as a motivator of forecasting
behavior
may be found in some of the other environmental signals that
were
found to be significant. For example, salespeople who, (a) are
properly
trained to gather and incorporate customer data into the
forecast,
(b) receive appropriate levels of feedback in the form of
forecast accuracy
measures on the effectiveness of their efforts, and (c)
understand the
impact of their forecasting efforts on resource allocations
throughout the
organization, may be more likely to understand that the
forecasting
process can be used as a tool to learn more about and
consequently
develop a better relationship with their customers, resulting in
increased
sales. That is, the forecasting process becomes a tool to align
supply with
demand, increase sales and, in turn, increase commissions and
bonuses
within existing compensation structures and negates the need
for
additional motivation in terms of alternative compensation
structures
specific to forecasting.
We found that training, feedback, knowledge of how the
forecast is
used, forecasting computer program, and others' level of
seriousness
have considerable impact on salesperson seriousness,
satisfaction, and
effort in sales forecasting. This suggests further theory
development
addressing what other factors are antecedent to seriousness,
satisfaction, and effort, and what are the forecasting and firm
consequences of increasing seriousness, satisfaction, and effort.
This
theoretical development (through additional qualitative
methods)
and testing of the resultant theories (through quantitative
methods)
should provide practitioners with additional insights on how to
manage the industrial marketing salesperson input to sales
forecast-
ing, and what benefits these improvements have for firm and
supply
chain performance. This, in turn, should lead to a wealth of
future
research.
7. Directions for future research
Our research employed a theory-building approach to identify
factors that motivate sales force forecasting. Extant literature
on the
general topic of sales force motivation was placed in a sales
forecasting context through the use of depth interviews, and a
survey
was developed and administered based on the findings in the
literature and interviews. The interviews revealed that many
variables
believed to motivate behavior are not employed in a forecasting
context, and the survey results produced some insignificant
findings
that have been found significant in other contexts. Specifically,
several
researchers have found compensation and performance
evaluation to
be strong motivating factors for salespeople (Brown et al.,
2005;
Mantrala, and Raman, 1990; Mentzer, and Moon, 2005; Ramlall,
2004), but this research found no significant relationship.
Future
research should explore in more detail the nature of the
compensa-
tion and performance evaluation used in the sales force
forecasting
process to determine if certain approaches are more successful
than
others in motivating forecasting behavior.
Findings from our depth interviews revealed that many
salespeo-
ple are unaware of the level of accuracy of their forecasts.
Capturing
the impact of environmental signals and motivational
dimensions on
forecast accuracy is another important approach to
understanding
and improving sales force forecasting. Structural equation
modeling
can be used to examine the strength of relationships among the
environmental signals, motivational dimensions, and forecast
accu-
racy performance. Furthermore, a longitudinal study capturing
accuracy levels before and after implementation of
environmental
signals could confirm the direction of the relationships among
the
variables, revealing important insights for motivational
researchers
and for managers attempting to motivate sales force forecasting
performance.
It is also important that future research into sales force
forecasting
work to more fully understand the impact that enhanced
salesperson
performance has on important corporate outcomes. Ultimately,
there
needs to be a clear link between the resources that are expended
to
improve the quality of salesperson contributions to forecasting
performance and enhanced customer service levels, reduced
costs,
and profitability. Both managers and academics will benefit
from
empirical insight into the relationship between salesperson
forecast-
ing performance and these broader corporate performance
metrics.
Finally, additional work is needed to develop and refine reliable
and valid measures of some of the constructs introduced here.
The
survey instrument developed for this study was designed to be
exploratory in nature, and given this objective, each of the nine
environmental signals, as well as the three motivational
dimensions
identified in Fig. 1 are measured using single-item measures.
The use
of single-item dichotomous variables is a limitation of the
current
research. More robust, multi-item measures that tap into all
dimensions of the constructs can only lead to more precise tests
of
the relationships explored, and may generate significant
relationships
between the environmental signals and motivational dimensions
that
were insignificant in our study. Once this stream of research
moves
into a theory testing phase, more robust measures of these
constructs
should be developed.
137T.M. McCarthy Byrne et al. / Industrial Marketing
Management 40 (2011) 128–138
Appendix A. Measures
Environmental signals
Frequencies
V1 Compensation: Is any part of your compensation
tied in any way to the quality of your forecast?
[0=no, 1=yes]
No=162, Yes=52
V2 Performance Evaluation: Is your performance
evaluation based in any way on the quality of your
forecast? [0=no, 1=yes]
No=120, Yes=94
V3 Use of Environmental Conditions: Has your
company provided you with environmental
information (i.e., pricing policies, industry trends,
economic forecasts, etc.) to help you do your
forecasting? [0=no, 1=yes]
No=128, Yes=87
V4 Use of Judgment: Do you use your own judgment
to help you forecast? [0=no, 1=yes]
No=28, Yes=187
V5 Training: Has your company provided you with
forecasting training to help you do your forecasting?
[0=no, 1=yes]
No=185, Yes=30
V6 Feedback: Do you think you receive adequate
feedback on the accuracy of your forecasts?
[0=no, 1=yes]
No=87, Yes=126
V7 Knowledge: How much knowledge do you have
about what is done with your forecasts after you
submit them? [response option: (1) no knowledge
to (5) a great deal of knowledge]
1=5, 2=22, 3=76,
4=60, 5=51
V8 Forecasting Computer Program: Has your company
provided you with specific forecasting computer
programs to help you do your forecasting?
[0=no, 1=yes]
No=181, Yes=34
V9 Others' Level of Seriousness: How seriously are the
forecasts that you provide taken by others in your
organization? [response option: (1) not at all
seriously to (5) extremely seriously]
1=3, 2=17, 3=73,
4=74, 5=41
Motivational dimensions
Y1 Seriousness: How seriously do you take your
forecasting responsibilities? [response options –
(1) not at all seriously to (5) extremely seriously]
Range=1 to 5,
Mean=3.60, SD = .904
Y2 Satisfaction: Overall, how satisfied are you with the
forecasting process that you participate in? [response
options – (1) extremely dissatisfied to (5) extremely
satisfied]
Range=1 to 5,
Mean=3.09, SD = .857
Y3 Effort: Approximately how much time do you spend
forecasting in an average month [open-ended
response option: number of hours per month]
Range=0.5 to 100,
Mean=5.26, SD=9.44
References
Agarwal, S. (1999). Impact of job formalization and
administrative controls on attitudes
of industrial salespeople. Industrial Marketing Management, 28,
359−368.
Bagozzi, R. P. (1978, Novemberr). Sales force performance and
satisfaction as a function
of individual difference, interpersonal, and situational factors.
Journal of Marketing
Research, 15, 517−531.
Baldauf, A., & Cravens, D. W. (2002). The effect of moderators
on the salesperson
behavior performance and salesperson outcome performance and
sales organiza-
tion effectiveness relationships. European Journal of Marketing,
36(11/12),
1367−1388.
Barash, M., & Mitchell, D. H. (1998). Account based
forecasting at Nabisco Biscuit
Company. Journal of Business Forecasting, 17(2), 3−6.
Behrman, D. N., & Perreault, W. D. (1984). A role stress model
of the performance and
satisfaction of industrial salespersons.Journal of Marketing, 48,
9−12 Fall.
Belsley, D. A., Kuh, E., & Welsch, R. E. (1980). Regression
diagnostics: Identifying
influential data and sources of collinearity. New York: John
Wiley and Sons.
Brown, S. P., Evans, K. R., Mantrala, M. K., & Challagalla, G.
(2005). Adapting motivation,
control, and compensation research to a new environment.
Journal of Personal
Selling and Sales Management, 25(2), 155−167.
Brown, S. P., & Peterson, R. A. (1993, Februaryy). Antecedents
and consequences of
salesperson job satisfaction: meta-analysis and assessment of
causal effects. Journal
of Marketing Research, 30, 63−77.
Chakrabarty, S., Oubre, D. T., & Brown, G. (2008). The impact
of supervisory adaptive
selling and supervisory feedback on salesperson performance.
Industrial Marketing
Management, 37, 447−454.
Champagne, P. J., & McAfee, R. B. (1989). Motivating
strategies for performance and
productivity: A guide to human resource development. New
York: Quorum Books.
Churchill, G. A. (1979, Februaryy). A paradigm for developing
better measures of
marketing construct. Journal of Marketing Research, 16, 64−73.
Churchill, G. A., Ford, N. M., Hartley, S. W., & Walker, O. C.
(1985, Mayy). The determinants
of salesperson performance: a meta-analysis. Journal of
Marketing Research, 22,
103−118.
Cox, J. E. (1989). Approaches for improving salespersons'
forecasts. Industrial Marketing
Management, 18, 307−311.
Dalrymple, D. J. (1975, Decemberr). Sales forecasting methods
and accuracy. Business
Horizons, 18, 69−73.
Dalrymple, D. J. (1987). Sales forecasting practices.
International Journal of Forecasting, 3
(3&4), 379−391.
Demers, J. (2003). Networked knowledge. CMA Management,
76(10), 43−46.
Fildes, R., & Beard, C. (1992). Forecasting systems for
production and inventory control.
International Journal of Operations and Production
Management, 12(5), 4−27.
Hackman, J. R., & Oldham, G. R. (1980). Work redesign.
Reading, Massachusetts: Addison
Wesley.
Hair, J. F., Black, B., Babin, B., Anderson, R. E., & Tatham, R.
L. (2005). Multivariate data
analysis (6th Edition). Englewood, NJ: Prentice Hall.
Harris, K., & Pike, J. (1996). Issues concerning adoption and
use of sales force automation in
the agricultural input supply sector. Agribusiness, 12(4),
317−326.
Humphreys, J. H., & Einstein, W. O. (2004). Leadership and
temperament congruence:
extending the expectancy model of work motivation. Journal of
Leadership and
Organizational Studies, 10(4), 58−79.
Igalens, J., & Roussel, P. (1999). A study of the relationships
between compensation
package, work motivation and job satisfaction. Journal of
Organizational Behavior, 20
(7), 1003−1025.
Ingram, T. N., LaForge, R. W., Avila, R. A., Schwepker, C. H.,
Jr., & Williams, M. R. (2001). Sales
management: Analysis and decision making, 4th ed.
Jantan, M. A., Honeycutt, E. D., Thellen, S. T., & Ashraf, M. A.
(2004). Managerial perceptions
of sales training and performance. Industrial Marketing
Management, 33, 667−673.
Jones, E., Brown, S. P., Zoltners, A. A., & Weitz, B. A. (2005).
The changing environment of
selling and sales management. Journal of Personal Selling and
Sales Management, 25(2),
105−111.
Johlke, M. C., Duhan, D. F., Howell, R. D., & Wilkes, R. W.
(2000). An integrated model of
sales managers' communication practices. Journal of the
Academy of Marketing Science,
28(2), 263−277.
Locke, E. A., & Latham, G. P. (1990). In U. Kleinbeck (Ed.),
Work motivation: the high
performance cycle, in Work Motivation. Hillsdale, NJ: L.
Erlbaum.
Makridakis, S., & Wheelwright, S. C. (1977, Octoberr).
Forecasting: issues & challenges for
marketing management: a framework for relating the available
techniques to specific
situations. Journal of Marketing, 24−38.
Mantrala, M. K., & Raman, K. (1990). Analysis of a sales force
incentive plan for accurate
sales forecasting and performance,. International Journal of
Research in Marketing, 7,
189−202.
Matsuo, M., & Kusumi, T. (2002). Salesperson's procedural
knowledge, experience and
performance: an empirical study in Japan. European Journal of
Marketing, 36(7/8),
327−330.
McCarthy, T. M., & Golicic, S. L. (2002). Implementing
collaborative forecasting to improve
supply chain performance. International Journal of Physical
Distribution and Logistics
Management, 32(6), 431−454.
McCarthy, T. M., Davis, D. F., Golicic, S. L., & Mentzer, J. T.
(2006, Augustt). The evolution of
sales forecasting management: a 20-year longitudinal study of
forecasting practices.
Journal of Forecasting, 25, 303−324.
McCracken, G. (1988). The Long Interview. Beverly Hills, CA:
Sage Publications, Inc..
Mentzer, J. T., & Kahn, K. B. (1995a). A framework of logistics
research. Journal of Business
Logistics, 16(1), 231−249.
Mentzer, J. T., & Kahn, K. B. (1995b). Forecasting technique
familiarity, satisfaction, usage,
and application. Journal of Forecasting, 14, 465−476.
Mentzer, J. T., & Moon, M. A. (2005). Sales forecasting
management: A demand management
approach. Thousand Oaks, CA: Sage Publications.
Mitchell, T. R., & Nebeker, D. M. (1973). Expectancy theory
predictions of academic effort
and performance. Journal of Applied Psychology, 57, 61−67.
Moon, M. A., & Mentzer, J. T. (1999). Improving sales force
forecasting. Journal of Business
Forecasting Methods & Systems, 18(No. 2), 7−12.
Moon, M.A., Mentzer, J.T., & Thomas, D.E., Jr. (2000).
CustomerdemandplanningatLucent
Technologies. Industrial Marketing Management, 29, 19−26.
Morgan, N. A., Anderson, E. W., & Mittal, V. (2005, Julyy).
Understanding firm's customer
satisfaction information usage. Journal of Marketing, 69,
131−151.
Nissenbaum, H. (1998). A grounded approach to social and
ethical concerns about
technology and education. Journal of Educational Computing
Research, 19(4), 411−432.
Nonaka, I., & Takeuchi, H. (1995). The knowledge-creating
company. New York: Oxford
University Press.
Peterson, R. T. (1993). Improving sales force composite:
forecasting by using scripts.
Journal of Business Forecasting, 12(3), 10−14.
Peterson, R. T. (1988). How efficient are salespeople in surveys
of buyer intentions.
Journal of Business Forecasting, 7(1), 11−12.
Pinder, C. C. (1997). Work motivation in organizational
behavior. Upper Saddle River, NJ:
Prentice-Hall.
Porter, L. W., & Lawler, E. E. (1968). Managerial attitudes and
performance. Homewood,
IL: Richard D. Irwin, Inc.
Ramlall, S. (2004). A review of employee motivation theories
and their implications for
employee retention within organizations. Journal of the
Academy of Business, 5(1/2),
52−63.
Rapp, A., Ahearne, M., Mathieu, J., & Schillewaert, N. (2006).
The impact of knowledge
and empowerment on working smart and working hard; the
moderating role of
experience. International Journal of Research in Marketing, 23,
279−293.
138 T.M. McCarthy Byrne et al. / Industrial Marketing
Management 40 (2011) 128–138
Reese, S. (2000). The human aspects of collaborative
forecasting. Journal of Business
Forecasting, 19(4), 3−9.
Reid, R. A. (1985). How to set up a forecasting process. Journal
of Business Forecasting, 4
(4), 9−10.
Reynolds, P. D. (1971). A primer in theory construction. New
York: Macmillan.
Riehm, S. R. (2001). The Tao of forecasting with promotional
events. Journal of Business
Forecasting, 20(1), 21−23.
Sanders, N. R., & Ritzman, L. P. (2004). Integrating judgmental
and quantitative
forecasts: methodologies for pooling marketing and operations
information.
Journal of Operations and Production Management, 24(5/6),
514−529.
SAS Institute Inc., SAS for Windows, Cary, NC., Version 9.1,
2002.
Schendel, D. E., & Hofer, C. W. (1979). Strategic management:
A new view of business
policy and planning.Brown and Company, Boston: Little 1979.
Schwartz, S. H. (1977). In L. Berkowitz (Ed.), Normative
influences on altruism, in
Advances in Experimental Social Psychology. New York:
Academic Press.
Shiarella, A. H. (January, 1998), Scale of Community Service
Attitudes for College Students.
Paper presented at the Annual Meeting of the Southwest
Educational Research
Association, Houston, TX. Academic Press.
Småros, J., & Hellström, M. (2004). Using the assortment
forecasting method to enable
sales force involvement in forecasting. International Journal of
Physical Distribution
and Logistics Management, 34(1/2), 140−157.
Sriram, V., Krapfel, R., & Spekman, R. (1992, Decemberr).
Antecedents for buyer-seller
collaboration: an analysis from the buyer's perspective. Journal
of Business Research,
25, 303−320.
Steers, R. M., & Porter, L. W. (1983). Motivation & Work
Behavior, Third ed. . New York:
McGraw-Hill.
Stevens, S. (1996). Serious work: students learning from
students. Journal of
Composition Theory, 16(2), 313−324.
Teas, K. R., & Horrell, J. F. (1981, Februaryy). Salespeople
satisfaction and performance
feedback. Industrial Marketing Management, 10, 49−57.
Webby, R., & O'Connor, M. (1996). Judgmental versus
statistical time series forecasting:
a review of the literature. International Journal of Forecasting,
12, 91−118.
Wotruba, T. R., & Thurlow, M. L. (1976). Sales force
participation in quota setting and
sales forecasting. Journal of Marketing, 40(2), 11−16.
Vroom, V. H. (1964). Work and motivation. New York: Wiley.
Teresa M. McCarthy Byrne is an Associate Professor of
Marketing at Bryant University.
Her current research projects explore the degree to which firms
integrate activities
with other firms in their supply chain, such as collaborative
forecasting, demand
management, and demand planning. Her research has been
published in The Journal of
Forecasting, International Journal of Physical Distribution and
Logistics Management,
Transportation Journal, Foresight, Journal of Marketing
Education, and Journal of Business
Forecasting. Prior to earning her Ph.D. from the University of
Tennessee, Knoxville, Dr.
McCarthy Byrne worked in the retail industry for 14 years in
forecasting and inventory
planning and control.
Mark A. Moon is an Associate Professor of Marketing and
Director of the Sales
Forecasting Management Forum at the University of Tennessee,
Knoxville. Prior to
joining the UT faculty in 1993, Dr. Moon earned his Ph.D. from
the University of North
Carolina at Chapel Hill. He also holds MBA and BA degrees
from the University of
Michigan in Ann Arbor. He has published in the International
Journal of Forecasting,
Supply Chain Management Review, Foresight, Journal of
Personal Selling and Sales
Management, Journal of Business Forecasting, Journal of
Marketing Education, Marketing
Education Review, Business Horizons, Industrial Marketing
Management, Journal of
Marketing Theory and Practice, and several international
conference proceedings. Dr.
Moon is also the author, along with Dr. John T. (Tom) Mentzer
of Sales Forecasting
Management: A Demand Management Approach.
John T. Mentzer (1951-2010) was a Chancellor's Professor and
the Harry J. and
Vivienne R. Bruce Excellence Chair of Business in the
Department of Marketing and
Logistics at the University of Tennessee. He published 9 books
and more than 200
articles and papers in the Harvard Business Review, Industrial
Marketing Management,
Journal of Business Logistics, Journal of Marketing,
International Journal of Physical
Distribution and Logistics Management, Journal of Business
Research, Transportation and
Logistics Review, Transportation Journal, Journal of the
Academy of Marketing Science,
Columbia Journal of World Business, Research in Marketing,
Business Horizons, and other
journals. He was the past president of the Academy of
Marketing Science and the
Council of Supply Chain Management Professionals (then the
Council of Logistics
Management). He was the 2004 recipient of the Council of
Logistics Management
Distinguished Service Award, the 2007 recipient of the
International Society of
Logistics Armitage Medal, and the 2008 recipient of the
Academy of Management
Science Distinguished Service Award.
Motivating the industrial sales force in the sales forecasting
processIntroductionTheory buildingExploration and
descriptionSituational variablesCompensation and performance
evaluationUse of environmental conditionsUse of judgmental
inputForecasting trainingFeedback on forecasting
performanceKnowledge of how the forecast is used throughout
the organizationAccess to a forecasting computer programLevel
of others' seriousness placed in the salesperson's
forecastMotivational dimensionsSatisfaction with the
forecasting processForecasting effortSeriousness placed in the
forecasting processExplanationMethodologyData analysis and
resultsDiscussionSeriousness in the forecasting
processSatisfaction with the forecasting processForecasting
effortManagerial implicationsForecasting trainingKnowledge of
how the forecast is used throughout the organizationFeedback
on forecasting performanceAccess to a forecasting computer
programLevel of others' seriousness placed in the salesperson's
forecastTheoretical implicationsDirections for future
researchMeasuresReferences
Econ 3900
Critical Thinking Through Writing Assignments
Project Overview Theme: You are an economic adviser working
for the Federal government in
Washington D.C. President Obama has asked that you prepare
two reports describing the impact
of the 2008 Financial Crisis on the U.S. economy, evaluating
policies undertaken to mitigate the
resulting fall out, and proposing new policies.
Report 1 Assignment (CTW 1):
1. A description of the 2008 Financial Crisis and its impact on
the US Economy. Please use
important economic variables to describe the economy and
explain to the President why
these variables are important.
2. A description of the U.S. economy from the 2008 Financial
Crisis until now. Please
include a description of the current state of the U.S. economy.
3. A description of the monetary policies taken by the Federal
Reserve Bank
4. A description of fiscal policies taken by the Federal
Government
Report 2 Assignment (CTW 2):
1. An evaluation of Monetary Policies taken by the Federal
Reserve Bank. Use the theories
and models we have learned in class to describe the effect of
these polices on the
economy in both the long-run and the short-run. Evaluate
whether these policies were
successful in combatting the recession.
2. An evaluation of the Fiscal policies taken by the Federal
Government. Use the theories
and models we have learned in class to describe the effect of
these polices on the
economy in both the long and short run. Evaluate whether these
policies were successful
in combatting the recessions. Include comments on government
debt.
3. Despite the previous actions taken by both the Federal
Reserve Bank and the Federal
Government, the U.S. economy has yet to fully recover. Use
the theories and models we
have learned in class to propose additional measures the Federal
Reserve Bank/Federal
Government could take to further stimulate the economy.
You are encouraged to include tables and graphs in your
reports. Tables and graphs are to be
placed at the end of the document.
Send Submissions to [email protected]
Submission must be in MS-Word (.doc;.docx) format. Save the
file as
LastName.Firstname.CTW_X
Late submissions will be penalized by 10% per day.
Submissions Due Dates
CTW 1
CTW 2
Submission requirements
Your answer must be typed, used double spacing, Times New
Roman 12 point font. Copying or
plagiarism will be subject to the University’s Academic Honesty
Policy. All sources must be
clearly documented with both an in-text citation and a
bibliographic reference. Failure to
document sources is a clear violation of the honor code, and
will be taken very seriously. If you
use an author’s ideas, even if you do not quote them directly,
you must cite them. This especially
includes any Internet sources. If you are unsure about whether
or not to cite something, feel free
to email me throughout the process. Admitting that you don’t
know something is infinitely better
than making a mistake involving plagiarism.
Grading of this assignment will be done based on the following:
Identifying the issue(s): Clearly
identifying the problem(s), question(s) or issue(s). Providing
background for the problem(s),
question(s) or issue(s). Analytics: Applying economic concepts
to the questions. Developing
logical arguments. Drawing substantiated conclusions. Drawing
connections between economic
concepts and real world applications. Communication and
Structural Organization: Language
clearly and effectively communicates ideas. Assignment is
organized with an introduction, body,
discussion, conclusion and reference section, if applicable.
Grammar, syntax and appropriate
style.
Submissions should be limited to 10 pages of text. That is, text
on the 11
th
page will not be
grades. There is no minimum page requirement, but you should
strive to answer the questions
thoroughly. Figures, tables and references do not count in those
10 pages.
Please include an introduction and conclusion paragraph for
each report.
mailto:[email protected]
Sources of U.S. Economic Data
Bureau of Economic Analysis – www.bea.gov
Bureau of Labor Statistics – www.bls.gov
US Census Bureau – www.census.gov
US Government Printing Office – www.gpo.gov
Source of Information about the US Economy
Federal Reserve Bank – www.FederalReserve.gov
Critical Thinking through Writing Rubric
Total CTW grading = Draft grading + Final version grading.
Total CTW Grade Draft* Final version
100 points 30 points 70 points
* Draft revision is mandatory, which consists 30% of total
grade.
Please evaluate the work on the following skills using the
grading scale, and optional writing comments.
1. Identification
Points 5 4 3 2 1
Grading Scale Excellent Good Average Fair Poor
Criteria
Complete,
appropriate,
no change
Complete but
needs minor
revision in
next cycle
Incomplete
or lacks
clarity
Missing
information,
inaccuracies
Do not
attempt to
or fail to
identify
Identification
Appropriately identifies the problem
Describe concepts and idea
Clearly explains assumption, background, and related theory
Cites textbook and appropriately linked directly to book
Includes essential information on what the concepts and ideas
are for
Comment
2. Analytic
Points 5 4 3 2 1
Grading
Scale
Excellent Good Average Fair Poor
Criteria
Complete,
appropriate, no
change
Complete but
needs minor
revision in next
cycle
Incomplete
or lacks
clarity
Missing
informations,
inaccuracies
Do not
attempt to
or fail to
identify
Analytic
Applies economic concepts (and related formulae) correctly to
the given questions
Understands and solving the problem
http://www.bea.gov/
http://www.bls.gov/
http://www.census.gov/
http://www.gpo.gov/
http://www.federalreserve.gov/
Makes and analyzes logical argument
Conclusions are qualified as the best available evidence within
the context.
Comment
3. Application and Critical Judgment
Points 5 4 3 2 1
Grading Scale Excellent Good Average Fair Poor
Criteria
Complete,
appropriate,
no change
Complete but
needs minor
revision in
next cycle
Incomplete
or lacks
clarity
Missing
informations,
inaccuracies
Do not
attempt to
or fail to
identify
Application
and Critical
Judgment
Analyzes ideas and able to interpret the result from analytical
solution
Sees practical implications of abstract ideas
Analyzes real-world policies and processes
Clearly develops implications and considers ambiguity
Formulates pertinent comments
Includes discussion of validity of content presented in textbook
and opinions
Critical thinking used in clearly stating own opinion and that of
others
carefully cited.
Comment
4. Communication and Structural organization
Points 5 4 3 2 1
Grading Scale Excellent Good Average Fair Poor
Criteria
Complete,
appropriate,
no change
Complete but
needs minor
revision in
next cycle
Incomplete
or lacks
clarity
Missing
informations,
inaccuracies
Do not
attempt to
or fail to
identify
Communication
and
Structural
organization
Language clearly and effectively communicates ideas.
Organization is clear.
Assignment clearly has introduction, body, discussion,
conclusion and
reference section, if applicable.
Grammar, syntax and other errors are minimal.
Style is appropriate.
Comment
5. Creativity (Optional)
Points 5 4 3 2 1
Grading
Scale
Excellent Good Average Fair Poor
Criteria
Complete,
appropriate, no
change
Complete but
needs minor
revision in next
Incomplete
or lacks
clarity
Missing
informations,
inaccuracies
Do not
attempt to
or fail to
cycle identify
Creativity
Conceives interesting questions
Finds new ways to analysis
Comment
1PAGE  3CTW2David GijonGeorgia State University.docx

More Related Content

Similar to 1PAGE 3CTW2David GijonGeorgia State University.docx

The Southern Oregon University 2015 Economic Forecast (1)
The Southern Oregon University 2015 Economic Forecast (1)The Southern Oregon University 2015 Economic Forecast (1)
The Southern Oregon University 2015 Economic Forecast (1)Sophia Panacy
 
Monetary and fiscal policy response and recent developments
Monetary and fiscal policy response and recent developmentsMonetary and fiscal policy response and recent developments
Monetary and fiscal policy response and recent developmentsClaro Ganac
 
Participation Expectations.In order to be eligible for the m.docx
Participation Expectations.In order to be eligible for the m.docxParticipation Expectations.In order to be eligible for the m.docx
Participation Expectations.In order to be eligible for the m.docxdanhaley45372
 
Lesson 6 Discussion Forum    Discussion assignments will be
Lesson 6 Discussion Forum    Discussion assignments will beLesson 6 Discussion Forum    Discussion assignments will be
Lesson 6 Discussion Forum    Discussion assignments will beDioneWang844
 
16 08-27 mmm bulletin
16 08-27 mmm bulletin16 08-27 mmm bulletin
16 08-27 mmm bulletinSean Corrigan
 
Macroeconomics NameCourseInstructorInstitutio.docx
Macroeconomics NameCourseInstructorInstitutio.docxMacroeconomics NameCourseInstructorInstitutio.docx
Macroeconomics NameCourseInstructorInstitutio.docxinfantsuk
 
Essay On Fiscal Policy
Essay On Fiscal PolicyEssay On Fiscal Policy
Essay On Fiscal PolicyJulie Brown
 
Policy Rate, Lending Rate and Investment in Africa - A Phd proposal for defense
Policy Rate, Lending Rate and Investment in Africa - A Phd proposal for defensePolicy Rate, Lending Rate and Investment in Africa - A Phd proposal for defense
Policy Rate, Lending Rate and Investment in Africa - A Phd proposal for defenseSamuel Agyei
 
Case Study on Financial crisis of 2007 Case-Study
Case Study on Financial crisis of 2007 Case-StudyCase Study on Financial crisis of 2007 Case-Study
Case Study on Financial crisis of 2007 Case-StudyRasonablePrincelJame
 

Similar to 1PAGE 3CTW2David GijonGeorgia State University.docx (16)

The Southern Oregon University 2015 Economic Forecast (1)
The Southern Oregon University 2015 Economic Forecast (1)The Southern Oregon University 2015 Economic Forecast (1)
The Southern Oregon University 2015 Economic Forecast (1)
 
What is fiscal policy
What is fiscal policyWhat is fiscal policy
What is fiscal policy
 
Monetary and fiscal policy response and recent developments
Monetary and fiscal policy response and recent developmentsMonetary and fiscal policy response and recent developments
Monetary and fiscal policy response and recent developments
 
Participation Expectations.In order to be eligible for the m.docx
Participation Expectations.In order to be eligible for the m.docxParticipation Expectations.In order to be eligible for the m.docx
Participation Expectations.In order to be eligible for the m.docx
 
Lesson 6 Discussion Forum    Discussion assignments will be
Lesson 6 Discussion Forum    Discussion assignments will beLesson 6 Discussion Forum    Discussion assignments will be
Lesson 6 Discussion Forum    Discussion assignments will be
 
Chap010
Chap010Chap010
Chap010
 
Economy Essay
Economy EssayEconomy Essay
Economy Essay
 
16 08-27 mmm bulletin
16 08-27 mmm bulletin16 08-27 mmm bulletin
16 08-27 mmm bulletin
 
Macroeconomics NameCourseInstructorInstitutio.docx
Macroeconomics NameCourseInstructorInstitutio.docxMacroeconomics NameCourseInstructorInstitutio.docx
Macroeconomics NameCourseInstructorInstitutio.docx
 
Essay On Fiscal Policy
Essay On Fiscal PolicyEssay On Fiscal Policy
Essay On Fiscal Policy
 
Policy Rate, Lending Rate and Investment in Africa - A Phd proposal for defense
Policy Rate, Lending Rate and Investment in Africa - A Phd proposal for defensePolicy Rate, Lending Rate and Investment in Africa - A Phd proposal for defense
Policy Rate, Lending Rate and Investment in Africa - A Phd proposal for defense
 
Monetary policy
Monetary policy  Monetary policy
Monetary policy
 
INTERNATIONAL MONETARY FUND
INTERNATIONAL MONETARY FUNDINTERNATIONAL MONETARY FUND
INTERNATIONAL MONETARY FUND
 
Econ Term Paper
Econ Term PaperEcon Term Paper
Econ Term Paper
 
AGA Article 6 -2013
AGA Article 6 -2013AGA Article 6 -2013
AGA Article 6 -2013
 
Case Study on Financial crisis of 2007 Case-Study
Case Study on Financial crisis of 2007 Case-StudyCase Study on Financial crisis of 2007 Case-Study
Case Study on Financial crisis of 2007 Case-Study
 

More from eugeniadean34240

I need a 7 pg research essay on the following   Select a real o.docx
I need a 7 pg research essay on the following   Select a real o.docxI need a 7 pg research essay on the following   Select a real o.docx
I need a 7 pg research essay on the following   Select a real o.docxeugeniadean34240
 
I need a 4-5 APA formatted paper with references that is clearly wri.docx
I need a 4-5 APA formatted paper with references that is clearly wri.docxI need a 4-5 APA formatted paper with references that is clearly wri.docx
I need a 4-5 APA formatted paper with references that is clearly wri.docxeugeniadean34240
 
I need a 3 page research paper on Title  Addictive being youn.docx
I need a 3 page research paper on Title  Addictive being youn.docxI need a 3 page research paper on Title  Addictive being youn.docx
I need a 3 page research paper on Title  Addictive being youn.docxeugeniadean34240
 
I need a 3 page double-spaced 12-point paper on Immunotherapy. the i.docx
I need a 3 page double-spaced 12-point paper on Immunotherapy. the i.docxI need a 3 page double-spaced 12-point paper on Immunotherapy. the i.docx
I need a 3 page double-spaced 12-point paper on Immunotherapy. the i.docxeugeniadean34240
 
I need a 2500 word essay on the 1st Battalion 7th Cavalry Regiment. .docx
I need a 2500 word essay on the 1st Battalion 7th Cavalry Regiment. .docxI need a 2500 word essay on the 1st Battalion 7th Cavalry Regiment. .docx
I need a 2500 word essay on the 1st Battalion 7th Cavalry Regiment. .docxeugeniadean34240
 
I need a 200-word paper that answers the following questions:D.docx
I need a 200-word paper that answers the following questions:D.docxI need a 200-word paper that answers the following questions:D.docx
I need a 200-word paper that answers the following questions:D.docxeugeniadean34240
 
i need a 2 page essay on LA crimes as it pertains to Rape you will h.docx
i need a 2 page essay on LA crimes as it pertains to Rape you will h.docxi need a 2 page essay on LA crimes as it pertains to Rape you will h.docx
i need a 2 page essay on LA crimes as it pertains to Rape you will h.docxeugeniadean34240
 
I need a 1 page professional bio. My cover letter and resume i.docx
I need a 1 page professional bio. My cover letter and resume i.docxI need a 1 page professional bio. My cover letter and resume i.docx
I need a 1 page professional bio. My cover letter and resume i.docxeugeniadean34240
 
I need 100 words response for this two discussion forum1 discu.docx
I need 100 words response for this two discussion forum1 discu.docxI need 100 words response for this two discussion forum1 discu.docx
I need 100 words response for this two discussion forum1 discu.docxeugeniadean34240
 
I need 200 words response for each discussion post.Guided Respon.docx
I need 200 words response for each discussion post.Guided Respon.docxI need 200 words response for each discussion post.Guided Respon.docx
I need 200 words response for each discussion post.Guided Respon.docxeugeniadean34240
 
I need 3 pages discussion for an intersection (Attached image).docx
I need 3 pages discussion for an intersection (Attached image).docxI need 3 pages discussion for an intersection (Attached image).docx
I need 3 pages discussion for an intersection (Attached image).docxeugeniadean34240
 
I need 1page write up on Hypothesis & Methods Proposal,Due on .docx
I need 1page write up on Hypothesis & Methods Proposal,Due on .docxI need 1page write up on Hypothesis & Methods Proposal,Due on .docx
I need 1page write up on Hypothesis & Methods Proposal,Due on .docxeugeniadean34240
 
I need 2-3 pages written about the sieve of Eratosthenes. Starti.docx
I need 2-3 pages written about the sieve of Eratosthenes. Starti.docxI need 2-3 pages written about the sieve of Eratosthenes. Starti.docx
I need 2-3 pages written about the sieve of Eratosthenes. Starti.docxeugeniadean34240
 
I need 120 words for each question. Please ensure to post individual.docx
I need 120 words for each question. Please ensure to post individual.docxI need 120 words for each question. Please ensure to post individual.docx
I need 120 words for each question. Please ensure to post individual.docxeugeniadean34240
 
I need 10-12 slides Presentation with detailed speaker notes. Instru.docx
I need 10-12 slides Presentation with detailed speaker notes. Instru.docxI need 10-12 slides Presentation with detailed speaker notes. Instru.docx
I need 10-12 slides Presentation with detailed speaker notes. Instru.docxeugeniadean34240
 
I N N O V A T I O N N E T W O R K , I N C . www.innone.docx
I N N O V A T I O N  N E T W O R K ,  I N C .   www.innone.docxI N N O V A T I O N  N E T W O R K ,  I N C .   www.innone.docx
I N N O V A T I O N N E T W O R K , I N C . www.innone.docxeugeniadean34240
 
I like to tie my learning to Biblical Principles. On Virtuous Le.docx
I like to tie my learning to Biblical Principles. On Virtuous Le.docxI like to tie my learning to Biblical Principles. On Virtuous Le.docx
I like to tie my learning to Biblical Principles. On Virtuous Le.docxeugeniadean34240
 
I just want one paragraph.!!C.W.Mills described ‘sociological im.docx
I just want one paragraph.!!C.W.Mills described ‘sociological im.docxI just want one paragraph.!!C.W.Mills described ‘sociological im.docx
I just want one paragraph.!!C.W.Mills described ‘sociological im.docxeugeniadean34240
 
i just need serious help answering the question. I have answered mos.docx
i just need serious help answering the question. I have answered mos.docxi just need serious help answering the question. I have answered mos.docx
i just need serious help answering the question. I have answered mos.docxeugeniadean34240
 
I Headnotes and indexes are copyrighted and may not be duplica.docx
I Headnotes and indexes are copyrighted and may not be duplica.docxI Headnotes and indexes are copyrighted and may not be duplica.docx
I Headnotes and indexes are copyrighted and may not be duplica.docxeugeniadean34240
 

More from eugeniadean34240 (20)

I need a 7 pg research essay on the following   Select a real o.docx
I need a 7 pg research essay on the following   Select a real o.docxI need a 7 pg research essay on the following   Select a real o.docx
I need a 7 pg research essay on the following   Select a real o.docx
 
I need a 4-5 APA formatted paper with references that is clearly wri.docx
I need a 4-5 APA formatted paper with references that is clearly wri.docxI need a 4-5 APA formatted paper with references that is clearly wri.docx
I need a 4-5 APA formatted paper with references that is clearly wri.docx
 
I need a 3 page research paper on Title  Addictive being youn.docx
I need a 3 page research paper on Title  Addictive being youn.docxI need a 3 page research paper on Title  Addictive being youn.docx
I need a 3 page research paper on Title  Addictive being youn.docx
 
I need a 3 page double-spaced 12-point paper on Immunotherapy. the i.docx
I need a 3 page double-spaced 12-point paper on Immunotherapy. the i.docxI need a 3 page double-spaced 12-point paper on Immunotherapy. the i.docx
I need a 3 page double-spaced 12-point paper on Immunotherapy. the i.docx
 
I need a 2500 word essay on the 1st Battalion 7th Cavalry Regiment. .docx
I need a 2500 word essay on the 1st Battalion 7th Cavalry Regiment. .docxI need a 2500 word essay on the 1st Battalion 7th Cavalry Regiment. .docx
I need a 2500 word essay on the 1st Battalion 7th Cavalry Regiment. .docx
 
I need a 200-word paper that answers the following questions:D.docx
I need a 200-word paper that answers the following questions:D.docxI need a 200-word paper that answers the following questions:D.docx
I need a 200-word paper that answers the following questions:D.docx
 
i need a 2 page essay on LA crimes as it pertains to Rape you will h.docx
i need a 2 page essay on LA crimes as it pertains to Rape you will h.docxi need a 2 page essay on LA crimes as it pertains to Rape you will h.docx
i need a 2 page essay on LA crimes as it pertains to Rape you will h.docx
 
I need a 1 page professional bio. My cover letter and resume i.docx
I need a 1 page professional bio. My cover letter and resume i.docxI need a 1 page professional bio. My cover letter and resume i.docx
I need a 1 page professional bio. My cover letter and resume i.docx
 
I need 100 words response for this two discussion forum1 discu.docx
I need 100 words response for this two discussion forum1 discu.docxI need 100 words response for this two discussion forum1 discu.docx
I need 100 words response for this two discussion forum1 discu.docx
 
I need 200 words response for each discussion post.Guided Respon.docx
I need 200 words response for each discussion post.Guided Respon.docxI need 200 words response for each discussion post.Guided Respon.docx
I need 200 words response for each discussion post.Guided Respon.docx
 
I need 3 pages discussion for an intersection (Attached image).docx
I need 3 pages discussion for an intersection (Attached image).docxI need 3 pages discussion for an intersection (Attached image).docx
I need 3 pages discussion for an intersection (Attached image).docx
 
I need 1page write up on Hypothesis & Methods Proposal,Due on .docx
I need 1page write up on Hypothesis & Methods Proposal,Due on .docxI need 1page write up on Hypothesis & Methods Proposal,Due on .docx
I need 1page write up on Hypothesis & Methods Proposal,Due on .docx
 
I need 2-3 pages written about the sieve of Eratosthenes. Starti.docx
I need 2-3 pages written about the sieve of Eratosthenes. Starti.docxI need 2-3 pages written about the sieve of Eratosthenes. Starti.docx
I need 2-3 pages written about the sieve of Eratosthenes. Starti.docx
 
I need 120 words for each question. Please ensure to post individual.docx
I need 120 words for each question. Please ensure to post individual.docxI need 120 words for each question. Please ensure to post individual.docx
I need 120 words for each question. Please ensure to post individual.docx
 
I need 10-12 slides Presentation with detailed speaker notes. Instru.docx
I need 10-12 slides Presentation with detailed speaker notes. Instru.docxI need 10-12 slides Presentation with detailed speaker notes. Instru.docx
I need 10-12 slides Presentation with detailed speaker notes. Instru.docx
 
I N N O V A T I O N N E T W O R K , I N C . www.innone.docx
I N N O V A T I O N  N E T W O R K ,  I N C .   www.innone.docxI N N O V A T I O N  N E T W O R K ,  I N C .   www.innone.docx
I N N O V A T I O N N E T W O R K , I N C . www.innone.docx
 
I like to tie my learning to Biblical Principles. On Virtuous Le.docx
I like to tie my learning to Biblical Principles. On Virtuous Le.docxI like to tie my learning to Biblical Principles. On Virtuous Le.docx
I like to tie my learning to Biblical Principles. On Virtuous Le.docx
 
I just want one paragraph.!!C.W.Mills described ‘sociological im.docx
I just want one paragraph.!!C.W.Mills described ‘sociological im.docxI just want one paragraph.!!C.W.Mills described ‘sociological im.docx
I just want one paragraph.!!C.W.Mills described ‘sociological im.docx
 
i just need serious help answering the question. I have answered mos.docx
i just need serious help answering the question. I have answered mos.docxi just need serious help answering the question. I have answered mos.docx
i just need serious help answering the question. I have answered mos.docx
 
I Headnotes and indexes are copyrighted and may not be duplica.docx
I Headnotes and indexes are copyrighted and may not be duplica.docxI Headnotes and indexes are copyrighted and may not be duplica.docx
I Headnotes and indexes are copyrighted and may not be duplica.docx
 

Recently uploaded

Presentation by Andreas Schleicher Tackling the School Absenteeism Crisis 30 ...
Presentation by Andreas Schleicher Tackling the School Absenteeism Crisis 30 ...Presentation by Andreas Schleicher Tackling the School Absenteeism Crisis 30 ...
Presentation by Andreas Schleicher Tackling the School Absenteeism Crisis 30 ...EduSkills OECD
 
Hybridoma Technology ( Production , Purification , and Application )
Hybridoma Technology  ( Production , Purification , and Application  ) Hybridoma Technology  ( Production , Purification , and Application  )
Hybridoma Technology ( Production , Purification , and Application ) Sakshi Ghasle
 
Call Girls in Dwarka Mor Delhi Contact Us 9654467111
Call Girls in Dwarka Mor Delhi Contact Us 9654467111Call Girls in Dwarka Mor Delhi Contact Us 9654467111
Call Girls in Dwarka Mor Delhi Contact Us 9654467111Sapana Sha
 
1029 - Danh muc Sach Giao Khoa 10 . pdf
1029 -  Danh muc Sach Giao Khoa 10 . pdf1029 -  Danh muc Sach Giao Khoa 10 . pdf
1029 - Danh muc Sach Giao Khoa 10 . pdfQucHHunhnh
 
Privatization and Disinvestment - Meaning, Objectives, Advantages and Disadva...
Privatization and Disinvestment - Meaning, Objectives, Advantages and Disadva...Privatization and Disinvestment - Meaning, Objectives, Advantages and Disadva...
Privatization and Disinvestment - Meaning, Objectives, Advantages and Disadva...RKavithamani
 
Student login on Anyboli platform.helpin
Student login on Anyboli platform.helpinStudent login on Anyboli platform.helpin
Student login on Anyboli platform.helpinRaunakKeshri1
 
Z Score,T Score, Percential Rank and Box Plot Graph
Z Score,T Score, Percential Rank and Box Plot GraphZ Score,T Score, Percential Rank and Box Plot Graph
Z Score,T Score, Percential Rank and Box Plot GraphThiyagu K
 
A Critique of the Proposed National Education Policy Reform
A Critique of the Proposed National Education Policy ReformA Critique of the Proposed National Education Policy Reform
A Critique of the Proposed National Education Policy ReformChameera Dedduwage
 
Activity 01 - Artificial Culture (1).pdf
Activity 01 - Artificial Culture (1).pdfActivity 01 - Artificial Culture (1).pdf
Activity 01 - Artificial Culture (1).pdfciinovamais
 
Introduction to AI in Higher Education_draft.pptx
Introduction to AI in Higher Education_draft.pptxIntroduction to AI in Higher Education_draft.pptx
Introduction to AI in Higher Education_draft.pptxpboyjonauth
 
Accessible design: Minimum effort, maximum impact
Accessible design: Minimum effort, maximum impactAccessible design: Minimum effort, maximum impact
Accessible design: Minimum effort, maximum impactdawncurless
 
URLs and Routing in the Odoo 17 Website App
URLs and Routing in the Odoo 17 Website AppURLs and Routing in the Odoo 17 Website App
URLs and Routing in the Odoo 17 Website AppCeline George
 
Web & Social Media Analytics Previous Year Question Paper.pdf
Web & Social Media Analytics Previous Year Question Paper.pdfWeb & Social Media Analytics Previous Year Question Paper.pdf
Web & Social Media Analytics Previous Year Question Paper.pdfJayanti Pande
 
microwave assisted reaction. General introduction
microwave assisted reaction. General introductionmicrowave assisted reaction. General introduction
microwave assisted reaction. General introductionMaksud Ahmed
 
Paris 2024 Olympic Geographies - an activity
Paris 2024 Olympic Geographies - an activityParis 2024 Olympic Geographies - an activity
Paris 2024 Olympic Geographies - an activityGeoBlogs
 
Separation of Lanthanides/ Lanthanides and Actinides
Separation of Lanthanides/ Lanthanides and ActinidesSeparation of Lanthanides/ Lanthanides and Actinides
Separation of Lanthanides/ Lanthanides and ActinidesFatimaKhan178732
 
Introduction to ArtificiaI Intelligence in Higher Education
Introduction to ArtificiaI Intelligence in Higher EducationIntroduction to ArtificiaI Intelligence in Higher Education
Introduction to ArtificiaI Intelligence in Higher Educationpboyjonauth
 
Sanyam Choudhary Chemistry practical.pdf
Sanyam Choudhary Chemistry practical.pdfSanyam Choudhary Chemistry practical.pdf
Sanyam Choudhary Chemistry practical.pdfsanyamsingh5019
 

Recently uploaded (20)

Presentation by Andreas Schleicher Tackling the School Absenteeism Crisis 30 ...
Presentation by Andreas Schleicher Tackling the School Absenteeism Crisis 30 ...Presentation by Andreas Schleicher Tackling the School Absenteeism Crisis 30 ...
Presentation by Andreas Schleicher Tackling the School Absenteeism Crisis 30 ...
 
Hybridoma Technology ( Production , Purification , and Application )
Hybridoma Technology  ( Production , Purification , and Application  ) Hybridoma Technology  ( Production , Purification , and Application  )
Hybridoma Technology ( Production , Purification , and Application )
 
Call Girls in Dwarka Mor Delhi Contact Us 9654467111
Call Girls in Dwarka Mor Delhi Contact Us 9654467111Call Girls in Dwarka Mor Delhi Contact Us 9654467111
Call Girls in Dwarka Mor Delhi Contact Us 9654467111
 
1029 - Danh muc Sach Giao Khoa 10 . pdf
1029 -  Danh muc Sach Giao Khoa 10 . pdf1029 -  Danh muc Sach Giao Khoa 10 . pdf
1029 - Danh muc Sach Giao Khoa 10 . pdf
 
Privatization and Disinvestment - Meaning, Objectives, Advantages and Disadva...
Privatization and Disinvestment - Meaning, Objectives, Advantages and Disadva...Privatization and Disinvestment - Meaning, Objectives, Advantages and Disadva...
Privatization and Disinvestment - Meaning, Objectives, Advantages and Disadva...
 
Student login on Anyboli platform.helpin
Student login on Anyboli platform.helpinStudent login on Anyboli platform.helpin
Student login on Anyboli platform.helpin
 
Z Score,T Score, Percential Rank and Box Plot Graph
Z Score,T Score, Percential Rank and Box Plot GraphZ Score,T Score, Percential Rank and Box Plot Graph
Z Score,T Score, Percential Rank and Box Plot Graph
 
A Critique of the Proposed National Education Policy Reform
A Critique of the Proposed National Education Policy ReformA Critique of the Proposed National Education Policy Reform
A Critique of the Proposed National Education Policy Reform
 
Activity 01 - Artificial Culture (1).pdf
Activity 01 - Artificial Culture (1).pdfActivity 01 - Artificial Culture (1).pdf
Activity 01 - Artificial Culture (1).pdf
 
Introduction to AI in Higher Education_draft.pptx
Introduction to AI in Higher Education_draft.pptxIntroduction to AI in Higher Education_draft.pptx
Introduction to AI in Higher Education_draft.pptx
 
Accessible design: Minimum effort, maximum impact
Accessible design: Minimum effort, maximum impactAccessible design: Minimum effort, maximum impact
Accessible design: Minimum effort, maximum impact
 
URLs and Routing in the Odoo 17 Website App
URLs and Routing in the Odoo 17 Website AppURLs and Routing in the Odoo 17 Website App
URLs and Routing in the Odoo 17 Website App
 
Mattingly "AI & Prompt Design: The Basics of Prompt Design"
Mattingly "AI & Prompt Design: The Basics of Prompt Design"Mattingly "AI & Prompt Design: The Basics of Prompt Design"
Mattingly "AI & Prompt Design: The Basics of Prompt Design"
 
Web & Social Media Analytics Previous Year Question Paper.pdf
Web & Social Media Analytics Previous Year Question Paper.pdfWeb & Social Media Analytics Previous Year Question Paper.pdf
Web & Social Media Analytics Previous Year Question Paper.pdf
 
microwave assisted reaction. General introduction
microwave assisted reaction. General introductionmicrowave assisted reaction. General introduction
microwave assisted reaction. General introduction
 
Paris 2024 Olympic Geographies - an activity
Paris 2024 Olympic Geographies - an activityParis 2024 Olympic Geographies - an activity
Paris 2024 Olympic Geographies - an activity
 
Separation of Lanthanides/ Lanthanides and Actinides
Separation of Lanthanides/ Lanthanides and ActinidesSeparation of Lanthanides/ Lanthanides and Actinides
Separation of Lanthanides/ Lanthanides and Actinides
 
Introduction to ArtificiaI Intelligence in Higher Education
Introduction to ArtificiaI Intelligence in Higher EducationIntroduction to ArtificiaI Intelligence in Higher Education
Introduction to ArtificiaI Intelligence in Higher Education
 
Sanyam Choudhary Chemistry practical.pdf
Sanyam Choudhary Chemistry practical.pdfSanyam Choudhary Chemistry practical.pdf
Sanyam Choudhary Chemistry practical.pdf
 
TataKelola dan KamSiber Kecerdasan Buatan v022.pdf
TataKelola dan KamSiber Kecerdasan Buatan v022.pdfTataKelola dan KamSiber Kecerdasan Buatan v022.pdf
TataKelola dan KamSiber Kecerdasan Buatan v022.pdf
 

1PAGE 3CTW2David GijonGeorgia State University.docx

  • 1. 1 PAGE 3 CTW2 David Gijon Georgia State University 7/21/2014 1. Monetary policies in the wake of the Financial Crisis of 2008 The initial response of the Federal Reserve Bank of America was in the form of cutting interest rates by 50 basis points. With the realization the financial hardship was still persistent across the nation, the Federal Open Committee moved in to reduce the (FFR) Federal Funds Rate, which originally stood at 5.25%. The new rate was now 2 percent. This reduction was carried out in the period between September 2007 and April 2008 (Thornton, 2010). Additionally, the basic lending rate was brought down to 25 basis points. This was also followed by the introduction of Term Auction Facility. At a significant level the Fed has historically contracted or expanded its balance sheet through its investing and lending activities. The effect of these monetary policies was to expand or contract the monetary base as well as the supply of credit. Considering the banking system structure, as well as, the reserve requirements; changes in monetary base are aimed at altering the money supply. The effect on the supply of money is the manner in which the Fed influences the interest rates (Thornton, 2004). This brings about the liquidity effect which is characterized by a high supply of money and reduced interest rates. Despite the fact that the demand for money may
  • 2. not be necessarily influenced by interest rates the lending and investing activities of the Fed affect the availability of credit. One instance where such monetary policy was used by the Fed is in the aftermath of the Lehman Bros collapse. In what was termed as quantitative easing 1, the Fed purchased securities backed by mortgages, agency debt and long term treasuries. This was followed by quantitative easing 2 QE2 whereby further long term treasuries were purchased (Joyce et al., 2010). These measures by the Fed were aimed at increasing aggregate demand through a reduction of long term yields. Sadly the QEs did not achieve the desired long term yields as the Feds had anticipated. Generally, borrowing too did not pick up as had been anticipated in the increase of credit supply. 2. Fiscal policies after the financial melt down The reasonable thing to do in the event of a financial crisis is to induce aggregate demand. There exists a disagreement on the manner in which aggregate demand can be expanded. Government spending is one of the commonly used fiscal policies: it is usually aimed at reversing the effects of recessions such as unemployment, loss of benefits, and decline in tax revenues, which stem from the decline in the economic activities. On the same note other discretionary measures such as tax rates reduction or tax holidays on businesses and households can be used to quicken the economic recovery. The government would also try to offer loans to states and firms as well as, grants and contracts for investment. These were the fiscal tools employed by the federal government in the wake of the financial crisis of 2008. The government employed several government expenditures which are rare countercyclical measures. The first initial government expenditure was used by G.W. Bush in the purchase of huge non-performing financial assets from banks on the verge of collapse. These activities are considered fiscal because for purchase of such private liabilities by the fed must be approved by the congress. In a budget funded
  • 3. by the congress at a cost of $700 billion the treasury bought the assets from the troubled banks. This initiative was known as Troubled Asset Relief Program (TARP). Through the TARP initiative funds were induced into the ailing corporations such as GM , AIG and Citigroup. The underlying idea was to strengthen banks’ balance sheet with an aim of inducing the flow of credit easily to finance investments. Another fiscal action taken by the government was the ARRA (American Recovery and Reinvestment Act) of 2009. This approach appropriated $787 billion in terms of tax cuts, as well as benefits to firms and individuals. The government also used other measures such as TANF (Temporary Assistance to Needy Families) program in conjunction with other emergency funds (Gali, Lopez-Salido & Valles, 2005). The ARRA and TANF were positive measure but sadly only comprised 10 percent of the GDP. Additionally, the measures had a small impact as they were inadequate when it comes to direction and size. The programs had insignificant contribution to the recovery of the economy perhaps due to their small size. 3. Further steps the Federal reserve/government cab stimulate the economy. The Federal Reserve achieves its target by controlling the interest rates when inflation goes up and when the economy is struggling. This move aims at controlling the supply of money in the economy. FFR (Federal Funds Rates) are some of the tools the Federal Reserve uses to control the supply of money. Federal Funds Rate is the charged on inter- bank borrowing. This borrowing occurs between banks with excess reserves and those with a shortage in the authorized reserves (Alesina & Giavazzi, 2013). The interest charged on such borrowing is called Federal Funds Rate which is controlled by the actions of reserves demand and supply. Regulation of the funds rate is a sure way to improve the economy.
  • 4. Good description of monetary and fiscal policies. Needs to include policy recommendations, applications of a model, introduction, and conclusion. Grammar is pretty good, needs proofreading. References Gali, J. Lopez-Salido, D. and Valles, J. (2005). “Understanding the Effects of Government Spending on Consumption,” CREI. Joyce et al., (2010). “The Financial Market Impact of Quantitative Easing,” Bank of England Working Paper 393. Thornton, D.L. (2010c). “Monetary Policy and Longer-Term Rates: An Opportunity for Greater Transparency,” Federal Reserve Bank of St. Louis Economic Synopses, No. 36. Thornton, D.L. (2004). “The Fed and Short-term Interest Rates: Is It Open Market Operations, Open Mouth Operations or Interest Rate Smoothing?” Journal of Banking and Finance, 28(3), 475-98. Alesina, A., & Giavazzi, F. (2013). Fiscal policy after the financial crisis. University of Chicago Press: Chicago. �Which one? Apply a model from the book �What? �How would this work? Use a model �Different bailout
  • 5. �Not enough detail. Evidence? Apply the policies to a model �Target what? �Doesn’t this belong in the monetary policy section? You talked about how the Fed already used this tool PAGE 3 Industrial Marketing Management 40 (2011) 128–138 Contents lists available at ScienceDirect Industrial Marketing Management Motivating the industrial sales force in the sales forecasting process Teresa M. McCarthy Byrne a,⁎, Mark A. Moon b,1, John T. Mentzer b,1 a Bryant University, Department of Marketing, 1150 Douglas Pike, Smithfield, RI 02917, USA b University of Tennessee, Department of Marketing and Logistics, 324 Stokely Management Center, Knoxville, TN 37996, USA ⁎ Corresponding author. Tel.: +1 401 232 6801. E-mail addresses: [email protected] (T.M. McCar
  • 6. (M.A. Moon). 1 Tel.: +1 865 974 8062. 0019-8501/$ – see front matter © 2010 Elsevier Inc. Al doi:10.1016/j.indmarman.2010.06.003 a b s t r a c t a r t i c l e i n f o Article history: Received 14 July 2008 Received in revised form 2 June 2009 Accepted 10 May 2010 Available online 10 July 2010 Keywords: Sales forecasting Motivation Job satisfaction Job seriousness Forecasting training Previous research has recognized the value of the industrial salesperson's role in the sales forecasting process, and offered normative descriptions of what that role should be. However, no studies have been conducted to determine the variables that motivate industrial sales force involvement in and contribution to the sales forecasting process. This study employed depth interviews and survey research to develop and test a conceptual model of industrial sales force forecasting motivation. The research identifies five environmental signals that can be employed by managers to impact an industrial salesperson's level of satisfaction with, effort directed towards, and seriousness placed in the sales forecasting process. thy Byrne), [email protected] l rights reserved.
  • 7. © 2010 Elsevier Inc. All rights reserved. 1. Introduction The integral role of sales forecasting in the corporate planning process and as a contributor to corporate success is widely recognized (Dalrymple, 1975, December, Fildes, and Beard, 1992; Makridakis, and Wheelwright, 1977, October; Mentzer, and Moon, 2005; Reid, 1985). The critical role of an organization's sales force in developing the forecast has also been well established (Dalrymple, 1975, Decem- ber;1987; McCarthy, Davis, Golicic, and Mentzer, 2006, August; Mentzer, and Kahn, 1995a; Moon, Mentzer, and Thomas, 2000). For example, a company's salespeople can contribute valuable information tothe sales forecastingprocess byacquiringmarket intelligence through direct conversations with their customers. Indeed, research has shown that sales force composite continues to be a popular and frequently used forecasting technique (Dalrymple, 1987; McCarthy et al., 2006, August; Mentzer, and Kahn, 1995a). Furthermore,the trendtoward partnerships within the supply chain has fueled the practice of collaborative forecasting (McCarthy, and Golicic, 2002; Sriram, Krapfel, and Spekman, 1992, December), and the sales force fulfills this boundary- spanning forecasting function between the organization and its
  • 8. downstream supply chain partners. Despite the important role of the industrial sales force in sales forecasting, research illustrates that many salespeople are unmotivated to perform their forecasting responsibilities, arising from a belief that time spent on forecasting usurps time that should be spent developing customer relationships and selling products (Moon, and Mentzer, 1999). Research on sales force forecasting is largely devoted to empirical studies examining the salesperson's impact on forecast accuracy related to the use of a specific technique or practice, such as sales force composite (Peterson, 1993), the assortment forecasting method (Småros, and Hellström, 2004), survey of buyer intention (Peterson, 1988), and involvement in quota setting (Wotruba, and Thurlow, 1976). Inaddition,severalapplied cases describethe natureof thesalesperson's involvement in a particular company's forecasting process (e.g., Barash, and Mitchell, 1998; Reese, 2000; Riehm, 2001; Småros, and Hellström, 2004). Cox (1989) and Moon, and Mentzer (1999) descriptive studies recommend strategies for improving sales force forecasting perfor- mance. Notwithstanding the contribution of these studies to increasing our knowledge of the role of salespeople in sales forecasting, there is a
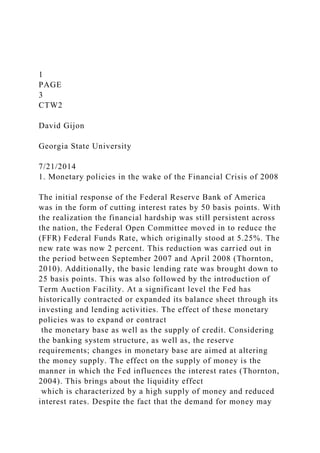
  • 9. dearth of research focused on identifying the specific factors that motivate and direct industrial sales force behavior in the sales forecasting process. Our study fills this gap in the literature by identifying and testing variables that impact sales force motivation in the sales forecasting process. The purpose of this paper is to develop a theory of industrial sales force forecasting that will inform managers of the controllable variables that can motivate sales force involvement in their forecasting responsibilities. The following section reviews the theory building approach and methodologies applied in this paper. In the next section we employ qualitative interviews and literature review to identify the variables and develop a conceptual model relevant to motivating the industrial sales force in the sales forecasting process. Subsequently, we develop an exploratory measurement instrument to empirically test the model using survey methodology. Results of the exploratory survey are http://dx.doi.org/10.1016/j.indmarman.2010.06.003 mailto:[email protected] mailto:[email protected] http://dx.doi.org/10.1016/j.indmarman.2010.06.003 http://www.sciencedirect.com/science/journal/00198501 Fig. 1. Conceptual model of industrial sales force sales forecasting motivation.
  • 10. 129T.M. McCarthy Byrne et al. / Industrial Marketing Management 40 (2011) 128–138 presented and discussed, followed by implications and suggestions for future research. 2. Theory building Our research follows the Reynolds (1971) three-step approach to theory building: exploratory, descriptive, and explanatory research. Among the data-gathering methods recommended for theory devel- opment are observation, unstructured and structured interviews, surveys, documents, and experiments (Schendel, and Hofer, 1979; Reynolds, 1971). Mentzer, and Kahn (1995b) recommend that researchers begin the idea generation process with observation and literature review. As such, in this multi-method study, we employ observation from depth interviews, literature review, and a survey questionnaire to build theory. Specifically, for the exploratory stage of theory building, our study employs observation and analysis of the sales forecasting manage- ment practices at 24 industrial marketing companies to “identify the phenomena of interest and describe its key characteristics” (Schendel, and Hofer, 1979, p. 385.), as well as a review of the literature
  • 11. related to sales forecasting and industrial sales force motivation. Our descriptive stage involves developing the theoretical model and hypotheses explaining the relationships between variables identified in the first stage. The explanatory stage empirically tests the relationships hypothesized in the second stage using exploratory survey method- ology. Following the description and findings of each stage of the research presented below, discussion, implications, and recommen- dations for industrial marketing managers and for future research are presented. 2.1. Exploration and description Depth interviews were conducted following conventional protocols developed by Churchill (1979, February) and McCracken (1988) at 24 industrial marketing companies toobserve sales forecasting management practices. Informed by persistent themes emerging from the interviews, we reviewed the extant literature on industrial sales force motivation and sales forecasting practices to provide a theoretical foundation for the interview themes. This dual approach to exploration allows for triangulation whereby the researcher is constantly tacking back and forth among the data sources – including the interview data and relevant
  • 12. literature – to discern the dimensions associated with sales force forecasting, and to facilitate development and refinement of constructs and measures for the descriptive stage of theory building (Morgan, Anderson, and Mittal, 2005, July). Specifically, in this section, we conduct exploration by reviewing the qualitative interview data and the sales force motivation and sales force forecasting literature to identify relevant situational and motivational variables, and description by discerning patterns and making empirical generalizations in the form of identifying relationships among the variables. We explore the situational variables that lead to increased motivation in industrial sales force forecasting, and then examine the specific motivational dimensions related to sales forecasting productivity. The variables that emerged from the depth interviews and the sales force motivation and forecasting literature review, and the relationships between those variables, are shown in Fig. 1. The companies that participated in the interviews span a variety of industries,2 and are representative of all levels in the industrial 2 Interviews were conducted at the following industrial marketing companies: AET Films, AlliedSignal, Applied Micro Circuits Corporation, Avery Dennison, ConAgra, Continental Tire, Cooper Tire, Corning, Cummins Filtration,
  • 13. DuPont, Eastman Chemical, Exxon-Mobil, Federal Express, John Deere, Lucent Technologies, Maxtor, Michelin, Motorola, Orbit, Peerless Pump, ProSource, Smith & Nephew, Sysco, and Union Pacific Railroad. marketing supply chain: raw material suppliers, manufacturers, and distributors. At these companies, over 1000 individuals from across multiple functional areas were interviewed, including sales people, sales managers, and sales executives. The roles these individuals play in the forecasting process were explored in depth, as were issues surrounding forecasting systems utilized, performance measurement, customer participation in sales forecasting, feedback, training, and how sales forecasts are used in the firm. The following findings from the interviews and literature suggest that the presence of certain situational variables increases industrial sales force motivation in the sales forecasting process. 2.1.1. Situational variables Bagozzi (1978, November) describes situational variables as “a bundle of physical characteristics that are in some way coercive, facilitative, or constraining on the individual or his or her perfor- mance, or some other physical events related to the individual” (1978,
  • 14. p. 521). We adapt Bagozzi's term situational variables in this study to indicate the environmental signals that coerce, facilitate, constrain or motivate industrial sales force forecasting. Environmental signals are comprised of managerial and financial resources provided by the organization to assist the industrial sales force forecasting process. Following is a discussion of nine environmental signals (see Fig. 1) that emerged from the interview data and literature review as impacting industrial sales force motivation in the sales forecasting process. The discussion for each variable begins with presentation of the depth interview findings followed by a review of the relevant literature in industrial sales force motivation and sales force forecasting. 2.1.1.1. Compensation and performance evaluation. One theme that persistently emerged from interviews within every company was related to perceptions of the impact of compensation and perfor- mance evaluation in motivating sales force forecasting. Consistently, individuals from sales expressed frustration that they were asked to spend considerable time and energy forecasting, although their efforts were neither measured nor rewarded for this activity. The impact of the absence of forecasting compensation and performance evaluation was manifest in the salespeople's resistance towards forecasting responsibilities, which were perceived as an
  • 15. unnecessary complexity beyond the scope of their sales function. Furthermore, individuals within the firm who are downstream users of the forecasts developed by the sales organization frequently expressed a lack of confidence in the forecasts, often because they perceived a lack of accountability. Research has shown that salespeople often resent having to perform their forecasting responsibilities because they consider sales forecasting as ancillary to and incompatible with their primary function, which they 130 T.M. McCarthy Byrne et al. / Industrial Marketing Management 40 (2011) 128–138 believe is to sell (Harris, and Pike, 1996; Mentzer, and Moon, 2005). In an environment in which the role of the sales force is characterized as increasingly complex (Jones, Brown, Zoltners, and Weitz, 2005), inclusion of forecasting responsibilities to the role expectations of salespeople can result in feelings of role incongruity and incompatibility (Behrman, and Perreault, 1984, p. 12). Incongruity and incompatibility of expectations often stem from a failure of incentive structures such as compensation and performance evaluation to encompass and
  • 16. thereby motivate the expected performance (Brown, Evans, Mantrala, and Challagalla, 2005). In these situations, the importance of the salesperson in the forecasting process and the resultant organizational performance implications must be made evident to mitigate feelings of role incongruity. Thus, developing compensation schemes and performance evaluations incorporating incentives for forecast accuracy is one approach to underscoring the importance of sales force forecasting accountability (Mantrala, and Raman, 1990). Based on the interview data and literature review, compensation for and performance evaluation of forecasting responsibilities are environmental signals that motivate industrial sales force forecasting. 2.1.1.2. Use of environmental conditions. Interview informants per- ceived importance in having access to information related to internal and external environmental factors that impact demand. Information regarding endogenous factors that were noted as important included the timing of new product introductions, and changes in organiza- tional marketing expenditures and pricing policies. Among the exogenous conditions identified by informants were industry trends, competitive trends, and economic forecasts. The perceived impor- tance of access to environmental conditions was emphatically
  • 17. expressed by the interview informants, particularly when the information salespeople desired was neither accurate nor timely. One forecast analyst described the reaction of salespeople when asked to submit a 12 month forecast without sufficient information; “They hate it…. It's like pulling teeth.… They aren't given enough information regarding pricing and new products to create an accurate 12 month forecast.” As described by one salesperson recognizing the inadequacy of the information supplied, “the forecast becomes a joke.” In situations where salespeople were not given accurate and timely information, they clearly expressed dissatisfaction with the process, took the process less seriously, and spent less time and effort developing their forecasts. Research indicates that a determinant of salesperson performance relates to the level and quality of information and knowledge needed to perform the role adequately (Agarwal, 1999, Brown, and Peterson, 1993, February; Churchill, Ford, Hartley, and Walker, 1985, May; Johlke, Duhan, Howell, and Wilkes, 2000). The sales literature (Baldauf, and Cravens, 2002; Matsuo, and Kusumi, 2002) supports the concept advanced by the knowledge-based view of the firm suggesting that “knowledge is the critical characteristic which enables salespeople to cope effectively with their dynamic, competitive environments” (Rapp, Ahearne, Mathieu, and Schillewaert,
  • 18. 2006, p. 281). Knowledge of endogenous and exogenous environmental conditions are resources that can be used by salespeople to inform the forecasting process (Moon, and Mentzer, 1999). 2.1.1.3. Use of judgmental input. Most salespeople in the interviews recognized the value they could add to the forecast stemming from information collected during formal and informal conversations with customers. Examples of judgmental information that informants used as input to the forecast include perceived probability of opening new or closing existing accounts, conversations with customers about orders placed with competitors due to the focal firm's inability to meet the customer's demand, changes in the customers' selling efforts, changes in competitors' marketing activity, and probabilities of securing large orders. Several studies have recognized the importance to the forecasting process of the salespersons' subjective or judgmental input stemming from conversations with customers and exposure to other external environments (Dalrymple, 1987; McCarthy, and Golicic, 2002; Mentzer, and Kahn, 1995b; Sanders, and Ritzman, 2004). The exposure salespeople have to customers and other externalities often results in aggregation of a tacit and disperse knowledge base that can be used as a valuable source of input to the forecast,
  • 19. such as those identified above during the interviews. This type of tacit information has been shown to add value to the forecast under certain conditions, particularly in changing environments and when little historical data exist (Webby, and O'Connor, 1996). Although salesperson judgment was noted as critical to effective sales forecasting in both the interviews and literature, a key issue with judgmental input that emerged from the interviews was the “game- playing” that often takes place when salespeople contribute to judgment based forecasts. The interviews identified two categories of game-playing in which salespeople often engage. First, if salespeo- ple perceive that their judgment-based forecasts will affect their quotas or targets, they will underestimate future demand so that those targets are more easily reached. Second, if salespeople perceive that product shortages are likely, they will overestimate future demand so that when allocations are made, their customers will receive the actual quantity desired. In either case, the credibility of the judgmental input developed by the sales force is compromised by such game-playing. Therefore, although the literature suggests that the use of judgmental input is an environmental signal motivating sales force forecasting, the interview results were equivocal. 2.1.1.4. Forecasting training. Another situational variable that
  • 20. emerged from the interviews is related to forecasting training, or more precisely, the lack thereof. In most companies, both salespeople and downstream users of the forecast expressed frustration with the absence of forecasting training for salespeople, which they believed would improve sales forecasting efforts. Very few of the 24 companies provided any formal sales forecasting training for their salespeople. In most cases, forecasting was an afterthought, and any training that did take place was to informally show salespeople how to input their numbers. In fact, in many of the companies participating in the interviews, salespeople were unaware of what happened to their forecasts after they were submitted. Thus, not only are salespeople frequently not trained on how to forecast, they are frequently not trained on why they forecast. Ingram, LaForge, Avila, Schwepker, and Williams (2001) discuss the importance of sales force training to achieve role clarification; that is, a clear understanding of what tasks are to be performed, how they are to be performed, and how such efforts lead to improved outcomes. Jantan, Honeycutt, Thellen and Ashraf (2004) suggest that a strong commitment to sales training improves role perceptions and salesperson performance. Ramlall (2004) asserts that organizations
  • 21. cannot afford to passively assume that sources of knowledge are being accessed and utilized throughout an organization, such as the use of judgmental information obtained by salespeople during conversa- tions with customers. Sales managers that train the sales force in application of the various sources of knowledge in the sales forecasting process work toward reducing role ambiguity. Training in knowledge management practices, including coaching, mentoring, and workshops for knowledge sharing, is considered essential for a company to translate tacit knowledge into more objective and codified explicit knowledge (Demers, 2003; Nonaka, and Takeuchi, 1995). For example, McCarthy, and Golicic (2002) found that judgmental input improved sales forecast accuracy when firms actively commit resources to train salespeople in intelligence gathering and forecasting. Therefore, we include forecasting training as an environmental signal that motivates industrial sales force forecasting. 131T.M. McCarthy Byrne et al. / Industrial Marketing Management 40 (2011) 128–138 2.1.1.5. Feedback on forecasting performance. Another environmental signal that was evidenced as a pain point due to its absence is feedback from managers on forecasting performance. Very few of the companies
  • 22. provided individual salespeople with concrete forecasting performance data, although many informants indicated that they desired the information and expressed frustration with the absence of feedback. Among the companies that did measure and communicate forecast accuracy, salespeople were readily able to recall their level of accuracy and often discussed targeted improvement goals. In many cases, lack of feedback resulted from lack of systems capability to measure forecast accuracy at the individual salesperson level. The interviews revealed that if individual measurement took place, it often required manipula- tion of data outside the formal forecasting system, and it was the rare company that went to this length to provide such feedback. Locke, and Latham (1990) identify managerial feedback as an important motivator of performance. Clear and frank supervisory feedback provides clarification of performance expectations leading to increased job satisfaction, effort, and performance (Brown, and Peterson, 1993, February; Chakrabarty, Oubre, and Brown, 2008, Humphreys, and Einstein, 2004, Teas, and Horrell, 1981, February). A formal process providing salespeople with feedback about sales forecast accuracy or the reasons for inaccuracy is a tool that can be used by salespeople to adjust their performance, and by
  • 23. management to emphasize accountability for forecast accuracy performance. 2.1.1.6. Knowledge of how the forecast is used throughout the organization. In some companies involved in the interviews, processes were established to ensure that salespeople understood the impact of their forecasting efforts on corporate performance. These companies discussed having regularly scheduled sales and operations planning (S&OP) meetings attended by salespeople, resulting in a consensus understanding of the forecast and how it was used to inform resource allocation decisions throughout the company. In other companies, the interview data revealed a common lack of understanding among the salespeople concerning the impact of their forecast on the supply chain. In these companies we observed a cultural disconnect between the demand and supply sides of the enterprise, and salespeople showed little understanding of the effects their forecasts had on production planning, procurement, logistics planning, and other aspects of supply chain management. In one example, salespeople were no longer invited to attend S&OP meetings because their input was “disruptive.” As a result, one salesperson commented, “I don't care what happens after I send my forecast to [the forecast analyst],” resulting in the prevalent attitude characterized as “it's our job
  • 24. to sell, and their job to supply.” These interview results indicate that a lack of understanding regarding how the salespeople's forecasts are used throughout the company results in a lack of motivation in the forecasting process. In his research on motivation in the workplace, Pinder (1997) asserts that overall effectiveness of employees is significantly related to the perceived importance of performing a task. Specifically, employees who believe that their contribution in performing a task impacts the entire organization will be motivated to perform the task more effectively. Salespeople's perceptions of the importance of the forecast explain the dichotomy in levels of engagement with the forecasting process between those who understand the impact of their forecasting efforts on corporate performance and those who do not. Therefore, managers are enjoined to educate salespeople about the use of their forecast within the company and the impact of the forecast throughout the organization. 2.1.1.7. Access to a forecasting computer program. Thus far, the interview data have identified multiple sources of information that can be used to reduce role conflict and ambiguity and, correspond- ingly, to motivate salespeople to add value to the forecasting process. However, it became clear in the interviews that without the
  • 25. proper tools and technology, effectively organizing, storing, retrieving, and analyzing the abundant sources of data can become a daunting task, resulting in underutilization of the data. Among the participating organizations, a wide variety of tools were provided (or not provided) to salespeople to support their forecasting efforts. At one company, salespeople were given access to the formal forecasting system, presented with the system-generated statistical forecast for their “A” level customers and their “A” level products, and provided with a space to enter their adjustments to the system-generated forecast as well as a space to note their reasons for making adjustments. At this company, the tools greatly supported the process. More commonly, many companies reported reliance on spreadsheets to create and share forecasts for which a common procedure and data source were not utilized. The abundance of personal spreadsheet forecasts was characterized by one firm as “spreadsheet mania.” At other compa- nies, salespeople were simply asked to send an e-mail to the forecasting department if they knew of anything occurring that might affect future demand. Clearly, at these companies, system tools were not provided to enhance the salespeople's forecasting perfor- mance. One salesperson who had experience with both
  • 26. spreadsheet forecasting and computer programs described her efforts with the computer program as more “substantive” and “rewarding” than the effort associated with the manual data input necessary with spreadsheet forecasting. Brown et al. (2005) suggest that technology facilitates the storage, organization, and flow of information, thereby improving the quality of communications within and across firms. Forecasting computer programs provide a common procedure and data source for forecasting, and reduce the need for manual data input and potential for error associated with personal spreadsheet forecasts. Thus, organizations providing salespeople access to forecasting computer programs can help them manage and optimize use of the abundant information available in the forecasting process. 2.1.1.8. Level of others' seriousness placed in the salesperson's forecast. Insights from the interview database were at times discouraging concerning the level of seriousness placed upon the salesperson's forecasts by others in the organization. Frequently, substantial disconnects were observed between the users of salesperson- generated forecasts and the sales organization. As described previ- ously, forecast users often perceive that significant “game- playing” is taking place, rendering the forecasts generated by salespeople
  • 27. less than useful. In some firms, forecast users perceive that salespeople are “sandbagging,” or understating the potential demand in anticipation that these understated forecasts will result in lower sales quotas. In other firms, users perceive salespeople to be unrealistically optimistic. In yet others, users perceive that salespeople “pad” their forecasts to try to assure adequate product supply. In all these cases, there is a perception by forecast users that salespeople are not accountable for the accuracy of their forecasts and therefore the forecasts are not taken seriously. Other observations emerging from the interviews illustrating a perceived lack of seriousness relate to the “executive override.” Salespeople expressed frustration when the forecasts they developed were altered by the executive team, thereby undermining the salespersons' efforts. As stated by one salesperson, “[Management] flushes all my analytics for 1 h of qualitative judgment.” Executive changes to the forecast were often not communicated back to the salespeople, compounding the perception that their forecasting efforts were not taken seriously. As described by one salesperson, “That loop doesn't get closed.” Managers suggested their incentive for overrides may stem from conflicting objectives, such as
  • 28. pressure to inflate the forecast to achieve favorable earnings projections. In total, these insights from the interviews paint a picture of salespeople not being taken seriously by users of the forecast. The lack of seriousness is often perceived by salespeople, and when they believe their 132 T.M. McCarthy Byrne et al. / Industrial Marketing Management 40 (2011) 128–138 forecasts are not being taken seriously, they feel intense reluctance to spend time working on their forecasting tasks. As one salesperson commented, “they don't believe what I tell them anyway, so why should I bother?” The literature supports the notion that salespeople whose forecasting efforts are not taken seriously will perceive a disconnect with their forecasting responsibilities. When individuals perceive that their work is taken seriously by others, they are more motivated to expend attention and effort toward the task (Nissenbaum, 1998, Stevens, 1996) and take it seriously themselves. A rich body of literature on motivational theories underscores the importance of considering the expectations of significant others in predicting effective task performance (e.g., Hackman, and Oldham, 1980; Mitchell, and Nebeker, 1973; Ramlall, 2004). Thus, in order to motivate sales force behavior in the forecasting process, the sales
  • 29. force's role in developing the forecast needs to be taken seriously by others in the organization. In sum, analysis of the interview data as supported by previous research on sales forecasting and sales force motivation suggests several environmental signals that managers can utilize as resources to motivate sales force forecasting: compensation and performance evaluations tied to forecasting performance; ability to use environ- mental conditions and judgment; forecasting training; feedback on forecasting performance; knowledge of how the forecast is used throughout the organization; access to a forecasting computer program; and the level of seriousness others in the organization place in the salesperson's forecast. These environmental signals represent resources and direction provided by the organization to assist and motivate the industrial sales force sales forecasting process. In the following section, we further explore the literature on sales force motivation to describe the motivational dimensions that are impacted by the environmental signals present for the sales force. 2.1.2. Motivational dimensions Motivational research in the sales literature generally deals with efforts to increase sales force performance and productivity toward organizational goals (Brown et al., 2005). Ramlall (2004)
  • 30. suggests four motivational theories that are generally applicable to motivating sales people: (1) need theory, (2) equity theory, (3) expectancy theory, and (4) job design (see Ramlall, 2004 for a comprehensive review of each of these theories). Need theory identifies internal factors that stimulate behavior. Equity theory is concerned with the level of reward received for behavior as well as the level of reward relative to what others receive. Expectancy theory focuses on anticipatory end states or goals, thereby modeling motivation as a function of the expectation that certain performance will result from a given action. Job design theory suggests that the combination of tasks comprising a job impacts employee motivation to perform. 2.1.2.1. Satisfaction with the forecasting process. In Ramlall (2004) summary of the core dimensions and outcomes of these four theories, one of the dimensions most frequently associated with the theories is satisfaction. For example, expectancy theory posits that salespeople's affective orientation toward their job is related to the level of satisfaction they expect to receive from performing the job (Ramlall, 2004; Vroom, 1964). In discussing need theories, Steers, and Porter (1983, p. 32) suggest, “Managers have the responsibility to create a
  • 31. proper climate in which employees can develop to their fullest potential. Failure to provide such a climate would theoretically… result in lower job satisfaction.” Champagne, and McAfee (1989)) offer several approaches to satisfying employees that include providing praise and economic rewards, clearly explaining job function expectations, encouraging creativity, and providing training. Among the factors that lead to job satisfaction in the job character- istics model of motivation are recognition, responsibility, feedback, knowledge of the results of one's efforts, and learning (Hackman, and Oldham, 1980; Ramlall, 2004). In the context of sales force forecasting, managers enabling the environmental signals identified above create an environment leading to satisfaction with the forecasting process to motivate performance. 2.1.2.2. Forecasting effort. Motivational theories also consistently recognize level of effort as an outcome associated with various job- related situational factors (Igalens, and Roussel, 1999). Need theory, expectancy theory, equity theory, and job characteristics theory each perceives effort as a function of managerial practices that motivate behavior (Ramlall, 2004). For example, Porter, and Lawler (1968) perceive effort as a function of perceived value of a reward (e.g., recognition or compensation), and that employees exhibit
  • 32. higher levels of effort with higher levels of reward. Ultimately, as seen in Fig. 1, motivational theories advance the belief that the right combination of variables impacts a salesperson's level of satisfaction and level of effort. Introducing environmental signals to reduce feelings of incongruity and incompatibility with job expectations, and that provide salespeople with the tools needed to perform the expected role will result in increased satisfaction with the forecasting process, (Behrman, and Perreault, 1984; Brown, and Peterson, 1993, February) and increased effort expended on forecasting responsibilities. 2.1.2.3. Seriousness placed in the forecasting process. In addition to satisfaction and effort as dimensions that are impacted by environ- mental signals motivating sales force forecasting behavior, process models of behavior suggest that seriousness is related to responsive- ness to a task (Schwartz, 1977, Shiarella, 1998 (1998, January). When assessing a task, individuals who perceive higher levels of seriousness are more likely to direct attention toward the task than those perceiving lower levels of seriousness. Describing the job character- istics model of motivation, Pinder (1997) advocates designing work environments to generate experiences that are meaningful and, thus, taken seriously. Meaningfulness results from allowing the
  • 33. salesperson to exercise a certain amount of autonomy, and from understanding how one's actions contribute to the organization (Pinder, 1997). In the context of sales forecasting, salespeople who are allowed to use their own judgment as input into the forecast, and know the impact of their forecasting efforts on the organization, take their responsibilities more seriously. In addition, Hackman, and Oldham (1980, p. 78) suggest “the degree to which a job requires a variety of different activities in carrying out the work, involving the use of a number of different skills and talents of the person” results in job meaningful- ness. Thus, in order to achieve consistent improvements in forecasting performance within companies, the sales force must find meaning- fulness in their forecasting responsibilities and take those responsi- bilities seriously. In summary, the interview data supported by the review of literature on sales forecasting and sales force motivation reveals that having the right combination of environmental signals leads to satisfaction with, effort directed towards, and seriousness placed in the forecasting process. The conceptual framework presented in Fig. 1 reflects the variables and relationships among the variables observed
  • 34. above in the exploration and description stages of theory develop- ment. In the next section, we move to the explanation stage of theory development and empirically test the relationship between each situational variable and the motivational dimensions associated with sales force forecasting. 2.2. Explanation In the third stage of theory development, explicit theory development serves to explain the empirical generalizations observed repeatedly in the earlier stages of the research. We therefore empirically test the relationships between the environmental signals 133T.M. McCarthy Byrne et al. / Industrial Marketing Management 40 (2011) 128–138 and the motivational dimensions of satisfaction, seriousness, and effort (see Fig. 1). The environmental signals identified in the interview data and the literature that were measured and tested include: (1) compensation based on forecasting performance, (2) performance evaluation based on forecasting performance, (3) access to environmental conditions provided by the company, (4) sales- person's use of their own judgment as input into the forecast, (5) forecasting training, (6) feedback on forecast accuracy, (7) knowledge of how the forecast impacts the organization, (8) access to forecasting
  • 35. computer programs, and (9) others' level of seriousness. 2.2.1. Methodology To test the relationships between the environmental signals and the motivational dimensions, a survey of salespeople was conducted across a variety of industries and sales settings, as recommended by Schendel, and Hofer (1979). The sample of 1024 was taken from a commercially purchased mailing list of salespeople who indicated their involvement in selling products and/or services to companies (in other words, industrial marketing, not retail sales or sales to individuals). From this mailing, 382 returned a postcard indicating that they were appropriate respondents and willing to complete the survey. The survey was mailed to these individuals and 262 completed surveys were returned from business-to-business sales- people (68.6% response rate). The survey was designed to capture data that would allow us to test for patterns in relationships between variables identified in the exploratory and descriptive stages of research that motivate sales force participation in the forecasting process, leading to a prescriptive theory of industrial sales force sales forecasting. As such, the survey was developed to collect information regarding the salesperson's role in sales forecasting, the level of satisfaction, effort, and seriousness placed on the forecasting
  • 36. process, and the presence of environmental signals that motivate sales force forecasting. In addition, demographic data were collected to further explore possible patterns among variables. The items and frequen- cies used to measure the variables are presented in Appendix A. 3. Data analysis and results Results indicate that, among the 262 respondents, 18.3 percent (n=48) do not have any forecasting responsibilities. The remaining results reported in this paper pertain only to those 214 respondents who are engaged in the forecasting process. The respondents' characteristics indicated that they were well qualified to address the issues under consideration. In addition to indicating that they were responsible for forecasting in their territory, the average respondent had “10 to 15 years” in sales. They also worked in a variety of industries, including manufacturing (55.3%), service providers (22.2%), wholesaling (14.0%), publishing (3.7%), health care (2.8%), and financial institutions (2.0%). Table 1 Survey results. Variable Variable name Seriousness R2=.598,α=.000 β t-stat
  • 37. V1 Compensation .025 .2 V2 Performance evaluation .147 1.5 V3 Use of environmental conditions .153 1.7 V4 Use of judgment −.228 −1.8 V5 Training .301 2.4 V6 Feedback −.131 −1.4 V7 Knowledge .286 5.8 V8 Forecasting computer program −.023 −.2 V9 Others' level of seriousness .488 9.7 a=significant at pb.05. b=significant at p≤ .001. The explanatory power of the relationships between the environ- mental signals and motivational variables (Fig. 1) is investigated by the following multiple regression equations: Equation 1: Y1 = β0 + β1V1 + β2V2 + … + β9V9 + E1 Equation 2: Y2 = β0 + β1V1 + β2V2 + … + β9V9 + E2 Equation 3: Y3 = β0 + β1V1 + β2V2 + … + β9V9 + E3 where Y1, Y2, and Y3 denote the dependent variables, seriousness placed in the forecasting process (Seriousness), satisfaction with forecasting process (Satisfaction), and forecasting effort (Effort), respectively; β0 represents the intercept terms; β1, β2, … β9 denote the regression coefficients; V1, V2, … V9 denote the predictor variables described in the Appendix; and E1, E2, and E3 denote the error terms associated with each equation. Although R2 can be inflated with an increased quantity of independent variables, the
  • 38. number of variables in the model falls within the accepted rule of thumb (i.e., no more than one independent for each 10 cases in the sample) (SAS Institute Inc. 2002). Results from collinearity diagnos- tics indicate model fit is not affected by multicollinearity. Tolerance statistics range from .683 to .955, all above the .20 threshold (Hair, Black, Babin, Anderson & Tatham, 2005); VIF ranges from 1.05 to 1.46 — within acceptable criteria; and proportion of variation parameters reveals none of the variables contribute strongly (0.5 or above) with two or more variables (Belsley, Kuh & Welsch, 1980). As shown in Table 1, in each equation the dependent variable is well fitted by the set of independent variables as reflected by the significant R2 coefficients of determination. The set of independent variables explains the largest percent of variability in the dependent variable Seriousness (R2=.598), followed by Effort (R2=.198) and Satisfaction (R2=.155) (see1). Among the environmental signals in the model predicting Serious- ness, the coefficients for training (β=.301,α=.030), knowledge of how the forecast is used (β=.286,α=.000), and others' level of seriousness (β=.488,α=.000), were positive and significant (see Table 1). Results indicated Satisfaction with the forecasting process is
  • 39. associated with higher levels of training (β= .949,α=.021) and feedback (β=.844,α=.001). Three environmental signals were sig- nificantly associated with level of Effort. Knowledge of how the forecast is used (β=.366,α=.049) and access to forecasting computer program (β=1.382,α=.003) had positive significant relationships, and feed- back revealed a negative relationship (β=−.877,α=.013). We also tested for interaction between variables. It is intuitive that receiving forecasting training may have an interaction with other variables, specifically, using a forecasting computer program and knowledge of how the forecast is used. When added to the regression equations, the interaction variables were not significant. Satisfaction R2=.155,α=.000 Effort R2=.198,α=.001 istic β t-statistic β t-statistic 27 .005 .019 −.478 −1.122 32 −.234 −.986 .625 1.670 59 −.368 −1.706 .612 1.789 33 .066 .214 −.284 −.582 66a .949 3.145a .429 .897 59 .844 3.767b −.877 −2.498a 11b .107 .880 .366 2.008a
  • 40. 01 −.212 −.739 1.382 3.035a 43b −.123 .984 .018 .090 134 T.M. McCarthy Byrne et al. / Industrial Marketing Management 40 (2011) 128–138 4. Discussion 4.1. Seriousness in the forecasting process Results from the multiple regression analysis indicate that the environmental signals account for 59.8% of the variability in the level of seriousness placed in the forecasting process, with three variables – training, feedback, and knowledge of how the forecast is used – demonstrating a significant relationship. Survey results were consis- tent with the findings from the interview data indicating managers striving to create a serious forecasting environment train their salespeople in forecasting processes and techniques. The interview data suggest that very few companies provide training, and survey results were consistent, with only 14% of respondents receiving forecasting training from their companies. Managers that dedicate resources for forecasting training establish a commitment to the process and inculcate performance expectations among salespeople. Multiple regression results also revealed that salespeople take forecasting responsibilities more seriously when they are knowledge-
  • 41. able about how their forecast is used to inform other decisions throughout the company. Results indicate a wide range of knowledge among respondents regarding how their forecasts are used, with 52% indicating they have “a good deal of knowledge” to “a great deal of knowledge” about what is done with their forecasts after they are submitted. As evidenced in the interview data, formally involving salespeople in sales and operations planning (S&OP) meetings is a practice that has been successfully used to expose salespeople to the various resource allocation decisions for which their forecasts are used, thereby elevating the perceived importance of the task and reducing role ambiguity. The finding that salespeople are more likely to take their forecasting responsibilities seriously when others in the organization also regard those forecasting efforts seriously confirmed patterns observed in the interview data. During the interviews, salespeople identified two groups of people they often perceived were not taking their forecasts seriously — management and downstream users of the forecast such as production and purchasing. Management's unilateral changes to forecasts developed by the sales force undermined the salespersons' efforts and discouraged them from taking the
  • 42. process seriously. Downstream users of the forecast often believed that salespeople developed forecasts that were intentionally high or low in an effort to achieve some other objective – such as assuring adequate product availability or exceeding quota – and thus adjusted the forecasts to align with their beliefs. To create a climate in which salespeople perceive others are taking their forecasting efforts seriously, managers can align sales forecasting processes to mitigate lack of seriousness in the forecast by users and managers by establishing an S&OP process in which a shared interpretation and consensus agreement on the forecast is established. 4.2. Satisfaction with the forecasting process Quantitative results indicate that the environmental signals explain 15.5% of the variability in salespersons' satisfaction with the forecasting process, with two variables – training and feedback – showing a significant relationship. Salespeople who receive forecast- ing training are significantly more likely to be satisfied with the forecasting process. Training provides direction for the salesperson's forecasting input and thus reduces role ambiguity, thereby increasing satisfaction with the process. Training was the only variable significantly related to both Satisfaction and Seriousness and, as such, is an important factor motivating sales force forecasting. The complexity of processes, techniques, and technology can render
  • 43. forecasting a daunting challenge for those not trained adequately. Salespeople receiving training are more able to identify valuable sources of demand information and use the forecast as a tool with which to disseminate the information. In addition, salespeople receiving feedback on the accuracy of their forecasts were found to be more satisfied with the process. Without feedback on forecast accuracy, salespeople are unaware if their efforts are worthwhile or if they need to be improved. Salespeople in the interviews expressing frustration with absence of feedback perceived their forecasting efforts to be “busy work” that added little value and detracted from their selling responsibilities. Conversely, one of the managers in the interviews that provided feedback used forecast accuracy as a tool to motivate salespeople by relating accuracy to customer service levels. Performance feedback can provide a sense of justification for the salesperson's efforts in the forecasting process, thus reducing role ambiguity and increasing satisfaction. 4.3. Forecasting effort Results from the multiple regression analysis indicate that the environmental signals account for 19.8% of variability in the level of
  • 44. seriousness placed in the forecasting process, with three variables – feedback, knowledge of how the forecast is used, and forecasting computer program – demonstrating a significant relationship. The negative relationship between receiving adequate feedback and forecasting effort is counterintuitive. It is possible that the same level of feedback may be perceived as adequate by salespeople spending the most time on the forecast but inadequate by those spending a lesser amount of effort on the forecast. For example, if those spending less time on the forecast experience lower levels of forecast accuracy than those spending more time, they may perceive the need for more feedback and instruction on what can be done to improve their performance. Based on the positive relationship between feedback and satisfaction and the negative relationship between feedback and effort, it is important for managers to establish a mechanism to determine if the salesperson perceives the level of feedback adequate. Salespeople who are knowledgeable about how their forecasts are used throughout the company spend significantly more time forecasting than those who are less knowledgeable. These regression analysis results support the qualitative data suggesting that when employees believe their efforts have a direct impact on the company's performance, they are more motivated to allocate time and
  • 45. effort to the task. As discussed in the literature review, motivational theories suggest that employee's efforts toward a task are conditioned by the ability to achieve desirable goals through those efforts (Ramlall, 2004). Managers who create an environment in which salespeople understand the impact of their forecasting efforts on the company – for example encouraging involvement in S&OP meetings – create an expectation of attainment of goals such as improved organizational performance resulting in increased financial rewards. Furthermore, personal achievements such as improved self esteem can result from the knowledge that the salesperson's forecasting efforts are a critical aspect impacting the performance of several processes throughout the organization. The third environmental signal to exhibit a significant relationship with forecasting effort was access to a forecasting computer program. The fact that salespeople who have access to a forecasting computer program spend more time and effort developing their forecasts than those without a computer program may seem counterintuitive because the system should allow them to work more efficiently. However, the system provides immediate access to abundant
  • 46. information that the salesperson might not be able to consider using a simple forecasting spreadsheet. In addition, as salespeople acquire new demand information from external sources, they may be more likely to utilize the computer system to analyze the impact on demand as they acquire the information rather than waiting to communicate the information until the next period in which a 135T.M. McCarthy Byrne et al. / Industrial Marketing Management 40 (2011) 128–138 forecast update is due. As described in the qualitative research, the salespersons' time and efforts are more substantive and rewarding when making forecasting decisions with the computer program. The significant finding between the environmental signal forecasting computer program and the motivational dimension Effort illustrates that motivational theories can be applied in a sales forecasting context, suggesting that work effort is motivated by the perceived value of the reward. To summarize, among the 9 environmental signals in the model, 5 significantly impact the motivational dimensions of sales force forecasting: training, feedback, knowledge of how the forecast is used, forecasting computer program, and others' level of seriousness. Three of the environmental signals demonstrated significant
  • 47. relation- ships with two of the motivational dimensions: Training had a significant positive relationship with seriousness and satisfaction; feedback was positively associated with satisfaction but negatively associated with effort; and knowledge of how the forecast is used was positively related to seriousness and effort. 5. Managerial implications Successfully managing the sales forecasting process involves much more than deciding what techniques and computer system to adopt within an organization. This research provides a model for managers interested in motivating the industrial sales force in their sales forecasting efforts. Recognition of the important role of the sales force in improving the quality of sales forecasts can provide a source of competitive advantage for firms that rely on the forecast to inform other organizational processes such as purchasing, manufacturing, warehousing, capacity planning, and logistics scheduling, to name a few. The survey research revealed five environmental signals that motivate sales force forecasting. Managers investing in these resources can alter the prevailing attitude among salespeople that forecasting is a non-value added activity which constrains the time
  • 48. they can devote to selling. 5.1. Forecasting training Providing forecasting training for the sales force increases both satisfaction with and seriousness placed on the process. Forecasting training provides structure and direction for the sales force to identify sources of information that impact demand and how that information is most effectively used as an input to the forecast. Training programs can be designed to include those aspects of forecasting that are most relevant to the sales force, such as identifying, gathering, and interpreting qualitative intelligence from customers and other external sources that can impact demand. Salespeople can also be trained to understand how the qualitative customer data can complement a statistically generated forecast. Moon, and Mentzer (1999) found that salespeople's forecasting efforts are most effective when they are asked to alter a statistical forecast rather than create a new forecast. However, to be most effective, salespeople should be trained with a basic understanding of the variables that have been considered in the statistical forecast so any changes they make are adding value rather than duplicating the impact of variables already included.
  • 49. 5.2. Knowledge of how the forecast is used throughout the organization Educating the sales force on how their forecasting efforts are used throughout the firm increases seriousness placed in and effort devoted to the process. Managers can establish this environmental signal by involving the sales people in cross-functional meetings such as S&OP to illustrate the systemic effect of their forecast on other organizational process decisions. S&OP is the process by which an organization develops a consensus understanding of demand result- ing in a single-number forecast that drives the operational plans to match supply and demand. Managers are encouraged to involve salespeople in the S&OP process to demonstrate how their sales force forecasting efforts directly impact production and order fulfillment rates. Salespeople who understand that the quality of their forecasting efforts ultimately impacts their order fulfillment and customer service levels will take the process more seriously and devote more effort to producing quality forecasts. 5.3. Feedback on forecasting performance Providing forecasting feedback increases satisfaction with the process. Without regular reports of forecast accuracy, salespeople
  • 50. have little incentive to strive for improved accuracy. Forecasting management systems have been developed that track the accuracy of forecasting input for each individual that contributes to the forecast. Managers can utilize these system tools to monitor and provide feedback on the accuracy of forecasting efforts among the sales force. Existing forecast accuracy performance can also be used as a benchmark for setting goals for improvement for each salesperson. The negative relationship found between feedback and forecasting effort indicates that managers must gauge the appropriate amount and content of the feedback based on the salespersons' needs and level of forecast accuracy. If those spending less time on the forecast experience lower levels of accuracy than those spending more time, they may perceive the need for more feedback. Forecasting manage- ment systems can allow managers to customize automated accuracy reports at varying levels and varying frequencies based on the feedback needs of the individual salesperson, and eliminate the burdensome responsibility associated with manual manipulation of the numbers. 5.4. Access to a forecasting computer program Fourth, managers are also encouraged to make the investment in
  • 51. a forecasting computer program that can assist the sales force in effectively organizing, analyzing, and communicating information that can impact demand. Providing forecasting software tools that are interfaced with the company's central database enables salespeople to complete their forecasting responsibilities efficiently. For example, forecasting software packages eliminate the need for manual input of historical data thereby reducing potential for error, and improve the ability for salespeople to view and analyze multiple dimensions of the forecast, such as by product category, customer, channel, time horizon, or geographic region, to name a few. As described in the interview, the forecasting efforts become more “substantive” and “rewarding” with a computer program as more effort is dedicated to understanding the customer and the business rather than trying to determine how to manage complex sets of data. However, sales managers are cautioned against assuming a forecasting software package is a panacea for all forecasting problems. The technology becomes useful when it is used as a tool to enhance an existing forecasting process (Mentzer, and Moon, 2005). 5.5. Level of others' seriousness placed in the salesperson's forecast Finally, if managers want their salespeople to take the
  • 52. forecasting process more seriously, it is important to ensure that others in the organization also regard the salespeople's forecasting efforts serious- ly. Once again, the S&OP meeting is a forum in which the content and quality of the sales force's forecasts can be shared with a cross- functional group to increase awareness of and seriousness placed in the forecast. Sales force involvement in S&OP may reduce the incidence of game-playing and thus reduce the skepticism with which many users of the forecast view the salespersons' efforts, and thereby increase the level of seriousness conferred upon the forecast. 136 T.M. McCarthy Byrne et al. / Industrial Marketing Management 40 (2011) 128–138 In addition, communicating the rationale behind “executive over- rides” that alter a salesperson's forecast will “close the loop” and reduce the perception that the salesperson's forecasting efforts are not taken seriously. To our knowledge, this is the first study to identify variables that specifically motivate sales force behavior related to sales forecasting. The large majority of research on sales force forecasting has focused on the salesperson's use of a specific technique or practice
  • 53. rather than an overall assessment of how managers can motivate the industrial sales force to improve their forecasting efforts. The lack of research related to sales forecasting motivation may explain why, in spite of the significant findings from our quantitative study, many companies are not employing these environmental signals in practice. An implication is that, although not addressed in this study, training sales managers in state-of-the-art forecasting and coaching techni- ques may be necessary before implementation of the five environ- mental signals can be effective. Ultimately, our research suggests that organizations that devote managerial and financial resources to provide the environmental signals identified in this study foster an atmosphere in which salespeople are more satisfied with and spend more effort on the forecasting process and take the process more seriously. 6. Theoretical implications Our paper developed a theory of industrial sales force forecasting. The theory suggests that salespeople are more motivated to perform their forecasting responsibilities when the necessary environmental signals are provided. Given that studies over the last thirty
  • 54. years have shown no real improvement in sales forecasting accuracy (McCarthy et al., 2006), and given the fact that a preponderance of sales forecasting research during that time period has concentrated on improved techniques and systems, perhaps less research attention should be paid to the techniques and systems of sales forecasting, and more to the management of the function. This is the major theoretical implication of this study. Industrial salespeople have considerable insight to provide to the sales forecasting process, if their input is properly managed, rewarded, and supported. This fact deserves considerable future theory development and testing. The finding that compensation and performance evaluation were not significantly related to the motivational dimensions of industrial sales force forecasting was surprising given the frequency with which they were mentioned in the interviews. In addition, abundant research on sales force productivity focuses on how judicious design of compensation plans align salespeople's goals with organizational objectives and, thus, motivate behavior to achieve desired outcomes (Brown et al., 2005). However, an explanation for the lack of significance for compensation as a motivator of forecasting behavior may be found in some of the other environmental signals that were found to be significant. For example, salespeople who, (a) are
  • 55. properly trained to gather and incorporate customer data into the forecast, (b) receive appropriate levels of feedback in the form of forecast accuracy measures on the effectiveness of their efforts, and (c) understand the impact of their forecasting efforts on resource allocations throughout the organization, may be more likely to understand that the forecasting process can be used as a tool to learn more about and consequently develop a better relationship with their customers, resulting in increased sales. That is, the forecasting process becomes a tool to align supply with demand, increase sales and, in turn, increase commissions and bonuses within existing compensation structures and negates the need for additional motivation in terms of alternative compensation structures specific to forecasting. We found that training, feedback, knowledge of how the forecast is used, forecasting computer program, and others' level of seriousness have considerable impact on salesperson seriousness, satisfaction, and effort in sales forecasting. This suggests further theory development addressing what other factors are antecedent to seriousness, satisfaction, and effort, and what are the forecasting and firm consequences of increasing seriousness, satisfaction, and effort.
  • 56. This theoretical development (through additional qualitative methods) and testing of the resultant theories (through quantitative methods) should provide practitioners with additional insights on how to manage the industrial marketing salesperson input to sales forecast- ing, and what benefits these improvements have for firm and supply chain performance. This, in turn, should lead to a wealth of future research. 7. Directions for future research Our research employed a theory-building approach to identify factors that motivate sales force forecasting. Extant literature on the general topic of sales force motivation was placed in a sales forecasting context through the use of depth interviews, and a survey was developed and administered based on the findings in the literature and interviews. The interviews revealed that many variables believed to motivate behavior are not employed in a forecasting context, and the survey results produced some insignificant findings that have been found significant in other contexts. Specifically, several researchers have found compensation and performance evaluation to be strong motivating factors for salespeople (Brown et al., 2005; Mantrala, and Raman, 1990; Mentzer, and Moon, 2005; Ramlall, 2004), but this research found no significant relationship.
  • 57. Future research should explore in more detail the nature of the compensa- tion and performance evaluation used in the sales force forecasting process to determine if certain approaches are more successful than others in motivating forecasting behavior. Findings from our depth interviews revealed that many salespeo- ple are unaware of the level of accuracy of their forecasts. Capturing the impact of environmental signals and motivational dimensions on forecast accuracy is another important approach to understanding and improving sales force forecasting. Structural equation modeling can be used to examine the strength of relationships among the environmental signals, motivational dimensions, and forecast accu- racy performance. Furthermore, a longitudinal study capturing accuracy levels before and after implementation of environmental signals could confirm the direction of the relationships among the variables, revealing important insights for motivational researchers and for managers attempting to motivate sales force forecasting performance. It is also important that future research into sales force forecasting work to more fully understand the impact that enhanced salesperson
  • 58. performance has on important corporate outcomes. Ultimately, there needs to be a clear link between the resources that are expended to improve the quality of salesperson contributions to forecasting performance and enhanced customer service levels, reduced costs, and profitability. Both managers and academics will benefit from empirical insight into the relationship between salesperson forecast- ing performance and these broader corporate performance metrics. Finally, additional work is needed to develop and refine reliable and valid measures of some of the constructs introduced here. The survey instrument developed for this study was designed to be exploratory in nature, and given this objective, each of the nine environmental signals, as well as the three motivational dimensions identified in Fig. 1 are measured using single-item measures. The use of single-item dichotomous variables is a limitation of the current research. More robust, multi-item measures that tap into all dimensions of the constructs can only lead to more precise tests of the relationships explored, and may generate significant relationships between the environmental signals and motivational dimensions that were insignificant in our study. Once this stream of research moves into a theory testing phase, more robust measures of these constructs
  • 59. should be developed. 137T.M. McCarthy Byrne et al. / Industrial Marketing Management 40 (2011) 128–138 Appendix A. Measures Environmental signals Frequencies V1 Compensation: Is any part of your compensation tied in any way to the quality of your forecast? [0=no, 1=yes] No=162, Yes=52 V2 Performance Evaluation: Is your performance evaluation based in any way on the quality of your forecast? [0=no, 1=yes] No=120, Yes=94 V3 Use of Environmental Conditions: Has your company provided you with environmental information (i.e., pricing policies, industry trends, economic forecasts, etc.) to help you do your forecasting? [0=no, 1=yes] No=128, Yes=87 V4 Use of Judgment: Do you use your own judgment to help you forecast? [0=no, 1=yes] No=28, Yes=187 V5 Training: Has your company provided you with forecasting training to help you do your forecasting? [0=no, 1=yes] No=185, Yes=30 V6 Feedback: Do you think you receive adequate feedback on the accuracy of your forecasts? [0=no, 1=yes] No=87, Yes=126 V7 Knowledge: How much knowledge do you have
  • 60. about what is done with your forecasts after you submit them? [response option: (1) no knowledge to (5) a great deal of knowledge] 1=5, 2=22, 3=76, 4=60, 5=51 V8 Forecasting Computer Program: Has your company provided you with specific forecasting computer programs to help you do your forecasting? [0=no, 1=yes] No=181, Yes=34 V9 Others' Level of Seriousness: How seriously are the forecasts that you provide taken by others in your organization? [response option: (1) not at all seriously to (5) extremely seriously] 1=3, 2=17, 3=73, 4=74, 5=41 Motivational dimensions Y1 Seriousness: How seriously do you take your forecasting responsibilities? [response options – (1) not at all seriously to (5) extremely seriously] Range=1 to 5, Mean=3.60, SD = .904 Y2 Satisfaction: Overall, how satisfied are you with the forecasting process that you participate in? [response options – (1) extremely dissatisfied to (5) extremely satisfied] Range=1 to 5, Mean=3.09, SD = .857 Y3 Effort: Approximately how much time do you spend forecasting in an average month [open-ended response option: number of hours per month] Range=0.5 to 100, Mean=5.26, SD=9.44 References Agarwal, S. (1999). Impact of job formalization and
  • 61. administrative controls on attitudes of industrial salespeople. Industrial Marketing Management, 28, 359−368. Bagozzi, R. P. (1978, Novemberr). Sales force performance and satisfaction as a function of individual difference, interpersonal, and situational factors. Journal of Marketing Research, 15, 517−531. Baldauf, A., & Cravens, D. W. (2002). The effect of moderators on the salesperson behavior performance and salesperson outcome performance and sales organiza- tion effectiveness relationships. European Journal of Marketing, 36(11/12), 1367−1388. Barash, M., & Mitchell, D. H. (1998). Account based forecasting at Nabisco Biscuit Company. Journal of Business Forecasting, 17(2), 3−6. Behrman, D. N., & Perreault, W. D. (1984). A role stress model of the performance and satisfaction of industrial salespersons.Journal of Marketing, 48, 9−12 Fall. Belsley, D. A., Kuh, E., & Welsch, R. E. (1980). Regression diagnostics: Identifying influential data and sources of collinearity. New York: John Wiley and Sons. Brown, S. P., Evans, K. R., Mantrala, M. K., & Challagalla, G. (2005). Adapting motivation, control, and compensation research to a new environment. Journal of Personal
  • 62. Selling and Sales Management, 25(2), 155−167. Brown, S. P., & Peterson, R. A. (1993, Februaryy). Antecedents and consequences of salesperson job satisfaction: meta-analysis and assessment of causal effects. Journal of Marketing Research, 30, 63−77. Chakrabarty, S., Oubre, D. T., & Brown, G. (2008). The impact of supervisory adaptive selling and supervisory feedback on salesperson performance. Industrial Marketing Management, 37, 447−454. Champagne, P. J., & McAfee, R. B. (1989). Motivating strategies for performance and productivity: A guide to human resource development. New York: Quorum Books. Churchill, G. A. (1979, Februaryy). A paradigm for developing better measures of marketing construct. Journal of Marketing Research, 16, 64−73. Churchill, G. A., Ford, N. M., Hartley, S. W., & Walker, O. C. (1985, Mayy). The determinants of salesperson performance: a meta-analysis. Journal of Marketing Research, 22, 103−118. Cox, J. E. (1989). Approaches for improving salespersons' forecasts. Industrial Marketing Management, 18, 307−311. Dalrymple, D. J. (1975, Decemberr). Sales forecasting methods and accuracy. Business Horizons, 18, 69−73.
  • 63. Dalrymple, D. J. (1987). Sales forecasting practices. International Journal of Forecasting, 3 (3&4), 379−391. Demers, J. (2003). Networked knowledge. CMA Management, 76(10), 43−46. Fildes, R., & Beard, C. (1992). Forecasting systems for production and inventory control. International Journal of Operations and Production Management, 12(5), 4−27. Hackman, J. R., & Oldham, G. R. (1980). Work redesign. Reading, Massachusetts: Addison Wesley. Hair, J. F., Black, B., Babin, B., Anderson, R. E., & Tatham, R. L. (2005). Multivariate data analysis (6th Edition). Englewood, NJ: Prentice Hall. Harris, K., & Pike, J. (1996). Issues concerning adoption and use of sales force automation in the agricultural input supply sector. Agribusiness, 12(4), 317−326. Humphreys, J. H., & Einstein, W. O. (2004). Leadership and temperament congruence: extending the expectancy model of work motivation. Journal of Leadership and Organizational Studies, 10(4), 58−79. Igalens, J., & Roussel, P. (1999). A study of the relationships between compensation package, work motivation and job satisfaction. Journal of Organizational Behavior, 20 (7), 1003−1025.
  • 64. Ingram, T. N., LaForge, R. W., Avila, R. A., Schwepker, C. H., Jr., & Williams, M. R. (2001). Sales management: Analysis and decision making, 4th ed. Jantan, M. A., Honeycutt, E. D., Thellen, S. T., & Ashraf, M. A. (2004). Managerial perceptions of sales training and performance. Industrial Marketing Management, 33, 667−673. Jones, E., Brown, S. P., Zoltners, A. A., & Weitz, B. A. (2005). The changing environment of selling and sales management. Journal of Personal Selling and Sales Management, 25(2), 105−111. Johlke, M. C., Duhan, D. F., Howell, R. D., & Wilkes, R. W. (2000). An integrated model of sales managers' communication practices. Journal of the Academy of Marketing Science, 28(2), 263−277. Locke, E. A., & Latham, G. P. (1990). In U. Kleinbeck (Ed.), Work motivation: the high performance cycle, in Work Motivation. Hillsdale, NJ: L. Erlbaum. Makridakis, S., & Wheelwright, S. C. (1977, Octoberr). Forecasting: issues & challenges for marketing management: a framework for relating the available techniques to specific situations. Journal of Marketing, 24−38. Mantrala, M. K., & Raman, K. (1990). Analysis of a sales force incentive plan for accurate sales forecasting and performance,. International Journal of
  • 65. Research in Marketing, 7, 189−202. Matsuo, M., & Kusumi, T. (2002). Salesperson's procedural knowledge, experience and performance: an empirical study in Japan. European Journal of Marketing, 36(7/8), 327−330. McCarthy, T. M., & Golicic, S. L. (2002). Implementing collaborative forecasting to improve supply chain performance. International Journal of Physical Distribution and Logistics Management, 32(6), 431−454. McCarthy, T. M., Davis, D. F., Golicic, S. L., & Mentzer, J. T. (2006, Augustt). The evolution of sales forecasting management: a 20-year longitudinal study of forecasting practices. Journal of Forecasting, 25, 303−324. McCracken, G. (1988). The Long Interview. Beverly Hills, CA: Sage Publications, Inc.. Mentzer, J. T., & Kahn, K. B. (1995a). A framework of logistics research. Journal of Business Logistics, 16(1), 231−249. Mentzer, J. T., & Kahn, K. B. (1995b). Forecasting technique familiarity, satisfaction, usage, and application. Journal of Forecasting, 14, 465−476. Mentzer, J. T., & Moon, M. A. (2005). Sales forecasting management: A demand management approach. Thousand Oaks, CA: Sage Publications. Mitchell, T. R., & Nebeker, D. M. (1973). Expectancy theory
  • 66. predictions of academic effort and performance. Journal of Applied Psychology, 57, 61−67. Moon, M. A., & Mentzer, J. T. (1999). Improving sales force forecasting. Journal of Business Forecasting Methods & Systems, 18(No. 2), 7−12. Moon, M.A., Mentzer, J.T., & Thomas, D.E., Jr. (2000). CustomerdemandplanningatLucent Technologies. Industrial Marketing Management, 29, 19−26. Morgan, N. A., Anderson, E. W., & Mittal, V. (2005, Julyy). Understanding firm's customer satisfaction information usage. Journal of Marketing, 69, 131−151. Nissenbaum, H. (1998). A grounded approach to social and ethical concerns about technology and education. Journal of Educational Computing Research, 19(4), 411−432. Nonaka, I., & Takeuchi, H. (1995). The knowledge-creating company. New York: Oxford University Press. Peterson, R. T. (1993). Improving sales force composite: forecasting by using scripts. Journal of Business Forecasting, 12(3), 10−14. Peterson, R. T. (1988). How efficient are salespeople in surveys of buyer intentions. Journal of Business Forecasting, 7(1), 11−12. Pinder, C. C. (1997). Work motivation in organizational behavior. Upper Saddle River, NJ:
  • 67. Prentice-Hall. Porter, L. W., & Lawler, E. E. (1968). Managerial attitudes and performance. Homewood, IL: Richard D. Irwin, Inc. Ramlall, S. (2004). A review of employee motivation theories and their implications for employee retention within organizations. Journal of the Academy of Business, 5(1/2), 52−63. Rapp, A., Ahearne, M., Mathieu, J., & Schillewaert, N. (2006). The impact of knowledge and empowerment on working smart and working hard; the moderating role of experience. International Journal of Research in Marketing, 23, 279−293. 138 T.M. McCarthy Byrne et al. / Industrial Marketing Management 40 (2011) 128–138 Reese, S. (2000). The human aspects of collaborative forecasting. Journal of Business Forecasting, 19(4), 3−9. Reid, R. A. (1985). How to set up a forecasting process. Journal of Business Forecasting, 4 (4), 9−10. Reynolds, P. D. (1971). A primer in theory construction. New York: Macmillan. Riehm, S. R. (2001). The Tao of forecasting with promotional events. Journal of Business
  • 68. Forecasting, 20(1), 21−23. Sanders, N. R., & Ritzman, L. P. (2004). Integrating judgmental and quantitative forecasts: methodologies for pooling marketing and operations information. Journal of Operations and Production Management, 24(5/6), 514−529. SAS Institute Inc., SAS for Windows, Cary, NC., Version 9.1, 2002. Schendel, D. E., & Hofer, C. W. (1979). Strategic management: A new view of business policy and planning.Brown and Company, Boston: Little 1979. Schwartz, S. H. (1977). In L. Berkowitz (Ed.), Normative influences on altruism, in Advances in Experimental Social Psychology. New York: Academic Press. Shiarella, A. H. (January, 1998), Scale of Community Service Attitudes for College Students. Paper presented at the Annual Meeting of the Southwest Educational Research Association, Houston, TX. Academic Press. Småros, J., & Hellström, M. (2004). Using the assortment forecasting method to enable sales force involvement in forecasting. International Journal of Physical Distribution and Logistics Management, 34(1/2), 140−157. Sriram, V., Krapfel, R., & Spekman, R. (1992, Decemberr). Antecedents for buyer-seller collaboration: an analysis from the buyer's perspective. Journal
  • 69. of Business Research, 25, 303−320. Steers, R. M., & Porter, L. W. (1983). Motivation & Work Behavior, Third ed. . New York: McGraw-Hill. Stevens, S. (1996). Serious work: students learning from students. Journal of Composition Theory, 16(2), 313−324. Teas, K. R., & Horrell, J. F. (1981, Februaryy). Salespeople satisfaction and performance feedback. Industrial Marketing Management, 10, 49−57. Webby, R., & O'Connor, M. (1996). Judgmental versus statistical time series forecasting: a review of the literature. International Journal of Forecasting, 12, 91−118. Wotruba, T. R., & Thurlow, M. L. (1976). Sales force participation in quota setting and sales forecasting. Journal of Marketing, 40(2), 11−16. Vroom, V. H. (1964). Work and motivation. New York: Wiley. Teresa M. McCarthy Byrne is an Associate Professor of Marketing at Bryant University. Her current research projects explore the degree to which firms integrate activities with other firms in their supply chain, such as collaborative forecasting, demand management, and demand planning. Her research has been published in The Journal of Forecasting, International Journal of Physical Distribution and Logistics Management,
  • 70. Transportation Journal, Foresight, Journal of Marketing Education, and Journal of Business Forecasting. Prior to earning her Ph.D. from the University of Tennessee, Knoxville, Dr. McCarthy Byrne worked in the retail industry for 14 years in forecasting and inventory planning and control. Mark A. Moon is an Associate Professor of Marketing and Director of the Sales Forecasting Management Forum at the University of Tennessee, Knoxville. Prior to joining the UT faculty in 1993, Dr. Moon earned his Ph.D. from the University of North Carolina at Chapel Hill. He also holds MBA and BA degrees from the University of Michigan in Ann Arbor. He has published in the International Journal of Forecasting, Supply Chain Management Review, Foresight, Journal of Personal Selling and Sales Management, Journal of Business Forecasting, Journal of Marketing Education, Marketing Education Review, Business Horizons, Industrial Marketing Management, Journal of Marketing Theory and Practice, and several international conference proceedings. Dr. Moon is also the author, along with Dr. John T. (Tom) Mentzer of Sales Forecasting Management: A Demand Management Approach. John T. Mentzer (1951-2010) was a Chancellor's Professor and the Harry J. and Vivienne R. Bruce Excellence Chair of Business in the Department of Marketing and Logistics at the University of Tennessee. He published 9 books and more than 200 articles and papers in the Harvard Business Review, Industrial
  • 71. Marketing Management, Journal of Business Logistics, Journal of Marketing, International Journal of Physical Distribution and Logistics Management, Journal of Business Research, Transportation and Logistics Review, Transportation Journal, Journal of the Academy of Marketing Science, Columbia Journal of World Business, Research in Marketing, Business Horizons, and other journals. He was the past president of the Academy of Marketing Science and the Council of Supply Chain Management Professionals (then the Council of Logistics Management). He was the 2004 recipient of the Council of Logistics Management Distinguished Service Award, the 2007 recipient of the International Society of Logistics Armitage Medal, and the 2008 recipient of the Academy of Management Science Distinguished Service Award. Motivating the industrial sales force in the sales forecasting processIntroductionTheory buildingExploration and descriptionSituational variablesCompensation and performance evaluationUse of environmental conditionsUse of judgmental inputForecasting trainingFeedback on forecasting performanceKnowledge of how the forecast is used throughout the organizationAccess to a forecasting computer programLevel of others' seriousness placed in the salesperson's forecastMotivational dimensionsSatisfaction with the forecasting processForecasting effortSeriousness placed in the forecasting processExplanationMethodologyData analysis and resultsDiscussionSeriousness in the forecasting processSatisfaction with the forecasting processForecasting effortManagerial implicationsForecasting trainingKnowledge of how the forecast is used throughout the organizationFeedback on forecasting performanceAccess to a forecasting computer
  • 72. programLevel of others' seriousness placed in the salesperson's forecastTheoretical implicationsDirections for future researchMeasuresReferences Econ 3900 Critical Thinking Through Writing Assignments Project Overview Theme: You are an economic adviser working for the Federal government in Washington D.C. President Obama has asked that you prepare two reports describing the impact of the 2008 Financial Crisis on the U.S. economy, evaluating policies undertaken to mitigate the resulting fall out, and proposing new policies. Report 1 Assignment (CTW 1): 1. A description of the 2008 Financial Crisis and its impact on the US Economy. Please use important economic variables to describe the economy and explain to the President why these variables are important. 2. A description of the U.S. economy from the 2008 Financial Crisis until now. Please include a description of the current state of the U.S. economy.
  • 73. 3. A description of the monetary policies taken by the Federal Reserve Bank 4. A description of fiscal policies taken by the Federal Government Report 2 Assignment (CTW 2): 1. An evaluation of Monetary Policies taken by the Federal Reserve Bank. Use the theories and models we have learned in class to describe the effect of these polices on the economy in both the long-run and the short-run. Evaluate whether these policies were successful in combatting the recession. 2. An evaluation of the Fiscal policies taken by the Federal Government. Use the theories and models we have learned in class to describe the effect of these polices on the economy in both the long and short run. Evaluate whether these policies were successful in combatting the recessions. Include comments on government debt. 3. Despite the previous actions taken by both the Federal Reserve Bank and the Federal Government, the U.S. economy has yet to fully recover. Use
  • 74. the theories and models we have learned in class to propose additional measures the Federal Reserve Bank/Federal Government could take to further stimulate the economy. You are encouraged to include tables and graphs in your reports. Tables and graphs are to be placed at the end of the document. Send Submissions to [email protected] Submission must be in MS-Word (.doc;.docx) format. Save the file as LastName.Firstname.CTW_X Late submissions will be penalized by 10% per day. Submissions Due Dates CTW 1 CTW 2
  • 75. Submission requirements Your answer must be typed, used double spacing, Times New Roman 12 point font. Copying or plagiarism will be subject to the University’s Academic Honesty Policy. All sources must be clearly documented with both an in-text citation and a bibliographic reference. Failure to document sources is a clear violation of the honor code, and will be taken very seriously. If you use an author’s ideas, even if you do not quote them directly, you must cite them. This especially includes any Internet sources. If you are unsure about whether or not to cite something, feel free to email me throughout the process. Admitting that you don’t know something is infinitely better than making a mistake involving plagiarism. Grading of this assignment will be done based on the following: Identifying the issue(s): Clearly identifying the problem(s), question(s) or issue(s). Providing background for the problem(s), question(s) or issue(s). Analytics: Applying economic concepts to the questions. Developing
  • 76. logical arguments. Drawing substantiated conclusions. Drawing connections between economic concepts and real world applications. Communication and Structural Organization: Language clearly and effectively communicates ideas. Assignment is organized with an introduction, body, discussion, conclusion and reference section, if applicable. Grammar, syntax and appropriate style. Submissions should be limited to 10 pages of text. That is, text on the 11 th page will not be grades. There is no minimum page requirement, but you should strive to answer the questions thoroughly. Figures, tables and references do not count in those 10 pages. Please include an introduction and conclusion paragraph for each report. mailto:[email protected] Sources of U.S. Economic Data Bureau of Economic Analysis – www.bea.gov
  • 77. Bureau of Labor Statistics – www.bls.gov US Census Bureau – www.census.gov US Government Printing Office – www.gpo.gov Source of Information about the US Economy Federal Reserve Bank – www.FederalReserve.gov Critical Thinking through Writing Rubric Total CTW grading = Draft grading + Final version grading. Total CTW Grade Draft* Final version 100 points 30 points 70 points * Draft revision is mandatory, which consists 30% of total grade. Please evaluate the work on the following skills using the grading scale, and optional writing comments. 1. Identification Points 5 4 3 2 1 Grading Scale Excellent Good Average Fair Poor
  • 78. Criteria Complete, appropriate, no change Complete but needs minor revision in next cycle Incomplete or lacks clarity Missing information, inaccuracies Do not attempt to or fail to identify
  • 79. Identification Appropriately identifies the problem Describe concepts and idea Clearly explains assumption, background, and related theory Cites textbook and appropriately linked directly to book Includes essential information on what the concepts and ideas are for Comment 2. Analytic Points 5 4 3 2 1 Grading Scale Excellent Good Average Fair Poor Criteria Complete, appropriate, no change
  • 80. Complete but needs minor revision in next cycle Incomplete or lacks clarity Missing informations, inaccuracies Do not attempt to or fail to identify Analytic Applies economic concepts (and related formulae) correctly to the given questions Understands and solving the problem
  • 81. http://www.bea.gov/ http://www.bls.gov/ http://www.census.gov/ http://www.gpo.gov/ http://www.federalreserve.gov/ Makes and analyzes logical argument Conclusions are qualified as the best available evidence within the context. Comment 3. Application and Critical Judgment Points 5 4 3 2 1 Grading Scale Excellent Good Average Fair Poor Criteria Complete, appropriate, no change Complete but needs minor revision in
  • 82. next cycle Incomplete or lacks clarity Missing informations, inaccuracies Do not attempt to or fail to identify Application and Critical Judgment Analyzes ideas and able to interpret the result from analytical solution Sees practical implications of abstract ideas Analyzes real-world policies and processes Clearly develops implications and considers ambiguity
  • 83. Formulates pertinent comments Includes discussion of validity of content presented in textbook and opinions Critical thinking used in clearly stating own opinion and that of others carefully cited. Comment 4. Communication and Structural organization Points 5 4 3 2 1 Grading Scale Excellent Good Average Fair Poor Criteria Complete, appropriate, no change Complete but needs minor revision in next cycle
  • 84. Incomplete or lacks clarity Missing informations, inaccuracies Do not attempt to or fail to identify Communication and Structural organization Language clearly and effectively communicates ideas. Organization is clear. Assignment clearly has introduction, body, discussion,
  • 85. conclusion and reference section, if applicable. Grammar, syntax and other errors are minimal. Style is appropriate. Comment 5. Creativity (Optional) Points 5 4 3 2 1 Grading Scale Excellent Good Average Fair Poor Criteria Complete, appropriate, no change Complete but needs minor revision in next Incomplete
  • 86. or lacks clarity Missing informations, inaccuracies Do not attempt to or fail to cycle identify Creativity Conceives interesting questions Finds new ways to analysis Comment