More Related Content
Similar to 5. Seastar 6.5ha Annual P&L+Cash Flow
Similar to 5. Seastar 6.5ha Annual P&L+Cash Flow (20)
5. Seastar 6.5ha Annual P&L+Cash Flow
- 1. Project SeaStar 6.5ha - Bali
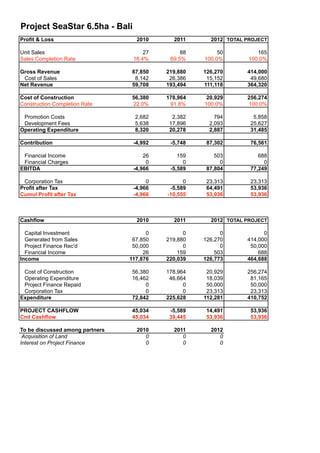
Profit & Loss 2010 2011 2012 TOTAL PROJECT
Unit Sales 27 88 50 165
Sales Completion Rate 16.4% 69.5% 100.0% 100.0%
Gross Revenue 67,850 219,880 126,270 414,000
Cost of Sales 8,142 26,386 15,152 49,680
Net Revenue 59,708 193,494 111,118 364,320
Cost of Construction 56,380 178,964 20,929 256,274
Construction Completion Rate 22.0% 91.8% 100.0% 100.0%
Promotion Costs 2,682 2,382 794 5,858
Development Fees 5,638 17,896 2,093 25,627
Operating Expenditure 8,320 20,278 2,887 31,485
Contribution -4,992 -5,748 87,302 76,561
Financial Income 26 159 503 688
Financial Charges 0 0 0 0
EBITDA -4,966 -5,589 87,804 77,249
Corporation Tax 0 0 23,313 23,313
Profit after Tax -4,966 -5,589 64,491 53,936
Cumul Profit after Tax -4,966 -10,555 53,936 53,936
Cashflow 2010 2011 2012 TOTAL PROJECT
Capital Investment 0 0 0 0
Generated from Sales 67,850 219,880 126,270 414,000
Project Finance Rec'd 50,000 0 0 50,000
Financial Income 26 159 503 688
Income 117,876 220,039 126,773 464,688
Cost of Construction 56,380 178,964 20,929 256,274
Operating Expenditure 16,462 46,664 18,039 81,165
Project Finance Repaid 0 0 50,000 50,000
Corporation Tax 0 0 23,313 23,313
Expenditure 72,842 225,628 112,281 410,752
PROJECT CASHFLOW 45,034 -5,589 14,491 53,936
Cml Cashflow 45,034 39,445 53,936 53,936
To be discussed among partners 2010 2011 2012
Acquisition of Land 0 0 0
Interest on Project Finance 0 0 0