Reactive by example (DevOpsDaysTLV 2019)
•Download as PPTX, PDF•
0 likes•120 views

The reactive manifesto is meant to guide you in building Responsive, Resilient, Elastic (scalable), and Message Driven systems. But these are all bombastic words which are quite meaningless without a good context or good examples. This talk will walk you through a story of improving a real life service, bringing it to perform well, and link the steps to the reactive manifesto cornerstones. Videos link: https://youtu.be/Fg1SJufaHOs

Recommended
Recommended
More Related Content
What's hot
What's hot (20)
Similar to Reactive by example (DevOpsDaysTLV 2019)
Similar to Reactive by example (DevOpsDaysTLV 2019) (20)
Recently uploaded
Recently uploaded (20)
Reactive by example (DevOpsDaysTLV 2019)
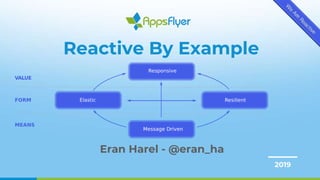
- 1. 2019 Reactive By Example Eran Harel - @eran_ha
- 2. The Reactive Manifesto? 2 ● Published in 2013 ● A blueprint for Reactive Systems ● Patterns for building software that meets modern SLAs
- 3. Source: https://www.reactivemanifesto.org/ A Common Vocabulary for Reactive Systems 3
- 5. The system responds in a timely manner if at all possible. Responsive 5
- 6. The system stays responsive in the face of failure. Resilient 6
- 7. ● Replication ● Isolation ● Delegation ● Failure containment ⇒ Our systems becomes easier to understand, extend, test and evolve Resilience - how-to 7
- 8. The system stays responsive under varying workload. Elastic 8
- 9. Reactive Systems rely on asynchronous message- passing to establish a boundary between components that ensures loose coupling, isolation and location transparency. This boundary also provides the means to delegate failures as messages. Message Driven 9
- 10. We must apply these principles in all layers of our system Reactive All the Things 10
- 11. I still don’t get it... 11
- 12. There is no silver bullet 12
- 13. Scaling a metric delivery system Case Study 13
- 14. Initial Implementation 14 This kept us going for a while… The carbon relay started dropping metrics at ~500K metrics/min
- 15. App -> LogStash -> RabbitMQ -> LogStash -> Graphite The LogStash on localhost couldn’t handle the load, crashed and hung on regular basis. The horror... Initial Implementation - Take II 15
- 16. App -> LogStash -> RabbitMQ -> LogStash -> Graphite The LogStash on localhost couldn’t handle the load, crashed and hung on regular basis. The horror... Initial Implementation - Take II 16
- 17. App -> <Service> -> RabbitMQ -> LogStash -> Graphite The LogStash consumer was way too slow. Queues build up hung RabbitMQ, and stopped the producers on Gruffalo. Yet another failure… Take III? 17
- 18. Kafka delivers on Durability & Throughput But not on Low Latency HW, Networking, and Storage Cost... “Why don’t you just use Kafka?” 18
- 19. App -> Gruffalo -> Graphite (single carbon relay) A single relay is still a bottleneck, and a SPOF Take IV 19
- 20. App -> Gruffalo -> Graphite (multi carbon relay) Great success, but not for long. As we grew our metric count we had to take additional measures to make it stable. Take V - Carbon Relay Replication 20
- 21. Gruffalo acts as a proxy to graphite; it ● Batches Metrics, and improves delivery throughput ● Replicates metrics between regions ● Increases Graphite availability ● Message Driven Introducing Gruffalo - a case study 21
- 22. Metrics Delivery - Deployment Overview 22
- 23. (For most clients) 1. Open a connection to graphite once per minute 2. Publish (thousands of) metrics one by one, and flush each 3. Close connection Metrics Clients Behavior 23
- 25. The Gruffalo Service Design 25
- 27. Client Side Load Balancing 27
- 28. ● A connection to a carbon relay may get disconnected. ● But we have more than one relay! ● We make a noble attempt to find a target to publish metrics to, even if some relay connections are down. Graphite Client Retries 28
- 29. Processes crash, the network is NOT reliable, and timeouts do occur... Graphite Client Reconnects 29
- 30. ● For DR purposes we replicate each metric to 2 regions ● Yes it can be done using other techniques… ● Sending millions of metrics across the WAN, to a remote region is what brings most of the challenges Cross Region Metric Replication 30
- 31. ● The graphite targets can get disconnected in a graceless manner ● This renders the outbound channel unwritable, and may hang the service ● Solution: trigger reconnect when the outbound channel is idle for more than a few seconds Handling Graceless Disconnections 31
- 32. ● You should experiment with IPTables and Linux TC to simulate such issues ● Be careful not to lock yourself out of the server though ;) Graceless Disconnections Simulation 32
- 33. ● NIC Queues ● SO_BACKLOG queues ● Netty event loop queues ● And on each device on the way... Queues Everywhere 33
- 34. ● When queues grow unbounded, at some point, the process will exhaust all available RAM and crash, or become unresponsive. ● At this point you need to apply some pressure relief strategy ● Queues increase latency. ○ latency = processing time + time in Q ○ Latency measurement must not ignore Q time! Are queues bad? 34
- 35. ● Back Pressure SLA--: ● Load Shedding ● Spooling ● Crash... Pressure Relief 35
- 36. ● When one component is struggling to keep-up, the system as a whole needs to respond in a sensible way. ● Back-pressure is an important feedback mechanism that allows systems to gracefully respond to load rather than collapse under it. Back Pressure 36
- 37. ● Netty sends an event when the channel writability changes ● We use this to stop / resume reads from all inbound connections, and stop / resume accepting new connections ● This isn’t enough under high loads Applying Back-Pressure How-to 37
- 38. Throttling based on outstanding messages count works better and places better bounds on the amount of resources we need to hold Throttling Based Back-Pressure 38
- 39. ● Broken inbound connections can’t be detected by the receiving side. ● Half-Open connections can be caused by crashes (process, host, routers), unplugging network cables, etc ● Solution: We close all idle inbound connections Idle / Leaked Inbound Connection Detection 39
- 40. Auto-Scaling 40
- 41. How can we spread the load between our servers? ● ELB/ALB? ● L4 LB? ● DNS? ● Client Side? The targets locations need to be transparent Load Balancing 41
- 42. Summary
- 43. ● ~300K metrics/second ATM (~18M per minute) ● During benchmarking: 750K metrics/sec (latency < 5ms for the 99.9%) ● So we have room to grow and a single instance can carry the load still Scale 43
- 44. Food For Thought
- 47. • https://www.reactivemanifesto.org/ • https://github.com/eranharel/gruffalo • https://graphiteapp.org/ • netty.io/ Links 47
Editor's Notes
- Hi everybody, my name is Eran Harel, and I’m AppsFlyer’s platform group architect This is my twitter handle, so feel free to get in contact if you have questions after this talk I’ve been writing software professionally for about 19 years, and I always loved solving scale issues And over the years, I’ve always asked myself what are the important qualities of services that deal with high concurrency and high throughput, but still remain robust and resilient when things start failing around them. Or put it in other words, I was looking for the patterns that help you build such services And at some point I stumbled across the Reactive Manifesto
- So who here is familiar with the reactive manifesto? The Reactive Manifesto is a document that defines the core principles of reactive systems. It was first released in 2013 And the reason for publishing the it was that Application requirements have changed dramatically during these years. Runtime environment changed Tighter SLAs like lower latency, higher throughput, availability and “linear scalability”. Quite a few different buzzwords, tools and techniques emerge in the industry at that time, By various organizations
- And there was a need for a common vocabulary And so, the Reactive Manifesto describes what Reactive Applications are and defines them through four high-level traits; Responsive, Resilient, Elastic, and Message Driven
- I know it sounds like the usual bunch of buzzwords, So in this talk I’ll try to explain using my own words what those concepts mean, and why they’re important. And I’ll demonstrate how these concepts are applied in real life.
- Responsiveness is the cornerstone of usability. Responsiveness is what we’re trying to achieve here basically. It means that The system responds in a timely manner if at all possible. Responsive systems are systems that provide predictable, bounded, and reasonably short response times This consistent behavior simplifies error detection and handling And in general responsive systems are what makes users come back to your service right? To become responsive, our system needs to be Resilient and Elastic
- Resilience means that the system stays responsive in the face of failure <>
- Resilience is achieved by means of Replication - which basically means having several copies of your “components” By means of Isolation - which means decoupling between your components, between senders and receivers, and location transparency. And by Delegation - which basically means letting other components handle tasks for us in an asynchronous fashion And when you use these techniques, you get systems that are easier to understand, extend, test and evolve.
- Elasticity means that the system stays responsive under varying workload. It means that your system scales up or down as the load on your system changes in order to meet the required throughput. ...Which in turn means that you cannot have any contention points or centralized bottlenecks in your system
- And the technique that help us achieve resilience and elasticity is called message driven architecture It means that your system relies on asynchronous message passing. Messages are sent to location transparent recipients Recipients are basically “handlers” which either react to incoming message or remain idle. Meaning we only consume resources when active This sort of design is what enables us to establish a clear boundary between components, and achieve loose coupling, isolation and location transparency. And it also allows us to easily apply load balancing and flow control Or to put it in other words: it’s the technique we use to become resilient and elastic
- Large systems are composed of smaller ones, which means that in order to preserve the reactive qualities of our system, we must apply these principles in all layers of our architecture
- OK, this is the end of the theoretical part… And I know it probably still sounds like a bunch of buzzwords… So, I’d like to dive into a real life use case that will demonstrate how we can apply at least some of these concepts
- But before I begin, I’d like to stress out, that This case study demonstrates a solution to specific requirements You may have to apply other techniques for your own systems, Or put it in other words: there is no silver bullet!
- OK, so this is devopsdays, and I bet you all love your metrics. So let’s discuss a tale of scaling our metrics delivery system…
- So at a fictional company I used to work with we used graphite to store our metrics and the system looked roughly like this diagram All of our services had a graphite metrics reporter in them, and this reporter would send the service metrics directly to the graphite relay once per minute. This strategy held reasonably well until we reached around 500K metrics/min (or 8.3K metrics/sec) At that point the graphite relay started dropping metrics, mainly due to its inability to handle the high rate of IO interrupts
- Someone quickly implemented a solution that introduced RabbitMQ and logstash into the system The metrics reporter wrote to logstash running on localhost, logstash published the metrics to rabbitMQ, and on the other end, logstash consumed the metrics and publish to graphite. And guess what? Logstash may work OK in pull mode, but it simply doesn’t work well in push mode and crashes at ridiculously low request rates
- SO KIDS, DON’T DO THIS AT HOME <P> Seriously...
- At this point I played with the idea of replacing the local logstash agent with a service I wrote. And the problem was, that the logstash consumer was still way too slow, Causing the rabbitMQ service to hang due to the Q becoming too long Which stalled the metrics publisher, bringing the metrics delivery system to a halt.
- Before you say it, I do know that Kafka can solve some of these issues, But the problem with kafka is that when you deal with metrics, freshness is more important than durability, and Kafka is tuned for throughput not for low latency. Plus, kafka based solutions tend to be more expensive in terms of HW, networking and storage
- So instead of using a queueing system I realized that what we need to do, is to introduce a service that will sit on top of the graphite relays, and protect them from the roaring crowd trying to write masses of metrics into the system. We called this service Gruffalo This solution did scale our system, But the single carbon relay was still a bottleneck, and a SPOF. Luckily, with Gruffalo in place, it is now easier to start implementing responsiveness features If someone asks: At that point in time there were no alternatives to the python carbon-relay, and I decided to write a service on top and avoid having to implement a relay, and couple ourselves to the graphite internals.
- So in the next iteration we added several carbon relays, and gruffalo performed client side load balancing on top of them This greatly increased the carbon relays capacity and availability, but we still discovered more and more “interesting” issues we had to take care of as the volume of the metrics grew over time.
- Before we go on, let’s review what this module we called Gruffalo is: The main role of Gruffalo is to protect graphite, and it does so by utilizing several strategies: The first strategy is batching: this is quite similar to the kafka strategy of batching messages in order to increase throughput Gruffalo is built on top of Netty. Netty is a low level message driven networking library. It allows you to write network services and protocols that handle massive throughput, and very high concurrency levels And one other role of Gruffalo is to replicates metrics between clusters.
- The deployment of the gruffalo service looks roughly like this: In each Region, multiple clients are writing their metrics to gruffalo once per minute There are several decoupled instances of Gruffalo, each can receive those metrics Gruffalo batches the metrics, and sends them to the carbon relays And gruffalo also replicates the metrics to a remote region
- We have quite a few metric client types in our system, But for the most part metrics publishers send metrics to graphite one per minute, and for each batch they: Open a new connection to graphite Write their metrics one by one to the connection, and flush immediately after each write Close the connection So the graphite targets (or gruffalo in this context) don’t have to maintain an open connection to all clients all the time, but they do have to deal with those unbatched flushes
- Let’s dive into how the gruffalo service is designed
- The gruffalo service is built on top of netty. Netty is basically an event loop with a pipeline of handlers Our inbound pipeline looks roughly like this: The first handler is an idle state handler - it’s role is to detect bogus or flaky clients and disconnect them to prevent connection leaks The next handler cuts the metric lines according to the protocol - basically this is done by new-line delimiter for the line protocol The next handler batches the metric line buffers And the last handler is in charge of publishing batches using the internal graphite client
- And the graphite client is also netty based, And for each carbon relay we have a pipeline that looks like so: The first handler is an Idle state handler. It’s role is to detect when the target relay disconnects ungracefully. This prevents us from hanging in all sorts of sad scenarios - we’ll talk about this in a bit And the second handler is in charge of connecting / reconnecting to the targets, throttling, back-pressure, etc
- We actually hold a client per graphite relay cluster, and perform client side LB per cluster So if we zoom out it looks roughly like so And the client performs round robin LB, and retries between the targets
- The connection to the carbon relays sometimes gets disconnected, gracefully or ungracefully. It can happen from all sorts of reasons - for example: a deployment, network blip, etc. But we have several relays in each cluster, so the client then makes a best effort attempt to find an alternative relay we can still publish the metrics to.
- We all know here that the network is unreliable, and especially over the WAN disconnections will happen, timeouts may occur, So our client detects these issues and reconnects to the downed relays as soon as they come back up
- For DR and durability reasons we replicate the metrics to 2 different regions. This is actually the most challenging part of this service - Replicating over the WAN at this rate can be tricky, and at some point becomes almost impossible… But hey, this is what makes our lives interesting, right?
- And one of the issues we discovered was that graceless disconnections do happen. It can happen due to a human error, due to a power outage, flooded generators, tropical storm, etc You know - those things that shouldn’t happen but still somehow do happen at an unreasonable rate, go figure And when this happens the TCP stack fails to detect that the connection is down, and simply sits idle waiting for an ACK. What happens next is that the connection becomes unwritable, but it still seems to be connected, so our system hangs waiting to be able to write What we did to solve this was to add a timeout that occurs when the connection is idle for more than a few seconds, and we simply close the connection, and let the client reconnect when the target goes back up.
- If you want to simulate this scenario - it’s very easy to do so with IPTables, just be careful not to lock yourself out of a server like I once did ;)
- Although we got rid of that thing in the system that is called a queue, it turns out there are still queues EVERYWHERE, but we just don’t see them when we code... There are Qs in the network interface There are backlog queues There are Qs in the netty event loop, for inbound and outbound messages There are Qs in each and every device our communication goes through in the network or outside of the network
- The problem with these queues, is that when we’re not aware of the existence of the Q, or when we don’t have control over the length of the Q, And under certain conditions we may run out of resources and become unresponsive, or crash Another problem with Qs is that Qs increase latency Basically your service latency will be the service processing time + the time spent in the Q As a side note, many times we tend to measure the internal service processing time, and we totally ignore the time spent in the backlog, which leave us practically blind to latency issues in our system
- Luckily there are several strategies we can implement in order to avoid Qs buildup: The first strategy is called Back Pressure - which means signaling the clients that we are currently unable to handle their requests, or put it in other words - push the clients back The second strategy is called Load shedding - which in our context basically means dropping some of the metrics on the floor And the third option is Spooling - which means temporarily storing the metrics we can’t handle ATM somewhere else, and publish them later when we can The last 2 techniques basically mean reducing the SLA as we either lose data, or delay it …and yeah… crashing is not an option...
- The technique we chose for the Gruffalo service is to apply back pressure This strategy means that the server will not drop requests in an uncontrolled fashion, Instead - it communicates the state of the server to the clients, allowing them to slow down, or choose another target, and allowing the system to add more resources if possible
- How do we implement back pressure? Gruffalo is written on top of netty, and netty provides us with an event that tells us that the outbound channel has become unwritable. When this happens, we close the inbound channels, and also stop accepting new connections. This technique works, but we found that it’s not fast enough under load, and the server is already under stress when the event occurs,
- So we also implemented a throttling mechanism based on the number of outstanding messages, that is, the number of messages we sent but the async send operation did not complete yet. Then, when a certain threshold is exceeded we apply back-pressure, and when we go below a low water mark, we remove the back-pressure This way we can put bounds to the amount of data we have to hold in RAM
- Leaked inbound connections: Clients normally close their connections gracefully, but when they don’t - For example when the client process crashed leaving a half-open socket, or when network cable got disconnected, it takes quite a long time for the receiving end of our service to detect this, even when using TCP keep-alive. So to avoid wasting precious resources on bogus or problematic clients, we added timeout that detects when a client connection has become idle, and we simply close this connection when that happens
- Auto scaling: When the load on our service increases and we’d like to be able to deploy more instances and spread the load between them At AppsFlyer we implement auto-scaling based on metrics. When we go above or below certain thresholds we add or remove spots or on-demand hosts accordingly,
- Then, there are multiple strategies in which we can implement load balancing: We can use a Cloud provider based load balancer, like ALB - works but can be quite expensive for high traffic. Also feels a bit absurd to place a proxy on top of a proxy... We can use a L4 LB - quite cheap and works well for network services, but doesn’t always spread the load evenly on all targets (depending on the implementation) We can use DNS - works but hard to get right at scale And another option is to implement Client Side Load Balancing - which at least from my experience, works best for high throughput low latency service, but requires a significant programmatic effort on your end Do note, that no matter which strategy we use, the actual targets locations needs to be transparent to the clients
- We talked about what being responsive means We explained what resilience and elasticity means, And mentioned that in order to be responsive, your system needs to be both resilient and elastic We explained that we should be using a message driven architecture, in order to achieve resilience and elasticity And we showed how all these bombastic words can be applied in real life.
- We also stated and demonstrated, how these principles can and should be applied everywhere - in all layers of our system And so, after all this hard work The current scale the system has to deal with is about 300K metrics/sec per region, which translates to about 18M metrics per minute Each instance of our gruffalo service can actually deal with a lot more than that, so we can sleep well at night ;)
- One last point… Have you noticed how I haven’t mentioned K8s even once throughout this presentation? You know why?
- Because Kubernetes will not solve your design issues. It’s just a system that may help you, but it’s not magical. You will still have to do some proper engineering work in order to get everything to work at scale So please stop talking about K8s people Talk about engineering!