1. Evaluation of Pathway-focused PCR Array for Expression
Profiling of Drug Metabolizing Enzymes
Lei Guo1, Stacey Dial1, Leming Shi1, Baitang Ning2, Yanyang Sun3, Jie Wang3, Jingping Yang3& Yvonne Dragan1
1Division
of Systems Toxicology, 2Division of Personalized Nutrition and Medicine,
National Center for Toxicological Research, FDA, Jefferson, AR 72079, USA
3SuperArray Bioscience, Frederick, MD 21704, USA
Materials and Methods
Reference RNA Sample and Sample Definition: Universal Human Reference
RNA (UHRR) was purchased from Stratagene (La Jolla, CA) and Human Brain
Reference RNA (HBRR) was purchased from Ambion (Austin, TX). UHRR was
defined as sample A and HBRR was defined as sample B.
8
54
4
Primary Human Hepatocytes and Cell Treatments: Human hepatocytes were
obtained from University of Pittsburg as part of the Human Tissue Network.
Approximately 2 × 10⁶ cells were treated with final concentrations as omeprazole
(50 µM), rifampicin (20 µM) and gallic acid (10 µM), respectively.
Site A
Site B
RNA Isolation and Quality Control: Total RNA from cells was isolated using
an RNeasy system (Qiagen). High quality RNA with RNA integrity numbers
(RINs) greater than 8.5 were used for further experiments.
The overlapping DEG list between test site A and B is represented in the
Venn diagram.
Real-time RT-PCR: Real-Time PCR was carried out using Applied Biosystems
7000 or 7500 Fast Real-Time PCR System.
25
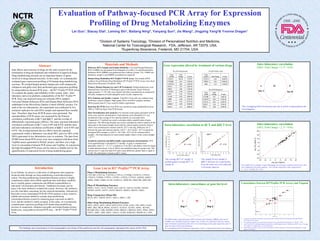
Inter-laboratory correlation
(DEG: Fold Change > 2, P < 0.05)
20
10
ΔCT
20
ΔΔCT
8
15
6
15
10
5
R2 = 0.99
0
-5
4
ave_dCt_SiteA_B
Sensitivity detection and differentially expressed genes determination: PCR
Array quantification is decided by CT number. A gene is considered not
detectable when CT > 35. CT is marked as 35 for ΔCT calculation when the signal
is under detection limit. A list of DEGs was identified using two group t-test. The
criteria were P value less than 0.05 and a mean difference greater than or equal to
2 fold. The calculation is based on ΔCT values.
Intra-laboratory correlation at ΔCT and ΔΔCT level
ddCt_SiteA_Exp1
Data Normalization and Analysis: Five internal control genes presented in PCR
Array were used for normalization. Each replicate cycle threshold (CT) was
normalized to the average of five internal controls on a per plate basis.
Comparative CT method was used to calculate relative quantification of gene
expression. The following formula was used to calculate the relative amount of the
transcripts in the treated sample (treat) and the control sample (control), both of
which were normalized to internal controls. ΔCT is the log2 difference in CT
between the gene and internal controls, ΔΔCT = ΔCT (treat) - ΔCT (control) for
biological RNA samples or ΔΔCT = ΔCT (B) - ΔCT (A) for reference RNA
samples. The fold-induction for each treated sample relative to the control sample
= 2ΔΔ-CT.
2
0
R2 = 0.98
-2
-4
-6
-10
-8
-15
10
5
0
-10
-15
-10
-5
0
5
10
15
ave dCt SiteA_Exp2_A
20
25
-10
-8
-6
-4
-2 0
2
4
ddCt_SiteA_Exp2
6
8
10
The sample B over sample A
ΔΔCT between two experiments
from the same site were subjected
to bivariate analysis.
Gene List in RT² Profiler™ PCR Array
-5
-10
-15
-15
-10
-5
0
5
10
ave_dCt_SiteB_B
15
20
The sample B over sample A log2 fold change for each gene common between two sites
were subjected to bivariate analysis. The red line represents a liner regression fit.
Y = 0.11 + 0.993X, R2 = 0.95
Phase I Metabolizing Enzymes:
CYP11B2, CYP17A1, CYP19A1, CYP1A1, CYP2B6, CYP2C19, CYP2C8,
CYP2C9, CYP2D6, CYP2E1, CYP2F1, CYP2J2, CYP3A5, ADH1B, ADH1C,
ADH4, ADH5, ADH6, ALAD, ALDH1A1, HSD17B1, HSD17B2, HSD17B3.
Phase II Metabolizing Enzymes:
Intra-laboratory concordance at gene list level
Concordance between RT²Profiler PCR Arrays and Taqman
8
EPHX1, NAT1, NAT2, COMT, GGT, GSTA3, GSTA4, GSTM2, GSTM3,
GSTM5, GSTP1, GSTT1, GSTZ1 MGST1, MGST2, MGST3, NQO1.
6
CHST1
CYP2J2
4
Drug Transporters (Phase III):
ABCB1
MT2A, MT3, ABCB1 (PGY1, mdr-1), ABCC1, GPI.
Other Drug Metabolizing Related Enzymes:
GPX1, GPX2, GPX3, GPX4, GPX5,CES2, CES4, GAD1, LPO, MPO, FAAH,
FBP1, HK2, PKLR, PKM2, ALOX12, ALOX15, ALOX5, APOE, BLVRA,
BLVRB, DIA1, GSR, MTHFR, NOS3, SRD5A1, SRD5A2, PON1, PON2, PON3,
CHST1, ABP1, AHR, ARNT, ASNA1, GCKR, MARCKS, SMARCAL1, SNN.
2
Exp 1
50
4
Exp 2
log2 FC_PCR Array
Introduction
(DEG: Fold Change > 2, P < 0.05)
Human Drug Metabolism RT² Profiler™ PCR Array: First strand cDNA
synthesis kit and Human Drug Metabolism RT²Profiler™ PCR Arrays were from
SuperArray Bioscience (Frederick, MD).
The average ΔCT of sample A
plotted against average ΔCT of
sample B.
In our lifetime, we process a wide array of endogenous and exogenous
chemicals daily through our drug metabolizing system/detoxification
system. The drug metabolizing system/detoxification system is a highly
complicated complex that exhibits significant inter-individual variability
due to variable genetic components and different responsibilities to
individual’s environment and lifestyle. Traditional enzymatic activity
assay is the basic method to evaluate this system. However, this method is
not only time/labor consuming, but also material demanding. Alternatively,
Real-time reverse transcriptase PCR (RT-PCR) analysis is more sensitive,
reliable and accurate method to evaluate drug metabolizing
system/detoxification system by measuring gene expression at mRNA
level, and this method is widely accepted. In this study, we systematically
evaluated gene expression profiling of 84 human drug metabolizing
enzymes in omeprazole, rifampicin and gallic acid treated human primary
hepatocytes, using pathway-focused PCR array – the RT² Profiler™ PCR
Array.
Inter-laboratory correlation
Gene expression altered by treatment of various drugs
ave dCt SiteA_Exp1_A
Abstract
Side effects and toxicities of drugs are the main reasons for the
termination of drug development and withdrawal of approved drugs.
Drug metabolizing enzymes are an important battery of genes
involved in drug-induced toxicities. In this study, we systematically
evaluated gene expression profiling of 84 human drug metabolizing
enzymes. We treated human primary hepatocytes with omeprazole,
rifampicin and gallic acid, then performed gene expression profiling
by using pathway-focused PCR array – the RT² Profiler™ PCR Array.
To evaluate the quality and reliability of this system, intra-, interlaboratory and cross-platform comparability of the RT² Profiler™
PCR Array was analyzed using two reference RNA samples,
Universal Human Reference RNA and Human Brain Reference RNA
established in the MicroArray Quality Control (MAQC) project. For
each of the two laboratories, the experiment was conducted in five
technical replicates for each RNA sample and repeated three months
later. Therefore, data from 40 PCR arrays were generated. The
reproducibility of PCR arrays was measured by the Pearson
correlation coefficients of ΔCT and ΔΔCT, and the overlap of
differentially expressed genes (DEGs). The intra- and inter-laboratory
correlation coefficients of ΔCT were 0.995 and 0.976, and the intraand inter-laboratory correlation coefficients of ΔΔCT were 0.987 and
0.974. The overlap between the two DEGs from the repeated
experiments within a laboratory was about 90%, and over 90% of the
DEGs generated in two laboratories were in common. The data from
SYBR Green based PCR arrays were also compared with those from
TaqMan assays generated in MAQC project, and there was a high
level of concordance between PCR arrays and TaqMan. In conclusion,
the high throughput PCR arrays can be used as a reliable tool for the
quantification of expression levels of drug metabolizing genes.
2
ALOX15
0
CYP2C9
CYP2D6
GSTT1
SRD5A1
CYP3A5
-2
ABCC1
CYP1A1
NAT2
-4
-6
HSD17B2
-8
-8
The findings and conclusions in this presentation are those of the author(s) and do not necessarily represent the views of the FDA.
The differentially expressed genes (DEG) between the treatment (HBRR) and control
(UHRR) were identified based on simple t-test. A DEG was identified when the criteria
meets minimum requirements that were a two-fold change in the gene expression and a Pvalue less than 0.05 for the difference.
The overlapping DEG list between experiment 1 and 2 is represented in the Venn diagram.
-6
-4
-2
0
log2FC_TAQ
2
4
6
8
13 genes were found commonly presented in both TaqMan (MAQC) and Human Drug Metabolism
RT²Profiler PCR Arrays.
The regression analysis was performed using pair-wise identified common gene sets. The R2 = 0.89
Alox15 and NAT2 exhibited opposite directions in fold changes between TaqMan and PCR Array. Average
CT numbers in TaqMan data > 35 for both genes.
When these two genes were removed from analysis, the R2 increased to 0.96, demonstrating there is high
degree of similarity.