1. Monitoring Drug Toxicity with Real-Time PCR Arrays
Savita Prabhakar, Hewen Zhang, Xiao Zeng
SuperArray Bioscience Corporation, Frederick, MD
Abstract
This study describes the use of a real-time PCR Array-based method
for profiling drug toxicity. Rezulin, a glitazone PPARg agonist, was
approved for treatment of type 2 diabetes mellitus, but was withdrawn
from the market due to idiosyncratic liver toxicity. The actual
mechanism of this toxicity has not been completely elucidated (1-2).
However, two similar drugs, Avandia and Actos, are considered to be
safe treatments for the same condition. Using the Human Drug
Metabolism and Stress & Toxicity PathwayFinder RT²Profiler™ PCR
Arrays, we have found specific gene expression profiles in liver HepG2
cells that differentiate Rezulin from the other two glitazone drugs.
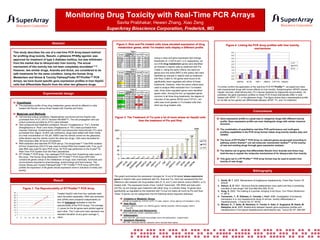
Figure 2: Rosi and Pio treated cells show elevated expression of drug
metabolism genes, while Tro treated cells display a different profile
Table I
Symbol
CYP1A1
CYP2B6
CYP3A5
GCKR
MT2A
NOS3
Average Ct
Fold P/D P-value
DMSO Pio
17.8
27.65 23.50
2.8E-06
5.4
34.43 32.00
7.7E-05
3.0
30.65 29.07
2.6E-04
3.1
25.95 24.33
2.2E-06
18.6
33.95 29.73
1.2E-05
6.1
32.35 29.73
9.7E-07
Table II
Symbol
CYP1A1
CYP2B6
CYP3A5
GCKR
MPO
MT2A
NOS3
Average Ct
Fold R/D P-value
DMSO Rosi
21.4
27.65 23.23
4.3E-06
3.5
34.43 32.63
1.5E-03
3.3
30.65 28.93
4.3E-04
2.9
25.95 24.40
3.0E-05
3.0
36.63 35.03
1.7E-03
8.1
33.95 30.93
1.4E-03
5.3
32.35 29.93
3.4E-06
Table III
Experimental design
Hypothesis
The expression profile of key drug metabolism genes should be different in cells
treated with Rezulin versus those treated with Avandia and Actos.
Average Ct
Fold T/D P-value
DMSO Tro
-4.4
CYP17A1 33.13 35.27
3.9E-03
42.7
CYP1A1
27.65 22.23
1.2E-06
4.2
CYP2B6
34.43 32.37
4.5E-04
-9.6
GPX2
23.70 26.97
2.8E-03
7.1
GSTP1
35.03 32.20
2.8E-03
MT2A
33.95 25.73 297.5
5.5E-07
-4.9
NAT2
30.15 32.43
5.3E-04
4.2
NOS3
32.35 30.27
6.7E-05
Symbol
4.5
4.0
Using p-value and gene expression fold-change
thresholds of < 0.0015 and > 2.9, respectively, six
out of 84 drug metabolism genes were identified
as induced in HepG2 cells by treatment with Pio
(Table I). Using the same criteria, the same six
genes plus one extra (MPO in the yellow cell) were
identified as induced in HepG2 cells by treatment
with Rosi (Table II). No genes were found to be
significantly down-regulated with either of these
treatments. However, when the same criteria were
used to analyze RNA extracted from Tro-treated
cells, three down-regulated genes were identified
(green cells). Among the four up-regulated genes
common in all three drug-treatments, the degree of
induction of two genes (MT2A and CYP1A1, red
cells) was much greater in Tro-treated cells than
other two drug-treated cells.
Result
Figure 1: The Reproducibility of RT2Profiler™ PCR Array
Profiler™
45
40
35
30
25
20
15
10
5
0
0
5
10
15
20
25
30
35
40
45
Treated HepG2 cells from four replicate wells
were harvested separately. RNA was extracted,
and cDNAs were prepared independently as
four (4) biological replicates to test the
reproducibility of the PCR Arrays. The average
Ct values for the 84 genes were plotted against
each other. The Y-axis error bars represent one
standard deviation at any given average Ct
value.
3.5
3.0
TC
2.5
APAP
2.0
Tro
1.5
1.0
0.5
0.0
GAPDH
ACTB
FBP1
HMOX1 CYP17A1 DNAJA1
To further confirm the application of the real-time PCR RT²Profiler™, we tested two other
well-characterized drugs with known effects on liver toxicity. Acetaminophen (APAP) causes
hepatic necrosis, while tetracycline (TC) induces steatosis by triglyceride accumulation. As
predicted, the gene expression profiles on these PCR Arrays dramatically differ in cells
treated with APAP, TC, or the glitazone drugs. This figure shows that a representative profile
for as little as four genes can differentiate between APAP, TC, and Tro treatment.
Conclusions
Materials and Methods
Figure 3: The Treatment of Tro puts a lot of more stress on HepG2 cells
than the treatment of Pio and Rosi
5005
70
5000
60
50
125
119
40
P/D
R/D
30
Gene expression profile is a great way to categorize drugs with different toxicity
profile. Gene expression profile can even distinguish drugs with similar chemical
structure.
The combination of quantitative real-time PCR performance and multi-gene
profiling capabilities in the PCR Array format makes drug toxicity studies easy and
reliable.
128
The focus of RT2Profiler™ PCR Array on relevant genes pre-grouped according to
pathway-centric themes(3) can aid molecular mechanistic studies(4-5) of the toxicity
of new and existing drugs through gene expression analysis.
T/D
20
The distinct set of genes that differentiate Rezulin from Avandia and Actos may
hold the key to explain the molecular mechanisms of its idiosyncratic liver toxicity.
10
0
18
Sr
RN
A
AC
T
HM B
G OX
AD 1
D
4
DN 5A
AJ
B
HS 4
PC
A
HS
PA
HS 5
P
CY H1
P1
A1
TN
F
DD
HS IT3
PA
1A
CS
F2
M
T2
CR A
YA
B
HS
PA
6
Cell line and culture conditions: Hepatocellular carcinoma cell line HepG2 was
purchased from ATCC (ATCC Number:HB-8065™). The cell propagation and subculture protocols provided by ATCC were followed.
Test compound and treatment conditions: Rezulin (Troglitazone or “Tro”), Avandia
(Rosiglitazone or “Rosi”) and Actos (Pioglitazone or “Pio”) were purchased from
Cayman Chemical. Acetaminophen (APAP) and tetracycline hydrochloride (TC) were
purchased from Sigma. At 80% cell confluence, drugs were added with fresh media
at a final concentration of 100 µM. DMSO was the vehicle control for the glitazones,
while ethanol was the vehicle control the other two drugs. Cells were harvested for
RNA extraction after 24 hours of treatment.
RNA extraction and real-time RT-PCR set-up: The ArrayGrade™ Total RNA Isolation
Kit from SuperArray (GA-013) was used to extract RNA from treated cells. Four µg of
total RNA was used for each PCR Array. All PCR was performed on the iCycler® iQ
Real-Time PCR System from Bio-Rad Laboratories.
RT² Profiler™ PCR Array: Two cataloged PCR Arrays from SuperArray were used in
this study. The Human Drug Metabolism RT² Profiler™ PCR Array (APH-002)
contains 84 genes critical in the metabolism of drugs, toxic chemicals, hormones and
micronutrients important to pharmacology, endocrinology and food science. The
Human Stress and Toxicity PathwayFinder™ RT² Profiler™ PCR Array (APH-003)
profiles the expression of 84 genes whose expression level is indicative of stress and
toxicity.
Figure 4: Linking the PCR Array profiles with liver toxicity
mechanisms
This gene set in a RT2Profiler™ PCR array format may be used to predict liver
toxicity of new drugs.
Bibliography
This graph summarizes the expression changes for 14 out of 84 tested stress-responsive
genes in HepG2 cells upon treatment with Pio, Rosi and Tro. Each bar represents the folddifference ratio between the drug-treated cells (P, R, and T) and vehicle control (DMSO, or D)
treated cells. The expression levels of two “control” transcripts, 18S rRNA and beta actin
(ACTB), do not change upon treatment with either drug. In contrast, these 14 genes were
significantly up-regulated by the treatment with Tro but not nearly as much by Pio and Rosi.
These 14 genes can be categorized into the following stress-response pathways:
Oxidative or Metabolic Stress:
CRYAB (a-Crystallin B), CYP1A1 (CYP1, P1-450), HMOX1, MT2A (METALLOTHIONEIN II, MT2)
Heat Shock:
DNAJB4, HSPA1A (hsp70 1A), HSPA5 (grp78), HSPA6 (hsp70B), HSPCA (hsp90), HSPH1
(hsp105)
Growth Arrest and Senescence:
DDIT3 (GADD153, CHOP), GADD45A (DDIT1)
Inflammation:
CSF2 (GM-CSF, granulocyte-macrophage colony stimulating factor, molgramostin)
Apoptosis Signaling:
TNF (TNF, monocyte-derived, cachectin, tumor necrosis factor alpha)
1. Smith, M. T. 2003. Mechanisms of troglitazone hepatotoxicity. Chem Res Toxicol 16:
679-87
2. Nelson, S. D. 2001. Structure toxicity relationships--how useful are they in predicting
toxicities of new drugs? Adv Exp Med Biol 500: 33-43
3. Zeng, X. 2003. The making of a portrait--bringing it into focus. Curr Pharm Biotechnol
4: 397-9
4. Yamamoto, T., R. Kikkawa, H. Yamada, I. Horii. 2006. Investigation of proteomic
biomarkers in in vivo hepatotoxicity study of rat liver: toxicity differentiation in
hepatotoxicants. J Toxicol Sci 31: 49-60
5. Minami, K., T. Saito, M. Narahara, H. Tomita, H. Kato, H. Sugiyama, M. Katoh, M.
Nakajima, et al. 2005. Relationship between hepatic gene expression profiles and
hepatotoxicity in five typical hepatotoxicant-administered rats. Toxicol Sci 87: 296-305