1. Technical Note
ABI 7500 (for Software Version 1.3.0)
Instrument Setup Instructions for RT2Profiler™ PCR Arrays
Preparation
Before the Experiment (Presetting the Machine will save time for your run):
Please make sure the system has been properly calibrated for the region of interest (ROI), background, and
pure dye. (Refer to the manufacturer’s Installation and Maintenance manual for the calibration procedures if
needed).
Set up a PCR protocol template file on the ABI 7500 Fast System SDS software as follows:
1)
2)
Open the ABI 7500 Fast System SDS Software on the desktop of the computer that is connected to the ABI
7500 system.
Select File New, the New Document Wizard dialog box will appear.
a) Select Assay Absolute Quantification (Standard Curve).
b) Select Container 96-Well Clear.
c) Select Template Blank Document.
d) The fields for Operator, Comments and Default Plate Name are optional. You can use these to enter
any additional information that you would like to save to the file.
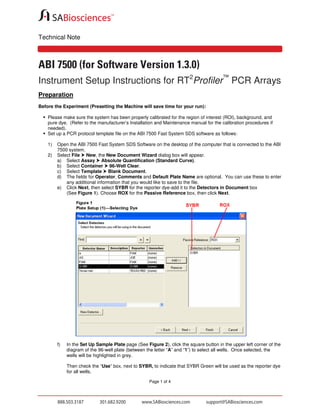
e) Click Next, then select SYBR for the reporter dye-add it to the Detectors in Document box
(See Figure 1). Choose ROX for the Passive Reference box, then click Next.
f)
In the Set Up Sample Plate page (See Figure 2), click the square button in the upper left corner of the
diagram of the 96-well plate (between the letter “A” and “1”) to select all wells. Once selected, the
wells will be highlighted in grey.
Then check the “Use” box, next to SYBR, to indicate that SYBR Green will be used as the reporter dye
for all wells.
Page 1 of 4
2. Technical Note
g)
h)
Click Finish, this will open the Plate document with the completed plate setup.
Select the Instrument tab. Click to display the Thermal Profile box (See Figure 3). In the Settings
near the bottom of the screen, select Standard 7500 for Run Mode. A dialog box will appear; click
“Yes” when asked to reset the settings to the default protocol. The Thermal Profile will be converted
to the default settings of Standard 7500 run mode. Double click on the vertical line of the step you wish
to delete; Step will turn black. Delete Stage 1 by clicking the Delete button. Then continue to edit the
Thermal Profile as follows: Enter 95.0° for 10:00 minutes for Stage 1 with Reps 1; for Stage 2, enter
C
95.0° for 0:15 (15 seconds) followed by 60.0° for 1:00 minute with Reps 40 (40 cycles). Click the
C
C
Add Dissociation Stage button; the pre-set dissociation stage will be added as Stage 3. Put 25 uL for
Sample Volume and select Stage 2, Step 2 (60.0@1:00) for Data Collection.
i)
Then select File Save As to save the template file. Save the file as SDS Templates (*.sdt) with the
2
filename “RT Profiler™ PCR Array Protocol Template” (click Save).
Page 2 of 4
3. Technical Note
2
Alternatively, download the PCR protocol template file (RT Profiler™ PCR Array Protocol Template-ABI.sdt)
from SABiosciences website http://www.SABiosciences.com/home.php.
Performing Real-Time PCR Detection
1)
2)
3)
4)
5)
6)
If the thermocycler is off, press the power button to switch on the instrument. Wait for the instrument to
boot and display the Power status light. Switch on the computer connected to the thermocycler.
Make sure that there are no bubbles in any well, and that the reaction mix is positioned at the bottom of
each well. If not, centrifuge the plate at ~1000 g for 45 seconds.
Open the tray and place your plate in the precision plate holder with the last row (row H) facing front. Make
sure the plate is properly aligned in the holder, well A1 should be positioned at the top-left corner of the
tray. To close the tray door, press the tray to move it into the instrument while applying pressure to the right
side of the tray at an angle.
Open the ABI 7500 Fast System SDS Software
2
Select File New. In the New Document Wizard dialog box, select Browse to load the RT Profiler™
PCR Array Template file. Then click Finish. This will load the previously saved setup to the new plate
document. Save the new document under a new filename as SDS Documents (*sds).
Select the Instrument tab, click Start to begin the PCR run. Wait 30 seconds to 1 min for the initial
priming, then the run should start. The estimated run time will then appear on the screen.
After the PCR Run
1)
2)
3)
When the PCR run is complete, a small dialog box stating “The run completed successfully” will appear
on the screen. Click OK, this will close the box.
Click the Result tab and choose the Amplification Plot page. Display Data as Delta Rn vs Cycle, click
the square button in the upper left corner of the diagram of the 96-well plate (between the letter “A” and “1”)
to select all wells. The selected wells will be highlighted in grey.
Follow the procedures below to calculate the threshold cycle (Ct) for each well (See Figure 4):
(We highly recommend manually setting the Baseline and Threshold Value)
a) To define the Baseline, use the Linear View of the amplification plots. Double click on one of the axes
or select Tool Graph Settings. The window for Graph Settings will appear. For Post-Run
Settings, select Auto Scale for both the Y and X-Axes. Select Linear view for Y-Axis, then click OK.
With the linear plots, determine the cycle number at which the earliest amplification can be seen.
Select Analysis Analysis Settings. Set the Manual Baseline to start from cycle number 2 through
two cycle values before the earliest visible amplification, then click OK.
b) To define the Threshold Value, use the Log View of the amplification plots. Open the Graph Settings
window by double clicking one of the axes or by selecting Tool Graph Settings as above. In the
Post-Run Settings, select Log view for the Y-Axis, then click OK. With the log plots, place the
threshold line above the background signal but within the lower third of the linear phase of the
amplification plot. Then select Analysis Analyze.
Page 3 of 4
4. Technical Note
c)
Go to the Report page to display the values for Ct and the melting temperatures (Tm) for each well. To
export the result to an Excel spreadsheet, select File Export Results and save the file as Results
Export Files (*csv). This file format can be opened in the Microsoft Excel Program.
Page 4 of 4