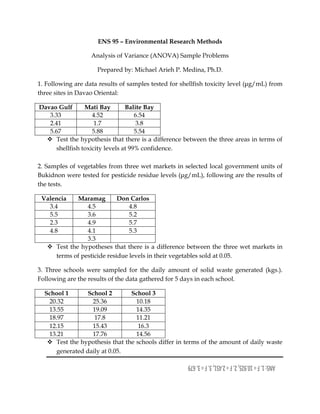
1. ENS 95 –
Analysis of Variance
Prepared by
1. Following are data results of samples tested for shellfish toxicity
three sites in Davao Oriental:
Davao Gulf Mati Bay
3.33 4.52
2.41 1.7
5.67 5.88
Test the hypothesis that there is a difference
shellfish toxicity levels
2. Samples of vegetables from t
Bukidnon were tested for pesticide residue levels (
the tests.
Valencia Maramag Don Carlos
3.4 4.5
5.5 3.6
2.3 4.9
4.8 4.1
3.3
Test the hypotheses that there is a difference between the three wet
terms of pesticide residue levels in their vegetables sold at 0.05.
3. Three schools were sampled for the
Following are the results of the data gathered for 5 days in each school.
School 1 School 2
20.32 25.36
13.55 19.09
18.97 17.8
12.15 15.43
13.21 17.76
Test the hypothesis that the schools
generated daily at 0.05.
– Environmental Research Methods
Analysis of Variance (ANOVA) Sample Problems
Prepared by: Michael Arieh P. Medina, Ph.D.
1. Following are data results of samples tested for shellfish toxicity level
Balite Bay
6.54
3.8
5.54
hypothesis that there is a difference between the three areas
at 99% confidence.
amples of vegetables from three wet markets in selected local government units of
Bukidnon were tested for pesticide residue levels (µg/mL), following are
Don Carlos
4.8
5.2
5.7
5.3
that there is a difference between the three wet
ticide residue levels in their vegetables sold at 0.05.
3. Three schools were sampled for the daily amount of solid waste generated
Following are the results of the data gathered for 5 days in each school.
School 3
10.18
14.35
11.21
16.3
14.56
Test the hypothesis that the schools differ in terms of the amount of daily waste
generated daily at 0.05.
level (µg/mL) from
between the three areas in terms of
ected local government units of
are the results of
that there is a difference between the three wet markets in
amount of solid waste generated (kgs.).
differ in terms of the amount of daily waste