1. Microsoft Corporation
Income Statements
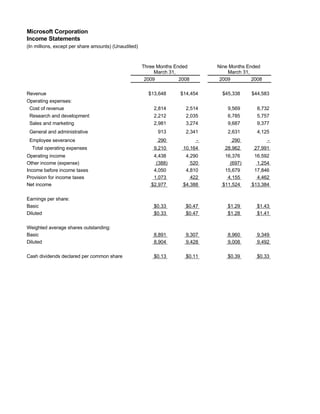
(In millions, except per share amounts) (Unaudited)
Three Months Ended Nine Months Ended
March 31, March 31,
2009 2008 2009 2008
Revenue $13,648 $14,454 $45,338 $44,583
Operating expenses:
Cost of revenue 2,814 2,514 9,569 8,732
Research and development 2,212 2,035 6,785 5,757
Sales and marketing 2,981 3,274 9,687 9,377
General and administrative 913 2,341 2,631 4,125
Employee severance 290 - 290 -
Total operating expenses 9,210 10,164 28,962 27,991
Operating income 4,438 4,290 16,376 16,592
Other income (expense) (388) 520 (697) 1,254
Income before income taxes 4,050 4,810 15,679 17,846
Provision for income taxes 1,073 422 4,155 4,462
Net income $2,977 $4,388 $11,524 $13,384
Earnings per share:
Basic $0.33 $0.47 $1.29 $1.43
Diluted $0.33 $0.47 $1.28 $1.41
Weighted average shares outstanding:
Basic 8,891 9,307 8,960 9,349
Diluted 8,904 9,428 9,008 9,492
Cash dividends declared per common share $0.13 $0.11 $0.39 $0.33
2. Microsoft Corporation
Balance Sheets
(In millions)
March 31, June 30,
2009 2008 (1)
(Unaudited)
Assets
Current assets:
Cash and cash equivalents $7,285 $10,339
Short-term investments (including securities pledged as
collateral of $1,445 and $2,491) 18,055 13,323
Total cash, cash equivalents, and short-term investments 25,340 23,662
Accounts receivable, net of allowance for doubtful accounts of $242 and $153 9,182 13,589
Inventories 657 985
Deferred income taxes 1,926 2,017
Other 3,619 2,989
Total current assets 40,724 43,242
Property and equipment, net of accumulated depreciation of $7,236 and $6,302 7,112 6,242
Equity and other investments 4,112 6,588
Goodwill 12,554 12,108
Intangible assets, net 1,756 1,973
Deferred income taxes 956 949
Other long-term assets 1,639 1,691
Total assets $68,853 $72,793
Liabilities and stockholders' equity
Current liabilities:
Accounts payable $3,017 $4,034
Short-term debt 1,999 -
Accrued compensation 2,644 2,934
Income taxes 773 3,248
Short-term unearned revenue 10,924 13,397
Securities lending payable 1,533 2,614
Other 2,933 3,659
Total current liabilities 23,823 29,886
Long-term unearned revenue 1,388 1,900
Other long-term liabilities 6,699 4,721
Commitments and contingencies
Stockholders' equity:
Common stock and paid-in capital - shares authorized 24,000;
outstanding 8,898 and 9,151 61,896 62,849
Retained deficit, including accumulated other comprehensive income
of $726 and $1,140 (24,953) (26,563)
Total stockholders' equity 36,943 36,286
Total liabilities and stockholders' equity $68,853 $72,793
Derived from audited financial statements
(1)
3. Microsoft Corporation
Cash Flows Statements
(In millions) (Unaudited)
Three Months Ended Nine Months Ended March
March 31, 31,
2009 2008 2009 2008
Operations
Net income $2,977 $4,388 $11,524 $13,384
Depreciation, amortization, and other noncash items 664 532 1,881 1,448
Stock-based compensation expense 432 373 1,292 1,066
Net recognized losses (gains) on investments and derivatives 507 (179) 682 (500)
Excess tax benefits from stock-based payment arrangements (2) (9) (48) (111)
Deferred income taxes (368) 103 462 783
Unearned revenue 5,899 5,228 16,054 15,044
Recognition of unearned revenue (6,670) (5,368) (19,078) (15,701)
Accounts receivable 1,697 1,857 4,035 2,077
Other current assets 106 (69) 345 141
Other long-term assets 26 (1) (159) (67)
Other current liabilities 114 1,389 (3,824) 525
Other long-term liabilities 662 (1,162) 2,030 (562)
Net cash from operations 6,044 7,082 15,196 17,527
Financing
Short-term borrowings (repayments), maturities of 90 days or less, net (329) - 1,667 -
Proceeds from new debt, maturities longer than 90 days 328 - 328 -
Common stock issued 112 268 436 3,249
Common stock repurchased (18) (1,240) (9,331) (8,227)
Common stock cash dividends (1,155) (1,023) (3,310) (2,995)
Excess tax benefits from stock-based payment arrangements 2 9 48 111
Net cash used in financing (1,060) (1,986) (10,162) (7,862)
Investing
Additions to property and equipment (632) (759) (2,252) (1,964)
Acquisition of companies, net of cash acquired - (138) (827) (5,967)
Purchases of investments (10,683) (3,481) (21,525) (15,795)
Maturities of investments 915 462 1,669 1,262
Sales of investments 3,327 2,829 16,102 18,645
Securities lending payable 1,064 309 (1,080) (265)
Net cash used in investing (6,009) (778) (7,913) (4,084)
Effect of exchange rates on cash and cash equivalents (36) 42 (175) 128
Net change in cash and cash equivalents (1,061) 4,360 (3,054) 5,709
Cash and cash equivalents, beginning of period 8,346 7,460 10,339 6,111
Cash and cash equivalents, end of period $7,285 $11,820 $7,285 $11,820
4. Microsoft Corporation
Segment Revenue and Operating Income (Loss)
(In millions) (Unaudited)
Three Months Ended Nine Months Ended
March 31, March 31,
2009 2008 2009 2008
Revenue
Client $3,404 $4,033 $11,604 $12,506
Server and Tools 3,467 3,238 10,616 9,381
Online Services Business 721 843 2,357 2,377
Microsoft Business Division 4,505 4,731 14,330 13,663
Entertainment and Devices Division 1,567 1,592 6,564 6,616
Unallocated and other (16) 17 (133) 40
Consolidated $13,648 $14,454 $45,338 $44,583
Operating Income (Loss)
Client $2,514 $3,115 $8,689 $9,855
Server and Tools 1,344 1,080 3,978 3,170
Online Services Business (575) (226) (1,521) (737)
Microsoft Business Division 2,877 3,127 9,325 9,010
Entertainment and Devices Division (31) 106 299 668
Corporate-level activity (1,691) (2,912) (4,394) (5,374)
Consolidated $4,438 $4,290 $16,376 $16,592