
Recommended
Recommended
More Related Content
Similar to The great british singing group, the bee gees, have the answer
Similar to The great british singing group, the bee gees, have the answer (20)
More from drstevenquay
More from drstevenquay (6)
Recently uploaded
Recently uploaded (20)
The great british singing group, the bee gees, have the answer
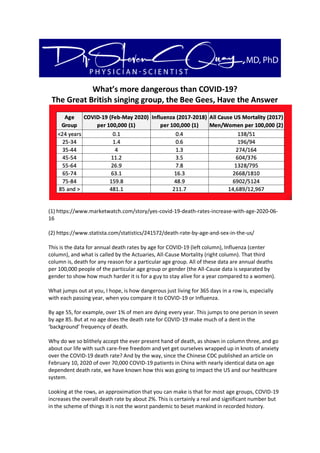
- 1. What’s more dangerous than COVID-19? The Great British singing group, the Bee Gees, Have the Answer (1) https://www.marketwatch.com/story/yes-covid-19-death-rates-increase-with-age-2020-06- 16 (2) https://www.statista.com/statistics/241572/death-rate-by-age-and-sex-in-the-us/ This is the data for annual death rates by age for COVID-19 (left column), Influenza (center column), and what is called by the Actuaries, All-Cause Mortality (right column). That third column is, death for any reason for a particular age group. All of these data are annual deaths per 100,000 people of the particular age group or gender (the All-Cause data is separated by gender to show how much harder it is for a guy to stay alive for a year compared to a women). What jumps out at you, I hope, is how dangerous just living for 365 days in a row is, especially with each passing year, when you compare it to COVID-19 or Influenza. By age 55, for example, over 1% of men are dying every year. This jumps to one person in seven by age 85. But at no age does the death rate for COVID-19 make much of a dent in the ‘background’ frequency of death. Why do we so blithely accept the ever present hand of death, as shown in column three, and go about our life with such care-free freedom and yet get ourselves wrapped up in knots of anxiety over the COVID-19 death rate? And by the way, since the Chinese CDC published an article on February 10, 2020 of over 70,000 COVID-19 patients in China with nearly identical data on age dependent death rate, we have known how this was going to impact the US and our healthcare system. Looking at the rows, an approximation that you can make is that for most age groups, COVID-19 increases the overall death rate by about 2%. This is certainly a real and significant number but in the scheme of things it is not the worst pandemic to beset mankind in recorded history.
- 2. So if you look at this data and wonder why you were scared before you understood this and the context of it, you can blame the academic, media, and government elites for not being clear and explaining what COVID-19 was and as importantly what it was not. In fact, you can learn why COVID-19 is only the 15th worst pandemic in history in a chapter of my book COVID-19 Survival Manual. More importantly, you can also learn practical tips to lower your own personal risk of getting COVID-19, fighting it if you get it, and Stayin’ Alive if it puts you in the hospital. Contact Us · Speaking Inquiries · Privacy Policy · Terms & Conditions · Sitemap Copyright 2020 © All Rights Reserved · Website Designed & Hosted by Matt Dragos at dragosmatt.com