Recommended

Recommended
More Related Content
Similar to Social Network Analysis as a tool evaluate quality improvement in healthcare
Similar to Social Network Analysis as a tool evaluate quality improvement in healthcare (20)
More from Daniel McLinden
More from Daniel McLinden (17)
Recently uploaded
Recently uploaded (20)
Social Network Analysis as a tool evaluate quality improvement in healthcare
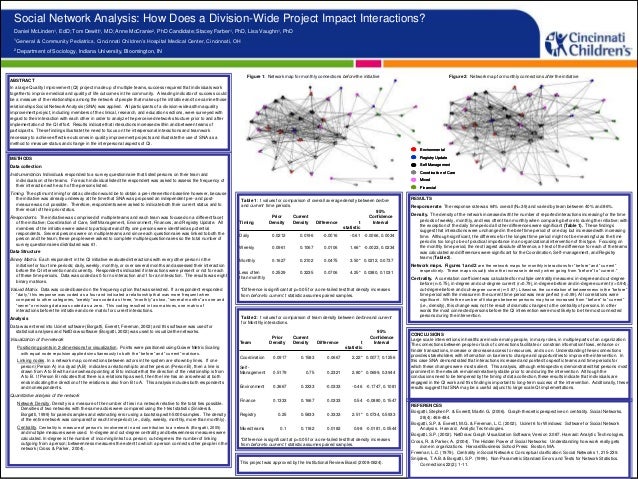
- 1. REFERENCES Borgatti, Stephen P. & Everett, Martin G. (2006). Graph-theoretic perspective on centrality. Social Networks. 28(4): 466-484. Borgatti, S.P. & Everett, M.G. & Freeman, L.C. (2002). Ucinet 6 for Windows: Software for Social Network Analysis. Harvard: Analytic Technologies. Borgatti, S.P. (2002). NetDraw: Graph Visualization Software, Version 2.087. Harvard: Analytic Technologies. Cross, R. & Parker, A. (2004). The Hidden Power of Social Networks: Understanding how work really gets done in organizations. Harvard Business School Press: Boston, MA. Freeman, L.C. (1979). Centrality in Social Networks: Conceptual clarification. Social Networks 1, 215-239. Snijders, T.A.B. & Borgatti, S.P. (1999). Non-Parametric Standard Errors and Tests for Network Statistics. Connections 22(2): 1-11. Social Network Analysis: How Does a Division-Wide Project Impact Interactions? Daniel McLinden1, EdD; Tom Dewitt1, MD; Anne McCranie2, PhD Candidate; Stacey Farber1, PhD, Lisa Vaughn1, PhD 1General & Community Pediatrics, Cincinnati Children’s Hospital Medical Center, Cincinnati, OH 2 Department of Sociology, Indiana University, Bloomington, IN ABSTRACT In a large Quality Improvement (QI) project made up of multiple teams, success required that individuals work together to improve medical and quality of life outcomes in the community. A leading indicator of success could be a measure of the relationships among the network of people that make up the initiative and to examine those relationships Social Network Analysis (SNA) was applied. All participants of a division-wide asthma quality improvement project, including members of the clinical, research, and education sections, were surveyed with regard to their interaction with each other in order to analyze the perceived network structure prior to and after implementation of the QI effort. Results indicate that interactions increased within and between teams of participants. These findings illustrate the need to focus on the interpersonal interactions and teamwork necessary to achieve effective outcomes in quality improvement projects and illustrate the use of SNA as a method to measure status and change in the interpersonal aspects of QI. METHODS Data collection Instrumentation. Individuals responded to a survey questionnaire that listed persons on their team and individuals on other teams. For each individual listed the respondent was asked to assess the frequency of their interaction with each of the persons listed. Timing. The optimum timing for data collection would be to obtain a pre-intervention baseline however, because the initiative was already underway at the time that SNA was proposed an independent pre- and post- measure was not possible. Therefore, respondents were asked to indicate both their current status and to their recall of their prior status. Respondents. The initiative was comprised of multiple teams and each team was focused on a different facet of the initiative; Coordination of Care, Self Management, Environment, Finances, and Registry Update. All members of the initiative were asked to participate and fifty one persons were identified as potential respondents. Several persons were on multiple teams and since each questionnaire was linked to both the person and the team, these people were asked to complete multiple questionnaires so the total number of survey questionnaires distributed was 61. Data Structure Binary Matrix. Each respondent in the QI initiative evaluated interactions with every other person in the initiative for four time periods; daily, weekly, monthly, or over several months and assessed their interaction before the QI intervention and currently. Respondents indicated if interactions were present or not for each of these time periods. Data was coded as 0 for no interaction and 1 for an interaction. The results was eight binary matrices. Valued Matrix. Data was coded based on the frequency option that was selected. If a respondent responded “daily,” this response was coded as a four and indicated a relationship that was more frequent when compared to other categories, “weekly” was coded as three, “monthly” as two, “several months” as one and “never” or missing data was coded as a zero. This coding resulted in two matrices, one matrix of interactions before the initiative and one matrix for current interactions. Analysis Data was entered into Ucinet software (Borgatti, Everett, Freeman, 2002) and this software was used for statistical analyses and NetDraw software (Borgatti, 2002) was used to visualize the networks. Visualization of the network Positioning points in 2-dimenisions for visualization. Points were positioned using Gower Metric Scaling with equal node repulsion applied simultaneously to both the “before” and “current” matrices. Linking nodes. In a network map, connections between actors in the system are shown by lines. If one person (Person A) in a dyad (A,B) indicates a relationship to another person (Person B), then a line is drawn from A to B with an arrowhead pointing at B to indicate that the direction of the relationship is from A to B. If Person B indicates that there is a relationship as well, then the line has an arrowhead at both ends indicating the direction of the relations is also from B to A. This analysis includes both respondents and nonrespondents. Quantitative analysis of the network Network Density. Density is a measure of the number of ties in a network relative to the total ties possible. Densities of two networks with the same actors were compared using the t-test statistic (Sniders & Borgatti, 1999) for paired samples and estimating error using a bootstrap with 5000 samples. The density of the entire network was compared for each time period (i.e., daily, weekly, monthly, more than monthly). Centrality. Centrality is measure of person’s involvement in and contribution to a network (Borgatti, 2005) and multiple measures were used. In-degree and out-degree centrality and betweenness measures were calculated. In-degree is the number of incoming links to a person; out-degree is the number of linking outgoing from a person; betweenness measures the extent to which a person connects other people in the network (Cross & Parker, 2004). RESULTS Response rate. The response rate was 64% overall (N=39) and varied by team between 40% and 86%. Density. The density of the network increased with the number of reported interactions increasing for the time periods of weekly, monthly, and less often than monthly when comparing before to during the initiative; with the exception of the daily time period all other differences were significant (Table 1). These findings suggest that interactions were unchanged in the brief time period of one day but increased with increasing time. Although significant, the difference for the longest time period might not be meaningful as the time period is too long to be of practical importance in an organizational intervention of this type. Focusing on the monthly time period, the next largest absolute difference, a t-test of the difference for each of the teams was calculated and differences were significant for the Coordination, Self-management, and Registry teams (Table 2). Network maps. Figures 1 and 2 are the network maps for monthly interactions for “before” and “current” respectively. These maps visually show the increase in density when going from “before” to “current.” Centrality. A correlation coefficient was calculated for multiple centrality measures: in-degree and out-degree before (r=0.75), in-degree and out-degree current (r=0.79), in-degree before and in-degree current (r=0.94), out-degree before and out-degree current (r=0.87). Likewise, the correlation of betweenness in the “before” time period with the measure in the current time period was near perfect (r=0.99). All correlations were significant. While the number of linkages between persons may have increased from “before” to “current” (i.e., density), this change was not the result of dramatic changes to the centrality of persons. In other words the most connected persons before the QI intervention were most likely to be the most connected persons during the intervention. Table 1: t values for comparison of overall average density between before and current time periods. *Difference is significant at p<0.05 for a one-tailed test that density increases from before to current. t statistic assumes paired samples. *Difference is significant at p<0.05 for a one-tailed test that density increases from before to current. t statistic assumes paired samples. Table 2: t values for comparison of team density between before and current for Monthly interactions. Figure 2: Network map for monthly connections after the initiative CONCLUSIONS Large scale interventions in healthcare involve many people, in many roles, in multiple parts of an organization. The connections between people or lack of connections facilitate or constrain information flows, enhance or hinder transactions, increase or decrease access to resources, and so on. Understanding these connections provides stakeholders with information on barriers to change and opportunities to improve the intervention. In this case SNA demonstrated that interactions increased and pointed to specific teams and time periods for which these changes were most salient. This analysis, although retrospective, demonstrated that persons most prominent in the network remained relatively stable prior to and during the intervention. Although the conclusions need to be tempered by the timing of data collection, these results indicate that individuals are engaged in the QI work and this finding is important to long-term success of the intervention. Additionally, these results suggest that SNA may be a useful adjunct to large scale QI implementations. Figure 1: Network map for monthly connections before the initiative Timing Prior Density Current Density Difference t statistic 95% Confidence Interval Daily 0.0212 0.0196 -0.0016 -0.61 -0.0066, 0.0034 Weekly 0.0961 0.1067 0.0106 1.66* -0.0023, 0.0234 Monthly 0.1627 0.2102 0.0475 3.50* 0.0212, 0.0737 Less often than monthly 0.2529 0.3235 0.0706 4.25* 0.0380, 0.1031 Team Prior Density Current Density Difference t statistic 95% Confidence Interval Coordination 0.0917 0.1583 0.0667 2.22* 0.0077, 0.1256 Self - Management 0.5179 0.75 0.2321 2.80* 0.0699, 0.3944 Environment 0.3667 0.3333 -0.0333 -0.46 -0.1747, 0.1081 Finance 0.1333 0.1667 0.0333 0.54 -0.0880, 0.1547 Registry 0.25 0.5833 0.3333 2.51* 0.0734, 0.5933 Mixed teams 0.1 0.1182 0.0182 0.98 -0.0181, 0.0544 This project was approved by the Institutional Review Board (2008-0624). Environmental Registry Update Self Management Coordination of Care Mixed Financial Environmental Environmental Registry Update Registry Update Self Management Self Management Coordination of Care Coordination of Care Mixed Mixed Financial Financial