
Recommended
Recommended
More Related Content
Similar to Introduction to Relational Frame Theory and its Applications
Similar to Introduction to Relational Frame Theory and its Applications (12)
More from deanmtaylor1545
More from deanmtaylor1545 (20)
Recently uploaded
Recently uploaded (20)
Introduction to Relational Frame Theory and its Applications
- 1. T H E B E H A V I O R A N A L Y S T T O D A Y V O L U M E 3 , I S S U E 4 , 2 0 0 3 AN INTRODUCTION TO RELATIONAL FRAME THEORY: BASICS AND APPLICATIONS John T. Blackledge University of Nevada, Reno Relational Frame Theory (RFT) has made a very respectable empirical and theoretical showing in the psychological literature during the past decade, but the theory still remains unknown or unappreciated by most cognitive and behavioral psychologists. This article highlights why this might be the case, and presents RFT in a simplified, systematic manner, in part by comparing it to a well-known cognitive model. Finally, the article outlines RFT’s relatively unique contributions to psychological accounts of language and cognition, and addresses some of RFT’s scientific and applied implications. Relational Frame Theory (RFT) has had a notable presence in the psychology literature since its development over a decade ago. Well over 30 empirical RFT studies have been published in peer-reviewed psychology journals in the past 10 years, and an even larger number of theoretical and descriptive treatments of it have been published as well. Recently, a book length treatment of RFT has been made
- 2. available (Hayes, Barnes-Holmes, & Roche, 2001), summarizing supporting data and extending RFT analyses to a variety of psychological phenomena. In addition, RFT principles form the theoretical background of Acceptance and Commitment Therapy (ACT; see, for example, Hayes, Strosahl, & Wilson, 1999). Given the relatively frequent appearances of Relational Frame Theory in psychological literature, it is perhaps surprising that the theory remains virtually unknown outside behavioral circles, and even unrecognized or misunderstood by many academic behavioral psychologists. RFT has largely escaped notice and comprehension for at least three reasons. First, RFT intentionally makes use of technical, non-colloquial language to allow a scientific treatment of cognition. As such, published descriptions of RFT are undeniably technical, and not readily accessible to those who have not spent a considerable amount of time trying to understand the theory. Second, its significance and relevance to human psychopathology and language in general do not immediately seem obvious due to its non- traditional account of these phenomena. Finally, non-behavioral psychologists have long assumed that behaviorism has little or nothing to offer to the understanding of human language and cognition. Theories of these fundamentally important human processes that arise from the behavioral tradition are thus easy to ignore.
- 3. The first purpose of this article is to convey the principles of Relational Frame Theory in relatively easy to understand fashion. In doing so, it is hoped that what RFT has to do with language, cognition, and psychopathology will become apparent. Since a vast amount of cognitive literature regarding these topic areas currently exists, RFT’s relatively unique and important contributions to this literature will be outlined as well. To accomplish these goals, a popular and widely-known cognitive model of a “fear network” (Lang, 1985) will first be presented and briefly described. Lang’s model contains some cosmetic similarities to RFT that will hopefully orient the reader to the analysis that follows. Following the description of this model, an RFT account of the same information presented in the model will be advanced, allowing a systematic introduction to the reader of the defining features of RFT. Finally, several reasons why RFT offers a unique and important approach to language, cognition, and human suffering will be described. Empirical evidence and more extensive arguments of technical points about RFT made throughout the article can be found, for example, in Hayes et al. (2001). RELATIONAL FRAME THEORY: BASICS AND APPLICATIONS Lang’s Fear Network Lang’s (1985) exemplary model of a fear network is presented succinctly in Figure 1. Stimulus propositions (indicated in ovals in
- 4. Figure 1) involve “information about prompting external stimuli and the context in which they occur,” and response propositions refer to 421 T hi s do cu m en t i s co py ri gh te d by th e A m
- 7. he p er so na l u se o f t he in di vi du al u se r a nd is n ot to b
- 8. e di ss em in at ed b ro ad ly . B L A C K L E D G E “information about responding in this context, including expressive verbal behavior, overt acts, and the visceral and somatic events that mediate arousal and actions” (p. 194). Meaning propositions (shown in rectangles) refer to “information that defines the meaning of the stimulus and response data” (p. 194). Lang maintains that the network of stimuli shown in the figure exists as a schema in long-term memory, and states that the entire network is activated when any component stimulus is encountered. The model indicates that simply walking in a wooded area and seeing quick movement out of the corner of one’s eyes, for
- 9. example, could be enough to accelerate one’s heart rate, feel afraid, and subsequently run away. The stimulus propositions provide the initial input, the implications of these stimuli are altered by the meaning propositions present in the network (e.g., seeing movement in a wooded area implies danger and other unpredictable consequences). Responses like an accelerated heart rate, saying “I’m afraid,” and running away are the almost inevitable outcome of the cognitive processing specified by the model. The components of the network can be learned through direct experience (e.g., by being bitten by a snake), through instruction (learning about what snakes are, where they live, and how dangerous they can be), and through modeling (watching others respond in fear to snakes, or hearing others describe how afraid they are of snakes). As stated earlier, only a few of the stimuli specified in the model need be present for the entire network to be activated. Snake Dangerous Quickly Wooded Area I Heart Alone
- 10. Away “I’m afraid” In Is Feel Run Am Accelerated See Moves Is Say Fear Not Predictable Figure 1. A modified version of Lang’s (1984) fear network. Stimulus propositions are designated in ovals, meaning propositions in rectangles, and response propositions by ovals connected with double lines. An RFT Account of Lang’s Model
- 11. Three observations about Lang’s model will help prepare the reader for the discussion of RFT that follows. First, note that the schema in Figure 1 includes examples of thoughts, emotions, physiological sensations, and overt behaviors. As with Lang’s model, RFT incorporates all these classes of stimuli. Second, note that the figure specifies a number of explicit and implicit relationships between its component stimuli. For example, the feeling of “fear” and the thought “I’m afraid” can be considered as causes for “running away,” a “snake” is considered equivalent to “danger” and “unpredictability,” and both the “snake” and “Me” are in a “wooded area.” In these examples, then, we can say that there are causal relationships between stimuli (such that the thought and feeling of fear are viewed as causes 422 T hi s do cu m en t i s
- 14. is in te nd ed s ol el y fo r t he p er so na l u se o f t he in di vi
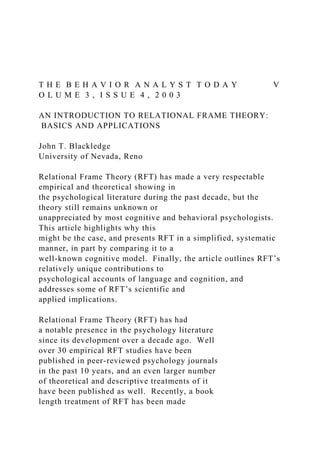
- 16. T H E B E H A V I O R A N A L Y S T T O D A Y V O L U M E 3 , I S S U E 4 , 2 0 0 3 for running), relationships of coordination or rough equivalence between stimuli (such that a “snake” is considered to be roughly the same thing as “danger,” for example), and hierarchical relationships between stimuli (where a “snake” is considered to be part of something larger—in this case, a “wooded area”). Third, notice that the different stimuli pictured in Figure 1 share some of the functions of the other stimuli in the network by virtue of their association. For example, being in a wooded area might lead to the same fear, accelerated heart rate, running away that seeing a snake slither toward me would. The wooded area thus can be said to serve some of the same functions as a snake simply because I know that snakes can be found in wooded areas. Similarly, quick movement in the underbrush seen peripherally might also have some of the same stimulus functions that actually seeing a snake would provide. The notion of relationships between stimuli is one of the critical hallmarks of Relational Frame Theory. Look at the RFT version of Lang’s fear network pictured in Figure 2. As a starting point, notice that this relational frame specifies that a hierarchical relationship exists between “I/me” and “wooded area,” such that “I” am in a “wooded area” (and the wooded area correspondingly contains me). A similar relationship exists between “snake”
- 17. and “wooded area.” Note also that “snake” is related coordinately (i.e., as roughly equivalent) to “danger,” “not predictable,” and “quick movement,” and that these three stimuli are further related coordinately to “fear.” The presence of any one of these five stimuli, in this context, could thus ‘carry’ some important stimulus functions of the other stimuli by virtue of this relationship of coordination. Further, as many people do, “I” frame the experience of “fear” and thoughts like “I’m afraid” as causes for things like “running away.” Finally, “fear” is framed in coordination with an “accelerated heart rate,” being “alone,” and thinking things like “I’m afraid.” Any one of these stimuli, if experienced, could thus deliver some stimulus functions of their coordinated stimuli. For example, an accelerated heart rate could lead me to think that I am afraid, with a feeling of fear occurring simultaneously. Basically, then, the specified relationships between stimuli provide “me” with more information about those stimuli, and actually result in changing the stimulus functions of the stimuli involved. 423 T hi s do cu
- 22. ad ly . B L A C K L E D G E Snake I/Me Danger Not Predictable Quick Movement Fear Alone Accelerated Heart Rate Run Away Think “I’m afraid”
- 23. Contains (Hierarchical relation) Contains (Hierarchical relation) Coordination Coordination Coordination Coordination Causation Causation Wooded Area Figure 2. An RFT adaptation of Lang’s (1985) fear network. Relational Responding In behavioral circles, it is very common to talk about discriminating (i.e., detecting and responding to) specific stimuli. The RFT principle of relational responding refers to the process of discriminating relationships between stimuli such as those designated in Figure 2. The idea of discriminating relationships between stimuli is important, in part, because it allows more information to be gleaned from sets of stimuli than discrimination of each individual member of the set would allow. For example, being able to discriminate a wooded area, and
- 24. being able to discriminate a snake, tells me nothing about the relationship between snakes and wooded areas. If I also knew that snakes are often in wooded areas because a friend told me, I would then know to be more careful when walking in the woods even if I had never once encountered a snake in the woods (and thus never had the opportunity for wooded areas to become classically conditioned to snakes). If I was also told that “snakes are dangerous, unpredictable, and move quickly,” and I already knew that dangerous unpredictability and sudden movement were things to be justifiably afraid of, I would then know to be afraid of snakes even if I had never encountered one before. Knowing the relationships between wooded areas teeming with dangerous snakes that are a deadly threat to me by virtue of the fear they engender when I think about them could also engender other, even more complex behavior. For example, if I knew I was going on a camping trip to the woods, the relational frame depicted in Figure 2 might also cause me to pack a snake bite kit and wear tall leather boots, and to make sure my tent flap is tightly zipped at all times, all to avoid problems from a creature I have never even seen. While there are some obvious benefits to the ability to relate information like this, it is 424 T hi s
- 29. b ro ad ly . T H E B E H A V I O R A N A L Y S T T O D A Y V O L U M E 3 , I S S U E 4 , 2 0 0 3 also clearly obvious that this process can get out of control and lead to psychological problems like the snake phobia pictured in Figure 2. It is possible that the stimuli shown in Figure 2 could all easily have come to be “related” according to standard behavioral principles like respondent conditioning, operant conditioning, and stimulus generalization. However, it should be remembered that traditional behavioral accounts of respondents and operants (with the exception of stimulus generalization) exclusively involve direct contingencies that have actually been encountered at some point(s) in one’s learning history. The principle of stimulus generalization requires that I have a history with respect to stimuli that are formally similar to the object of the generalization. Formal properties of stimuli are those properties that can be seen, heard, smelled, touched, or tasted. Assuming that I have never seen a snake, and did not regularly look at pictures of snakes while I learned second
- 30. hand all the things about snakes designated in Figure 2, stimulus generalization could similarly not be responsible for my snake phobia. Carefully controlled empirical studies on RFT have consistently demonstrated that relational responses like the ones shown in Figure 2 can and do occur in manner consistent with RFT principles and inconsistent with direct contingency respondent, operant, and generalization processes (see Hayes et al., 2001, for a review of these studies and an elaboration on this argument). Derived Relational Responding The empirically demonstrated fact that specific types of relational responding occur even in specific situations where they have not been directly taught requires that such instances be referred to as derived relational responding. Derived relational responding involves the ability to relate stimuli in a variety of ways even though one has never been reinforced (i.e., directly trained) for relating those stimuli in those specific ways. Look at the relationships between “fear,” “danger,” “not predictable,” “quick movement,” and “snake” in Figure 2, for example. Assume that no one has ever directly told me that I should be afraid of snakes, or reinforced my fear in the presence of a snake. Assume also that I learned from someone that snakes can be dangerous, unpredictable, and often move quickly, and that I had learned previously that danger, unpredictability, and quick movement were fearsome events. Even
- 31. though no one had ever told me that I should be afraid of snakes, I would then know that they are indeed something to be afraid of. Note that these exact relationships between these stimuli are specified in the model. “Snake” is related coordinately with “danger,” “not predictable” and “quick movement,” and these last three stimuli are coordinately related to “fear.” A connection between “fear” and “snake” has thus never been directly learned. Rather, the relationship between “fear” and “snake” has been derived. There are two specific types of derived relational responding, and both are given technical names so that they can be used with precision. The first type of derived relational responding is called mutual entailment. Mutual entailment simply means that if stimulus A is related in a specific way to stimulus B, then B is related in a complementary way to A. Look at the bottom two rectangles in Figure 2. If I have been taught that the cognition “I’m afraid” is a cause for “running away,” I would be able to derive that “running away” is an effect of thinking “I’m afraid.” Similarly, if I have been taught that “wooded areas” contain “snakes,” I would be able to derive that snakes are contained in wooded areas. As a final example, if I know that “snakes” “move quickly,” I am able to derive that “quick movement” (in certain contexts) is indicative of “snakes.” Such simple derivations may appear so obvious to the reader that they seem not to warrant any attention. To those first learning language, however, mutual entailment is anything but simple. A study by
- 32. Lipkens, Hayes, & Hayes (1993) provided evidence that very young children (about 1 ½ years) do not derive mutually entailed relations. Also, a study currently under way with autistic children (Blackledge, Blackledge, Cummings, & Hayes, in progress) has indicated that autistic children must be directly trained to mutually entail relations before they can do so with spontaneity. Additionally, with the possible exception of a single sea lion (Schusterman & Kastak, 1998), no non-human animal has ever demonstrated mutual entailment when relating stimuli on non-formal dimensions. Deriving mutually entailed relations seems simple to us 425 T hi s do cu m en t i s co py ri gh
- 35. ed s ol el y fo r t he p er so na l u se o f t he in di vi du al u se
- 36. r a nd is n ot to b e di ss em in at ed b ro ad ly . B L A C K L E D G E because we have been doing it extensively for almost our entire lives.
- 37. The second type of derived relational responding is called combinatorial entailment. To understand this principle, the relationship between at least three stimuli must be considered. Look again at Figure 2, and consider again the relation it describes between “fear” and “snake.” Mutual entailment is demonstrated in the reciprocal relationships that exist between “fear” and “danger,” “not predictable,” and “quick movement,” and also in the reciprocal relationships between “snake” and “danger,” “not predictable,” and “quick movement.” “Fear” and “snake” have never been directly related to one another in the figure, and thus any relations between them cannot be accounted for by the process of mutual entailment. The relationship between “fear” and “snake” requires that the relationship between “fear” and the three intermediary stimuli shown in Figure 2, and the relationship between those three intermediary stimuli and “snake,” be combined to form a small network of interrelated stimuli. Thus, the derived relationship between “snake” and “fear” in this case is called combinatorial entailment. Combinatorial entailment refers to the reciprocal relationships that exist between two stimuli by virtue of how those stimuli are related to other, intermediary stimuli. Combinatorially entailed relations, by definition, occur between two stimuli that have not been directly related to one another. In this example, the nature of the reciprocal relations between the combinatorially entailed stimuli “fear” and “snake” are rather simple, because only relationships of coordination exist between all elements of their
- 38. five-stimulus network. Thus, “snake” is combinatorially coordinated with “fear” just as “fear” is combinatorially coordinated with “snake”. Figure 2 provides other examples that better illustrate the reciprocal nature of combinatorially entailed relations. Look at the relationship between “I/Me,” “Wooded area,” and “Snake,” for example, and suppose that I am currently standing in a wooded area. The figure specifies that there is no direct relationship between “me” and the “snake” by virtue of the fact that ‘”I/Me” and “Snake” are not directly connected to one another. Given this information alone, I would not be able to know that there may be a snake somewhere around me. But since both stimuli are related to “Wooded area,” I am able to derive a combinatorial relation between them. In this case, I know that snakes are contained in wooded areas, and I also know that I am currently contained in a wooded area. When I combine these two relations, I derive that there is a snake somewhere in the wooded area I am now in. A different example will more clearly describe the reciprocal nature of combinatorial entailment. Look at the relationships between “accelerated heart rate,” “fear,” and “run away” in Figure 2. “Accelerated heart rate” is related coordinately to “fear,” and “fear” stands in a causal relation with “run away.” No direct relation is specified between “accelerated heart
- 39. rate” and “run away, but combinatorial entailment tells us that a causal relationship between “accelerated heart rate” and “run away” may be derived because increased heart rate is coordinated with fear, and fear is framed as a cause for running away. Thus, I may “run away” in a wooded area after I notice my “accelerated heart rate,” perhaps even before I actually interpret that physical sensation as being indicative of fear. The combinatorially entailed causal relationship between “accelerated heart rate” and “run away” is reciprocal in nature. “Running away” is an effect of “accelerated heart rate,” which is a cause of “running away”. The reciprocal nature of the relationship is further circumscribed by the context designated by Figure 2, such that “accelerated heart rate” is not framed as an effect of “running away” from a dangerous and feared situation, but rather part of the cause. Of course, once out of the wooded area, a new context would likely support framing “accelerated heart rate” as a direct effect of “running.” As with mutual entailment, empirical evidence indicates that combinatorial entailment does not occur automatically when learning language, but rather develops as a function of learning language (Blackledge et al., in progress; Lipkens et al., 1993). Coordination: A Common Relation Before continuing to describe the primary features of RFT, a brief digression is 426
- 43. na l u se o f t he in di vi du al u se r a nd is n ot to b e di ss em
- 44. in at ed b ro ad ly . T H E B E H A V I O R A N A L Y S T T O D A Y V O L U M E 3 , I S S U E 4 , 2 0 0 3 warranted to explain a specific type of relation that is often confusing to readers (perhaps because of its unusual name). Probably the most basic and widespread relational response occurring to stimuli involves coordinative relations. If two stimuli are related coordinately, then that means that they are the same or nearly the same. The term coordination is used because it accounts both for things that are identical to one another, and things that are similar in many respects. As with perhaps every relational response, young children first learn how to coordinately relate stimuli based on formal stimulus properties. For example, a child first learning language may quickly learn that ‘this Coke’ is the same as ‘that Coke,’ or that ‘this hot dog’ is the same as the hot dog she ate last week. With a little more practice, she learns that in an
- 45. important sense, the spoken word “Coke” is the same as actual Coke, and that the written word “Coke” is roughly the same as actual Coke and the spoken word Coke. Here is an example of how this might occur. Suppose a child who has learned that the spoken word “Coke” refers to actual Coke is told that Pepsi is the same as Coke, and that she will receive a glass of Pepsi if she puts away her toys. Even though the child has never tasted or seen Pepsi, relating it coordinately with Coke may make pertinent stimulus functions of actual Coke (e.g., its taste and refreshing quality) psychologically present. Given that the child enjoys Coke and will do almost anything to get some, framing it coordinately to Pepsi leads the child to put away her toys. Even though the stimulus properties of Pepsi have never been directly contacted, framing it coordinately with a familiar stimulus allows the child to ‘understand’ what Pepsi is. Transformation of Stimulus Functions This discussion alludes to another defining characteristic of RFT that has now been alluded to several times. Making relational responses between stimuli results in transformation of stimulus functions for all of the stimuli involved. Said more simply, when two stimuli are related, some of the functions of each stimulus change according to what stimulus it is related to, and how it is related to that stimulus. Suppose mom is drinking a 7-Up, and the increasingly verbally sophisticated child (expecting it to be good because she usually likes what mom is drinking) asks for a drink.
- 46. Unfortunately, mom doesn’t want to share her last 7-Up, so she says, “7-Up is bad. RC is better. RC is just like Coke. Wouldn’t you rather have some RC?” The child has never had 7-Up or RC, but the comparative and coordinative relations the mother specified between them and Coke transform the previously neutral stimulus functions of 7-Up and RC. RC now becomes “good” because it’s the “same” as Coke, and 7-Up becomes “bad” because it’s worse than Coke. The child would now be expected to want RC rather than 7-Up, and evaluate the former as “good’ and the latter as “bad”, even though she had never tried either one. Refer again to Figure 2. Suppose the same girl, later in life, is told that “These woods contain snakes.” She has had enough experience with snakes, either directly or indirectly, to know that she is afraid of them, although she has never encountered one in the woods. Prior to being told that wooded areas contain snakes, she liked playing in the woods, and found the woods to be very pleasant. The hierarchical relationship just established between wooded areas and snakes, however, results in a transformation of the wooded area’s functions. Where before, the woods were “beautiful,” “relaxing,” and “fun,” they are now “dangerous,” “unpredictable,” and an object of “fear” by virtue of their relationship to snakes and the events and experiences she usually frames in coordination to snakes.
- 47. With a vast amount of training, using multiple relations across many, many stimuli, words come to share the functions of a wide variety of experiences and events. At first, this occurs through direct training, and along formal stimulus dimensions. After repeated experiences of doing so across multiple exemplars, we learn to bring relational responding to bear on non-formal, or arbitrary, relations between stimuli. Once we do so, our verbally constructed worlds become increasingly complex as we derive more and more relations between virtually every stimulus we discriminate. To conduct a thought experiment that illustrates the degree to which we can relate any two stimuli, try the following: Randomly pick any two nouns (and make an effort to pick two apparently unrelated nouns), and ask yourself, “How is X like Y?” You might end up 427 T hi s do cu m en t i s co
- 50. in te nd ed s ol el y fo r t he p er so na l u se o f t he in di vi du
- 52. B L A C K L E D G E with a question like “How is a dog like a hat?” It is most likely that you have never been directly taught how a dog is like a hat. In short order, however, you could come up with several derived relational responses (they would be derived if you had never been directly taught to relate dogs and hats before). For example, you might quickly decide that both dogs and hats are “always there when you need them,” “both keep you warm,” are “both a regular part of your day,” and are both “a little dirty.” As a result of this specific question, you might now be a little more fond of your hat, be more likely to think of your dog when you go to put your hat on, and be more likely to wash it. By simply relating your hat coordinately to your dog, you have actually transformed the stimulus functions of the hat. You have done so, in part, by deriving relationships between your hat and stimuli that previously were only framed coordinately to your dog. In fact, by comparing your dog to your hat for the first time, you have brought aspects of an entire network of stimulus relations regarding your dog into a frame of coordination with the network of stimulus relations about your hat. Arbitrarily Applicable Derived Relational Responding It is not just the ability to derive relational responses between stimuli that is the hallmark of RFT, but rather the ability to do so using arbitrary (or non-formal) properties of
- 53. stimuli. An animal such as a seal can be taught, for example, to always pick the physically larger object when directed to “pick the bigger one,” even when presented with objects of varying size that it has never seen before. Derived relational responding can thus occur in response to formal stimulus dimensions such as size in organisms that don’t ‘speak a language’ in the colloquial sense. The same seal would not be able to correctly respond, however, to the directive “pick the bigger one” when presented with the President of the United States, a retail clerk, and a hobo. The seal would pick the physically largest of the three men, but a highly verbal person would likely discriminate that “bigger,” in this context, refers to the importance of the man, not his physical size. Importance is not a formal stimulus property that can be directly seen, tasted, smelled, touched, or tasted, but is rather a stimulus property that has been given arbitrary significance by the socio-verbal community. Given its arbitrary (or non-formal) nature, a seal could not discriminate the relational dimension of importance. A somewhat verbally sophisticated person, however, would pick the President given the directive, “pick the bigger one.” Thus, the essence of RFT is arbitrarily applicable derived relational responding that is non-arbitrarily applied. The term appears difficult and is definitely technical, but most of the components of the term have already been described. Relational responding refers to the ability to respond to relations between stimuli
- 54. rather than just responding to each stimulus separately. Relations between stimuli can be derived (from the processes of mutual and combinatorial entailment), meaning that relations between stimuli need not be directly learned. And the process of derived relational responding can occur with respect to arbitrary (as opposed to just formal) stimulus properties. The process of arbitrarily applicable derived relational responding results in the transformation of stimulus functions of the stimuli that are correspondingly related (such that the specific relations between the stimuli, and the broader context they are encountered in, determine precisely how the stimulus functions of each stimulus are transformed). Finally, arbitrarily applicable derived relational responding is said to be non-arbitrarily applied, meaning that the socio-verbal community only reinforces relational responses to certain arbitrary stimulus properties in given contexts, but not others. For example, the socio-verbal community would support the arbitrarily applicable derived relational response that one driver is smarter than a second driver, but would not support the response that the first car is smarter than the second car. The second relational response just doesn’t ‘make sense,’ but the first one does. When a relational response does ‘make sense,’ it usually means that it has been non-arbitrarily applied—that the language community ‘approves’ of that way of relating specific things. The Operant Nature of RFT’s Component Processes
- 55. All the examples provided in this section point to a key feature of derived relational responding. Such responding is 428 T hi s do cu m en t i s co py ri gh te d by th e A m
- 58. he p er so na l u se o f t he in di vi du al u se r a nd is n ot to b
- 59. e di ss em in at ed b ro ad ly . T H E B E H A V I O R A N A L Y S T T O D A Y V O L U M E 3 , I S S U E 4 , 2 0 0 3 actually operant behavior. That is, RFT specifies that language-able organisms learn to respond to specific relations between stimuli through differential reinforcement much as they are shaped to respond to individual stimuli in specific ways. After an extensive history of reinforcement for relating a variety of stimuli in a variety of different ways, it then becomes possible to relate other, novel stimuli in a variety of ways even though relating those specific stimuli in those specific ways has never been directly taught.
- 60. The process begins when relationships between stimuli along formal dimensions are taught. For instance, comparative relations between stimuli might be initially taught along a formal dimension of size. Over a period of time, a very young child might be reinforced for bringing the physically larger ball (but not a smaller ball) when asked to bring the “big ball,” for referring to his physically larger, older sister as his “big sister” (rather than his little sister), and referring to his toy car as his “little car,” as opposed to the “big car” that dad drives. After using the comparative relation of big—little numerous times across numerous formally related stimuli, he is then taught to comparatively relate stimuli according to non- formal properties. He might then be able to refer to his friend Tim’s older sister as “Tim’s big sister” even though Tim is physically larger than his sister. The temporal relation of older— younger between Tim and his sister is based on arbitrary properties of the stimuli (Tim and his sister) because the passage of time is not a stimulus that can be tasted, touched, smelled, heard, or seen, and is thus not a formal stimulus property. In fact, all of the four cornerstones of RFT are considered to arise according to operant processes. Responding to relations between stimuli rather than simply to separate stimuli might be one of the first pieces learned by verbal children. Learning to mutually entail relations between stimuli (i.e., derive a reciprocal relationship given a directly trained relationship) is likely also directly shaped through differential
- 61. reinforcement, as is combinatorial entailment. Transformation of stimulus functions is also likely an operant process. People learning language are essentially reinforced for responding to specific verbal stimuli as though they had the stimulus functions of other, related stimuli. The operant process of transformation of function is shaped along with the processes of relational responding, mutual entailment, and combinatorial entailment, until all four processes come under increasingly complex and specific contextual control. Even though language may not usually be explicitly taught and thought about in relational terms, it has been argued elsewhere that empirical data and subsequent theoretical implications indicate that thinking about language in this way has important consequences for predicting human behavior and changing it for the better (see, for example, Hayes et al., 2001; see also Hayes et al., 1999). Language defined as arbitrarily derived relational responding has important practical implications for clinical psychologists, and even psychologists from other sub-disciplines (see, for example, Hayes et al., 2001). Relational Framing as Process, Not Structure Relational framing is a short-hand term for the process of arbitrarily applicable derived relational responding that is non-arbitrarily applied. The term relational frame is often used instead of relational framing because the former
- 62. term is less awkward to use, and because it is sometimes useful to ‘freeze frame’ the process of relational framing (as has been done with the relational frame in Figure 2) so that it can be more easily analyzed and talked about. Referring to relational framing as relational frames and using the kind of images shown in Figure 2 may likely give the impression that relational frames exist, somewhere, as static structures. In fact, the act of relational framing is thought of as a process, an ongoing way of responding to stimuli as they are presented. People frame events relationally in the moment as an active process that is a function of their extensive learning history and stimulation in the present environment. “Storage” of these frames as structures is not implied and not required. The processes of mutual entailment, combinatorial entailment, and transformation of stimulus function can be directly observed (and has been in over 30 empirical studies) without any inference required. The ongoing process of relational framing can be directly observed outside the laboratory as well, albeit with an 429 T hi s do cu m
- 67. ly . B L A C K L E D G E inevitable sacrifice in reliability due to lack of experimental control. 4. RFT allows study of human language to be conducted with great precision, in accordance with the carefully specified definitions of its component processes. Why RFT is Important: Theoretical Merits and Applications 5. RFT has broad scope. Theoretical extrapolations of the theory have given plausible explanations of a wide variety of human behavior (see, for example, Hayes et al., 2001, and Hayes et al., 1999, for detailed RFT accounts of psychopathology). RFT accounts exist, for example, for spirituality (Barnes-Holmes, Hayes, & Gregg, 2001), values (Hayes et al., 1999), and rule-governed behavior (Hayes & Hayes, 1989; Hayes et al., 2001). Given that a vast empirical cognitive literature on language, cognition, and the role they play in psychopathology already exists, readers subscribing to cognitive theory may rightfully ask why a new theory of these
- 68. phenomena is necessary. Similarly, given existing and long-standing behavioral accounts of verbal behavior (i.e., Sidman, 1994; Skinner, 1957), behaviorally-oriented readers may also question the necessity of yet another account. In this section, a brief outline of why an RFT account of language is an important addition to the psychological literature will be introduced. Some of the points made here are self- explanatory and thus require no elaboration. Elaboration of a few points is beyond the scope of this article, and the reader is thus referred elsewhere for evidence of the claim. The final point will be briefly elaborated to illustrate the utility of RFT in the stated domains. 6. RFT has depth, meaning that it allows analysis of varying degrees of complexity of its subject matter (language-based phenomena). For example, Hayes (1994) and Hayes et al. (1999), among others, have presented detailed cases regarding how RFT processes may be at the heart of human suffering in general. In addition, they play a role in more specific cases of human suffering such as anxiety (Friman, Hayes, & Wilson, 1998), sexual abuse (Pistorello, Follette, & Hayes, 2000), and trauma (Walser & Hayes, 1998) 1. RFT is parsimonious, requiring only the concepts of relational responding, mutual entailment, combinatorial entailment, and transformation of
- 69. function to explain the process of arbitrarily applicable derived relational responding that is non-arbitrarily applied (the RFT definition for the colloquial term language). 7. RFT does not require the use of mentalistic terms or structures. It avoids problematic behavior-behavior relations (see, for example, Hayes & Brownstein, 1986). It properly casts verbal behavior as a dependant variable rather than an independent variable. That is, the theory does not violate the observation that thoughts cannot serve as independent variables by virtue of the fact that they cannot be directly manipulated (changes in the environment supporting different thoughts must first occur). This means that RFT specifies the kinds of environmental operations that must occur before changes in thinking and overt behavior will result. 2. RFT processes are directly observable, especially under laboratory conditions. Thus, no tenuous inferences about the existence of directly unobservable structures or processes are required. 3. RFT is firmly based on empirical research that has without exception supported its tenets. In addition to the over 30 published empirical treatments of RFT, the theory also accounts for the
- 70. data observed in hundreds of empirical studies on the concept of stimulus equivalence that have been published since 1971. 430 T hi s do cu m en t i s co py ri gh te d by th e A m
- 73. he p er so na l u se o f t he in di vi du al u se r a nd is n ot to b
- 74. e di ss em in at ed b ro ad ly . T H E B E H A V I O R A N A L Y S T T O D A Y V O L U M E 3 , I S S U E 4 , 2 0 0 3 8. RFT accounts for 30 years of empirical stimulus equivalence findings, and 10 years of empirical RFT findings, that Skinner’s (1957) treatment of language clearly cannot predict or explain. In addition, RFT does so in a manner requiring only that the principle of operant responding be expanded to include the concepts of relational responding, derived responding, and relational responding to arbitrary stimulus dimensions (Hayes et al., 2001
- 75. have presented detailed accounts of how these concepts have ample precedents in the behavioral literature). 9. RFT has direct clinical implications that are not apparent in other psychological models of human psychopathology. As an example of this final point, consider the cognitive defusion techniques designed to disrupt the context of literality in Acceptance and Commitment Therapy (Hayes et al., 1999). The context of literality refers to the ongoing support, in the form of differential reinforcement provided by the socio-verbal community, for transformations of stimulus functions occurring during arbitrarily applicable derived relational responding. In a non- technical sense, this context supports the “literal belief in one’s thoughts” that active responding to transformed stimulus functions entails. The stimuli in the interrelated set of relational responding shown in Figure 2 can take on harmful stimulus functions by virtue of the stimulus transformations mediated by these relational responses. It follows logically, then, that disrupting this context of literality might be a useful way to treat the designated phobia. If treatment is structured such that the context supporting transformations of function within these relational responses (i.e., the “literal belief”) is undermined, then the transformations of function in the pictured relationships would be expected to attenuate or fall away during these periods of disruption. Teaching the client
- 76. to create similar contextual conditions outside of the therapy session could be expected to allow repetition of this contextual disruption. For example, I might no longer run away when I feel fear in a wooded area if the causal relationship between fear and running away is disrupted. I might still have the thought that I ‘should’ run away, and definitely feel like doing so, but disruption of the context of literality will have shown me that such relationships between stimuli are ‘just talk’ rather than prescribed realities. Acceptance & Commitment Therapy (e.g., Hayes et al., 1999) is an example of an explicitly RFT-based treatment that essentially involves systematic efforts to dissolve the context of literality in problematic domains of clients’ lives. Other interventions are suggested by RFT, although they have not yet been developed and implemented. For example, some recent empirical RFT literature suggests that direct attempts to challenge cognitions (i.e., restructure existing relations between stimuli) may be ineffective or counterproductive (Pilgrim & Galizio, 1995; Wilson, 1998; Wilson & Hayes, 1996). Hayes et al. (2001) have suggested that adding more ‘constructive’ relations to problematic relational networks might thus be more effective than trying to eliminate existing relations. For example, Clayton (1995) found that employees who had remarked how chaotic their workplace was reacted more favorably when chaotic workplaces were framed as being more conducive to creativity. Those workers
- 77. who were subjected to challenges of their appraisal of the workplace as chaotic did not develop more favorable attitudes toward the workplace. Another example of an intervention analyzed from an RFT perspective is presented in Blackledge & Hayes (in preparation). Briefly, that manuscript suggests that interpersonally focused brief psychodynamic treatments (e.g., Levenson, 1995) are in part effective because they make use of client relational frames newly emerging around the client-therapist relationship to effect change, rather than involving direct challenges of the presumably entrenched ways the client frames pre-existing relationships. Thus, the “corrective emotional experience” (Levenson, p. 42) referred to in such treatments may involve first, an in-vivo shaping of a more adaptive way of framing interpersonal interactions, and second, allowing the client to spontaneously bring this idiosyncratic frame to bear on other relationships once its components exist at sufficient operant strength. 431 T hi s do cu m en t i
- 80. le is in te nd ed s ol el y fo r t he p er so na l u se o f t he in di
- 82. B L A C K L E D G E Clayton, T. M. (1995). Changing organizational culture through relational framing. Master’s thesis available from the library of the University of Nevada, Reno. CONCLUSION It is hoped that this treatment of Relational Frame Theory has not only made the theory itself more readily understood, but also that the reader now has a basic understanding of why the theory has important scientific and applied implications. It is openly acknowledged that even this treatment of RFT is perhaps unnecessarily complex. RFT essentially involves a very small and simple set of processes, but uses some complicated terminology to describe them. In addition, the processes themselves can seem foreign and even irrelevant to language because they (at first and even second glance) may not seem to match up well with the way we have been taught to think and talk about language. If we are to move beyond gross metaphorical analyses of language (where, for example, the brain is considered to be like a computer) to more precise technical accounts, however, we will have to abandon common sense for a sense that it a little less common (see, for example, Gentner & Jeziorski, 1993, for an account of the place of metaphor in science). Relational Frame Theory is an attempt
- 83. to do just that. The extent to which it may correspondingly succeed in enhancing our ability to predict human behavior and change it for the better depends both on empirical data, and the degree to which the theory is utilized by the psychological community. Friman, P. C., Hayes, S. C., and Wilson, K. G. (1998). Why behavior analysts should study emotion: The example of anxiety. Journal of Applied Behavior Analysis, 31, 137-156. Gentner, D., & Jeziorski, M. (1993). The shift from metaphor to analogy in Western science. In A. Ortony (Ed.), Metaphor and thought, second edition (pp. 447-480). New York: Cambridge University Press. Hayes, S. C. (1994). Content, context, and the types of psychological acceptance. In S. Hayes, N. Jacobson, V. Follette, & M. Dougher (Eds.), Acceptance and change: Content and context in psychotherapy (pp. 13-32). Reno, NV: Context Press. Hayes, S. C., Barnes-Holmes, D., & Roche, B. (2001). Relational frame theory: A post-Skinnerian account of human language and cognition. New York: Kluwer Academic/Plenum Publishers. Hayes, S. C., & Brownstein, A. J. (1986). Mentalism, behavior- behavior relations, and a behavior-analytic view of the purposes of science. Behavior Analyst, 9(2), 175-190. Hayes, S. C., & Hayes, L. J. (1989). The verbal action of the listener as a basis for rule governance. In S. Hayes (Ed.), Rule-governed behavior: Cognition, contingencies, and
- 84. instructional control (pp. 153-190). New York: Plenum. Hayes, S. C., Strosahl, K., & Wilson, K. G. (1999). Acceptance and commitment therapy: An experiential approach to behavior change. New York:Guilford Press. Lang, P. J. (1985). Cognition in emotion: Concept and action. In C. Izard & J. Kagan (Eds.), Emotions, cognition, and behavior (pp. 192-226). New York: Cambridge University Press. Levenson, H. (1995). Time-limited dynamic psychotherapy: A guide to clinical practice. New York: Basic Books. Lipkens, G., Hayes, S. C., and Hayes, L. J. (1993). Longitudinal study of derived stimulus relations in an infant. Journal of Experimental Child Psychology, 56, 201-239. REFERENCES Pilgrim, C., and Galizio, M. (1995). Reversal of baseline relations and stimulus equivalence: I. Adults. Journal of the Experimental Analysis of Behavior, 63, 225-238. Barnes-Holmes, D., Hayes, S. C., & Dymond, S. (2001). Self and self-directed rules. In S. Hayes, D. Barnes-Holmes, & B. Roche (Eds.), Relational frame theory: A post-Skinnerian account of human language and cognition (pp. 119-140). New York: Kluwer Academic/Plenum Publishers. Pistorello, J., Follette, V. M., & Hayes, S. C. (2000). Long-
- 85. term correlates of childhood sexual abuse: A behavior analytic perspective. In M. Dougher (Ed.), Clinical behavior analysis (pp. 75-98). Reno, NV: Context Press. Barnes-Holmes, D., Hayes, S. C., & Gregg, J. (2001). Religion, spirituality, and transcendence. In S. Hayes, D. Barnes- Holmes, & B. Roche (Eds.), Relational frame theory: A post-Skinnerian account of human language and cognition (pp. 3-20). New York: Kluwer Academic/Plenum Publishers. Schusterman, R. J., & Kastak, D. (1998). Functional equivalence in a California sea lion: Relevance to animal social and communicative interactions. Animal Behaviour, 55(5), 1087-1095. Blackledge, J. T., & Hayes, S. C. (In preparation). Adding relational responses to existing relational networks: An example of an intervention grounded in Relational Frame Theory. Manuscript in preparation. Skinner, B. F. (1957). Verbal behavior. New York: Appleton- Century-Crofts. Walser, R. D., & Hayes, S. C. (1998). Acceptance and trauma survivors: Applied issues and problems. In V. Follette & J. Ruzek (Eds.). Cognitive-behavioral therapies for trauma (pp. 256-277). New York: The Guilford Press Blackledge, J. T., Reinbold, C. A., Adams, M., Adams, A., Cummings, A., & Hayes, S. C. (In progress). Teaching arbitrary better-worse relational responses to children diagnosed with autism. Study in progress.
- 86. Wilson, K. G. (1998). Relational acquisition of stimulus function in substance dependence: A preliminary examination of drug versus non-drug related equivalence classes. Unpublished doctoral dissertation at the University of Nevada, Reno. 432 T hi s do cu m en t i s co py ri gh te d by th e A
- 89. r t he p er so na l u se o f t he in di vi du al u se r a nd is n ot to
- 90. b e di ss em in at ed b ro ad ly . T H E B E H A V I O R A N A L Y S T T O D A Y V O L U M E 3 , I S S U E 4 , 2 0 0 3 Wilson, K. G., and Hayes, S. C. (1996). Resurgence of derived stimulus relations. Journal of the Experimental Analysis of Behavior, 66, 267-281. Author’s Note: Address editorial correspondence to: John T. Blackledge, 550 Central Ave. #123, Alameda, CA 94501, Fax/Phone (510) 749-8492, email:[email protected] 433 T hi
- 95. ed b ro ad ly . Data Visualisation 2 3 Data Visualisation A Handbook for Data Driven Design Andy Kirk 4 SAGE Publications Ltd
- 96. 1 Oliver’s Yard 55 City Road London EC1Y 1SP SAGE Publications Inc. 2455 Teller Road Thousand Oaks, California 91320 SAGE Publications India Pvt Ltd B 1/I 1 Mohan Cooperative Industrial Area Mathura Road New Delhi 110 044 SAGE Publications Asia-Pacific Pte Ltd 3 Church Street #10-04 Samsung Hub Singapore 049483 5 © Andy Kirk 2016 First published 2016
- 97. Apart from any fair dealing for the purposes of research or private study, or criticism or review, as permitted under the Copyright, Designs and Patents Act, 1988, this publication may be reproduced, stored or transmitted in any form, or by any means, only with the prior permission in writing of the publishers, or in the case of reprographic reproduction, in accordance with the terms of licences issued by the Copyright Licensing Agency. Enquiries concerning reproduction outside those terms should be sent to the publishers. Library of Congress Control Number: 2015957322 British Library Cataloguing in Publication data A catalogue record for this book is available from the British Library ISBN 978-1-4739-1213-7 ISBN 978-1-4739-1214-4 (pbk) Editor: Mila Steele Editorial assistant: Alysha Owen Production editor: Ian Antcliff Marketing manager: Sally Ransom Cover design: Shaun Mercier
- 98. Typeset by: C&M Digitals (P) Ltd, Chennai, India Printed and bound in Great Britain by Bell and Bain Ltd, Glasgow 6 Contents List of Figures with Source Notes Acknowledgements About the Author INTRODUCTION PART A FOUNDATIONS 1 Defining Data Visualisation 2 Visualisation Workflow PART B THE HIDDEN THINKING 3 Formulating Your Brief 4 Working With Data 5 Establishing Your Editorial Thinking PART C DEVELOPING YOUR DESIGN SOLUTION 6 Data Representation 7 Interactivity 8 Annotation 9 Colour 10 Composition PART D DEVELOPING YOUR CAPABILITIES 11 Visualisation Literacy References Index
- 99. 7 List of Figures with Source Notes 1.1 A Definition for Data Visualisation 19 1.2 Per Capita Cheese Consumption in the U.S., by Sarah Slobin (Fortune magazine) 20 1.3 The Three Stages of Understanding 22 1.4–6 Demonstrating the Process of Understanding 24–27 1.7 The Three Principles of Good Visualisation Design 30 1.8 Housing and Home Ownership in the UK, by ONS Digital Content Team 33 1.9 Falling Number of Young Homeowners, by the Daily Mail 33 1.10 Gun Deaths in Florida (Reuters Graphics) 34 1.11 Iraq’s Bloody Toll, by Simon Scarr (South China Morning Post) 34 1.12 Gun Deaths in Florida Redesign, by Peter A. Fedewa (@pfedewa) 35 1.13 If Vienna would be an Apartment, by NZZ (Neue Zürcher Zeitung) [Translated] 45 1.14 Asia Loses Its Sweet Tooth for Chocolate, by Graphics Department (Wall Street Journal) 45 2.1 The Four Stages of the Visualisation Workflow 54 3.1 The ‘Purpose Map’ 76 3.2 Mizzou’s Racial Gap Is Typical On College Campuses, by FiveThirtyEight 77 3.3 Image taken from ‘Wealth Inequality in America’, by YouTube user ‘Politizane’ (www.youtube.com/watch?v=QPKKQnijnsM) 78 3.4 Dimensional Changes in Wood, by Luis Carli (luiscarli.com) 79
- 100. 3.5 How Y’all, Youse and You Guys Talk, by Josh Katz (The New York Times) 80 3.6 Spotlight on Profitability, by Krisztina Szücs 81 3.7 Countries with the Most Land Neighbours 83 3.8 Buying Power: The Families Funding the 2016 Presidential Election, by Wilson Andrews, Amanda Cox, Alicia DeSantis, Evan Grothjan, Yuliya Parshina-Kottas, Graham Roberts, Derek Watkins and Karen Yourish (The New York Times) 84 3.9 Image taken from ‘Texas Department of Criminal Justice’ Website (www.tdcj.state.tx.us/death_row/dr_executed_offenders.html) 86 8 3.10 OECD Better Life Index, by Moritz Stefaner, Dominikus Baur, Raureif GmbH 89 3.11 Losing Ground, by Bob Marshall, The Lens, Brian Jacobs and Al Shaw (ProPublica) 89 3.12 Grape Expectations, by S. Scarr, C. Chan, and F. Foo (Reuters Graphics) 91 3.13 Keywords and Colour Swatch Ideas from Project about Psychotherapy Treatment in the Arctic 92 3.14 An Example of a Concept Sketch, by Giorgia Lupi of Accurat 92 4.1 Example of a Normalised Dataset 99 4.2 Example of a Cross-tabulated Dataset 100 4.3 Graphic Language: The Curse of the CEO, by David Ingold
- 101. and Keith Collins (Bloomberg Visual Data), Jeff Green (Bloomberg News) 101 4.4 US Presidents by Ethnicity (1789 to 2015) 114 4.5 OECD Better Life Index, by Moritz Stefaner, Dominikus Baur, Raureif GmbH 116 4.6 Spotlight on Profitability, by Krisztina Szücs 117 4.7 Example of ‘Transforming to Convert’ Data 119 4.8 Making Sense of the Known Knowns 123 4.9 What Good Marathons and Bad Investments Have in Common, by Justin Wolfers (The New York Times) 124 5.1 The Fall and Rise of U.S. Inequality, in Two Graphs Source: World Top Incomes Database; Design credit: Quoctrung Bui (NPR) 136 5.2–4 Why Peyton Manning’s Record Will Be Hard to Beat, by Gregor Aisch and Kevin Quealy (The New York Times) 138– 140 C.1 Mockup Designs for ‘Poppy Field’, by Valentina D’Efilippo (design); Nicolas Pigelet (code); Data source: The Polynational War Memorial, 2014 (poppyfield.org) 146 6.1 Mapping Records and Variables on to Marks and Attributes 152 6.2 List of Mark Encodings 153 6.3 List of Attribute Encodings 153 6.4 Bloomberg Billionaires, by Bloomberg Visual Data (Design and development), Lina Chen and Anita Rundles (Illustration) 155 6.5 Lionel Messi: Games and Goals for FC Barcelona 156 6.6 Image from the Home page of visualisingdata.com 156 6.7 How the Insane Amount of Rain in Texas Could Turn Rhode Island Into a Lake, by Christopher Ingraham (The Washington Post)
- 102. 156 9 6.8 The 10 Actors with the Most Oscar Nominations but No Wins 161 6.9 The 10 Actors who have Received the Most Oscar Nominations 162 6.10 How Nations Fare in PhDs by Sex Interactive, by Periscopic; Research by Amanda Hobbs; Published in Scientific American 163 6.11 Gender Pay Gap US, by David McCandless, Miriam Quick (Research) and Philippa Thomas (Design) 164 6.12 Who Wins the Stanley Cup of Playoff Beards? by Graphics Department (Wall Street Journal) 165 6.13 For These 55 Marijuana Companies, Every Day is 4/20, by Alex Tribou and Adam Pearce (Bloomberg Visual Data) 166 6.14 UK Public Sector Capital Expenditure, 2014/15 167 6.15 Global Competitiveness Report 2014–2015, by Bocoup and the World Economic Forum 168 6.16 Excerpt from a Rugby Union Player Dashboard 169 6.17 Range of Temperatures (°F) Recorded in the Top 10 Most Populated Cities During 2015 170 6.18 This Chart Shows How Much More Ivy League Grads Make Than You, by Christopher Ingraham (The Washington Post) 171 6.19 Comparing Critics Scores (Rotten Tomatoes) for Major Movie Franchises 172
- 103. 6.20 A Career in Numbers: Movies Starring Michael Caine 173 6.21 Comparing the Frequency of Words Used in Chapter 1 of this Book 174 6.22 Summary of Eligible Votes in the UK General Election 2015 175 6.23 The Changing Fortunes of Internet Explorer and Google Chrome 176 6.24 Literarcy Proficiency: Adult Levels by Country 177 6.25 Political Polarization in the American Public’, Pew Research Center, Washington, DC (February, 2015) (http://www.people- press.org/2014/06/12/political-polarization-in-the-american- public/) 178 6.26 Finviz (www.finviz.com) 179 6.27 This Venn Diagram Shows Where You Can Both Smoke Weed and Get a Same-Sex Marriage, by Phillip Bump (The Washington Post) 180 6.28 The 200+ Beer Brands of SAB InBev, by Maarten Lambrechts for Mediafin: www.tijd.be/sabinbev (Dutch), 10 www.lecho.be/service/sabinbev (French) 181 6.29 Which Fossil Fuel Companies are Most Responsible for Climate Change? by Duncan Clark and Robin Houston (Kiln), published in
- 104. the Guardian, drawing on work by Mike Bostock and Jason Davies 182 6.30 How Long Will We Live – And How Well? by Bonnie Berkowitz, Emily Chow and Todd Lindeman (The Washington Post) 183 6.31 Crime Rates by State, by Nathan Yau 184 6.32 Nutrient Contents – Parallel Coordinates, by Kai Chang (@syntagmatic) 185 6.33 How the ‘Avengers’ Line-up Has Changed Over the Years, by Jon Keegan (Wall Street Journal) 186 6.34 Interactive Fixture Molecules, by @experimental361 and @bootifulgame 187 6.35 The Rise of Partisanship and Super-cooperators in the U.S. House of Representatives. Visualisation by Mauro Martino, authored by Clio Andris, David Lee, Marcus J. Hamilton, Mauro Martino, Christian E. Gunning, and John Armistead Selde 188 6.36 The Global Flow of People, by Nikola Sander, Guy J. Abel and Ramon Bauer 189 6.37 UK Election Results by Political Party, 2010 vs 2015 190 6.38 The Fall and Rise of U.S. Inequality, in Two Graphs. Source: World Top Incomes Database; Design credit: Quoctrung Bui (NPR) 191 6.39 Census Bump: Rank of the Most Populous Cities at Each Census, 1790–1890, by Jim Vallandingham 192 6.40 Coal, Gas, Nuclear, Hydro? How Your State Generates Power. Source: U.S. Energy Information Administration, Credit: Christopher Groskopf, Alyson Hurt and Avie Schneider (NPR) 193
- 105. 6.41 Holdouts Find Cheapest Super Bowl Tickets Late in the Game, by Alex Tribou, David Ingold and Jeremy Diamond (Bloomberg Visual Data) 194 6.42 Crude Oil Prices (West Texas Intermediate), 1985–2015 195 6.43 Percentage Change in Price for Select Food Items, Since 1990, by Nathan Yau 196 6.44 The Ebb and Flow of Movies: Box Office Receipts 1986– 2008, by Mathew Bloch, Lee Byron, Shan Carter and Amanda Cox (The New York Times) 197 6.45 Tracing the History of N.C.A.A. Conferences, by Mike Bostock, 11 Shan Carter and Kevin Quealy (The New York Times) 198 6.46 A Presidential Gantt Chart, by Ben Jones 199 6.47 How the ‘Avengers’ Line-up Has Changed Over the Years, by Jon Keegan (Wall Street Journal) 200 6.48 Native and New Berliners – How the S-Bahn Ring Divides the City, by Julius Tröger, André Pätzold, David Wendler (Berliner Morgenpost) and Moritz Klack (webkid.io) 201 6.49 How Y’all, Youse and You Guys Talk, by Josh Katz (The New York Times) 202 6.50 Here’s Exactly Where the Candidates Cash Came From, by Zach Mider, Christopher Cannon, and Adam Pearce (Bloomberg
- 106. Visual Data) 203 6.51 Trillions of Trees, by Jan Willem Tulp 204 6.52 The Racial Dot Map. Image Copyright, 2013, Weldon Cooper Center for Public Service, Rector and Visitors of the University of Virginia (Dustin A. Cable, creator) 205 6.53 Arteries of the City, by Simon Scarr (South China Morning Post) 206 6.54 The Carbon Map, by Duncan Clark and Robin Houston (Kiln) 207 6.55 Election Dashboard, by Jay Boice, Aaron Bycoffe and Andrei Scheinkman (Huffington Post). Statistical model created by Simon Jackman 208 6.56 London is Rubbish at Recycling and Many Boroughs are Getting Worse, by URBS London using London Squared Map © 2015 www.aftertheflood.co 209 6.57 Automating the Design of Graphical Presentations of Relational Information. Adapted from McKinlay, J. D. (1986). ACM Transactions on Graphics, 5(2), 110–141. 213 6.58 Comparison of Judging Line Size vs Area Size 213 6.59 Comparison of Judging Related Items Using Variation in Colour (Hue) vs Variation in Shape 214 6.60 Illustrating the Correct and Incorrect Circle Size Encoding 216 6.61 Illustrating the Distortions Created by 3D Decoration 217 6.62 Example of a Bullet Chart using Banding Overlays 218 6.63 Excerpt from What’s Really Warming the World? by Eric Roston and Blacki Migliozzi (Bloomberg Visual Data) 218
- 107. 6.64 Example of Using Markers Overlays 219 6.65 Why Is Her Paycheck Smaller? by Hannah Fairfield and Graham Roberts (The New York Times) 219 12 6.66 Inside the Powerful Lobby Fighting for Your Right to Eat Pizza, by Andrew Martin and Bloomberg Visual Data 220 6.67 Excerpt from ‘Razor Sales Move Online, Away From Gillette’, by Graphics Department (Wall Street Journal) 220 7.1 US Gun Deaths, by Periscopic 225 7.2 Finviz (www.finviz.com) 226 7.3 The Racial Dot Map: Image Copyright, 2013, Weldon Cooper Center for Public Service, Rector and Visitors of the University of Virginia (Dustin A. Cable, creator) 227 7.4 Obesity Around the World, by Jeff Clark 228 7.5 Excerpt from ‘Social Progress Index 2015’, by Social Progress Imperative, 2015 228 7.6 NFL Players: Height & Weight Over Time, by Noah Veltman (noahveltman.com) 229 7.7 Excerpt from ‘How Americans Die’, by Matthew C. Klein and Bloomberg Visual Data 230 7.8 Model Projections of Maximum Air Temperatures Near the Ocean and Land Surface on the June Solstice in 2014 and 2099: NASA Earth Observatory maps, by Joshua Stevens 231 7.9 Excerpt from ‘A Swing of Beauty’, by Sohail Al-Jamea,
- 108. Wilson Andrews, Bonnie Berkowitz and Todd Lindeman (The Washington Post) 231 7.10 How Well Do You Know Your Area? by ONS Digital Content team 232 7.11 Excerpt from ‘Who Old Are You?’, by David McCandless and Tom Evans 233 7.12 512 Paths to the White House, by Mike Bostock and Shan Carter (The New York Times) 233 7.13 OECD Better Life Index, by Moritz Stefaner, Dominikus Baur, Raureif GmbH 233 7.14 Nobel Laureates, by Matthew Weber (Reuters Graphics) 234 7.15 Geography of a Recession, by Graphics Department (The New York Times) 234 7.16 How Big Will the UK Population be in 25 Years Time? by ONS Digital Content team 234 7.17 Excerpt from ‘Workers’ Compensation Reforms by State’, by Yue Qiu and Michael Grabell (ProPublica) 235 7.18 Excerpt from ‘ECB Bank Test Results’, by Monica Ulmanu, Laura Noonan and Vincent Flasseur (Reuters Graphics) 236 7.19 History Through the President’s Words, by Kennedy Elliott, Ted 13
- 109. Mellnik and Richard Johnson (The Washington Post) 237 7.20 Excerpt from ‘How Americans Die’, by Matthew C. Klein and Bloomberg Visual Data 237 7.21 Twitter NYC: A Multilingual Social City, by James Cheshire, Ed Manley, John Barratt, and Oliver O’Brien 238 7.22 Killing the Colorado: Explore the Robot River, by Abrahm Lustgarten, Al Shaw, Jeff Larson, Amanda Zamora and Lauren Kirchner (ProPublica) and John Grimwade 238 7.23 Losing Ground, by Bob Marshall, The Lens, Brian Jacobs and Al Shaw (ProPublica) 239 7.24 Excerpt from ‘History Through the President’s Words’, by Kennedy Elliott, Ted Mellnik and Richard Johnson (The Washington Post) 240 7.25 Plow, by Derek Watkins 242 7.26 The Horse in Motion, by Eadweard Muybridge. Source: United States Library of Congress’s Prints and Photographs division, digital ID cph.3a45870. 243 8.1 Titles Taken from Projects Published and Credited Elsewhere in This Book 248 8.2 Excerpt from ‘The Color of Debt: The Black Neighborhoods Where Collection Suits Hit Hardest’, by Al Shaw, Annie Waldman and Paul Kiel (ProPublica) 249 8.3 Excerpt from ‘Kindred Britain’ version 1.0 © 2013 Nicholas Jenkins – designed by Scott Murray, powered by SUL-CIDR 249 8.4 Excerpt from ‘The Color of Debt: The Black Neighborhoods Where Collection Suits Hit Hardest’, by Al Shaw, Annie
- 110. Waldman and Paul Kiel (ProPublica) 250 8.5 Excerpt from ‘Bloomberg Billionaires’, by Bloomberg Visual Data (Design and development), Lina Chen and Anita Rundles (Illustration) 251 8.6 Excerpt from ‘Gender Pay Gap US?’, by David McCandless, Miriam Quick (Research) and Philippa Thomas (Design) 251 8.7 Excerpt from ‘Holdouts Find Cheapest Super Bowl Tickets Late in the Game’, by Alex Tribou, David Ingold and Jeremy Diamond (Bloomberg Visual Data) 252 8.8 Excerpt from ‘The Life Cycle of Ideas’, by Accurat 252 8.9 Mizzou’s Racial Gap Is Typical On College Campuses, by FiveThirtyEight 253 8.10 Excerpt from ‘The Infographic History of the World’, Harper Collins (2013); by Valentina D’Efilippo (co-author and designer); 14 James Ball (co-author and writer); Data source: The Polynational War Memorial, 2012 254 8.11 Twitter NYC: A Multilingual Social City, by James Cheshire, Ed Manley, John Barratt, and Oliver O’Brien 255 8.12 Excerpt from ‘US Gun Deaths’, by Periscopic 255 8.13 Image taken from Wealth Inequality in America, by YouTube user ‘Politizane’ (www.youtube.com/watch?v=QPKKQnijnsM) 256
- 111. 9.1 HSL Colour Cylinder: Image from Wikimedia Commons published under the Creative Commons Attribution-Share Alike 3.0 Unported license 265 9.2 Colour Hue Spectrum 265 9.3 Colour Saturation Spectrum 266 9.4 Colour Lightness Spectrum 266 9.5 Excerpt from ‘Executive Pay by the Numbers’, by Karl Russell (The New York Times) 267 9.6 How Nations Fare in PhDs by Sex Interactive, by Periscopic; Research by Amanda Hobbs; Published in Scientific American 268 9.7 How Long Will We Live – And How Well? by Bonnie Berkowitz, Emily Chow and Todd Lindeman (The Washington Post) 268 9.8 Charting the Beatles: Song Structure, by Michael Deal 269 9.9 Photograph of MyCuppa mug, by Suck UK (www.suck.uk.com/products/mycuppamugs/) 269 9.10 Example of a Stacked Bar Chart Based on Ordinal Data 270 9.11 Rim Fire – The Extent of Fire in the Sierra Nevada Range and Yosemite National Park, 2013: NASA Earth Observatory images, by Robert Simmon 270 9.12 What are the Current Electricity Prices in Switzerland [Translated], by Interactive things for NZZ (the Neue Zürcher Zeitung) 271 9.13 Excerpt from ‘Obama’s Health Law: Who Was Helped Most’, by Kevin Quealy and Margot Sanger-Katz (The New York Times) 272 9.14 Daily Indego Bike Share Station Usage, by Randy Olson
- 112. (@randal_olson) (http://www.randalolson.com/2015/09/05/visualizing-indego- bike- share-usage-patterns-in-philadelphia-part-2/) 272 9.15 Battling Infectious Diseases in the 20th Century: The Impact of Vaccines, by Graphics Department (Wall Street Journal) 273 9.16 Highest Max Temperatures in Australia (1st to 14th January 2013), Produced by the Australian Government Bureau of 15 Meteorology 274 9.17 State of the Polar Bear, by Periscopic 275 9.18 Excerpt from Geography of a Recession by Graphics Department (The New York Times) 275 9.19 Fewer Women Run Big Companies Than Men Named John, by Justin Wolfers (The New York Times) 276 9.20 NYPD, Council Spar Over More Officers by Graphics Department (Wall Street Journal) 277 9.21 Excerpt from a Football Player Dashboard 277 9.22 Elections Performance Index, The Pew Charitable Trusts © 2014 278 9.23 Art in the Age of Mechanical Reproduction: Walter Benjamin by Stefanie Posavec 279 9.24 Casualties, by Stamen, published by CNN 279 9.25 First Fatal Accident in Spain on a High-speed Line [Translated], by Rodrigo Silva, Antonio Alonso, Mariano Zafra, Yolanda Clemente
- 113. and Thomas Ondarra (El Pais) 280 9.26 Lunge Feeding, by Jonathan Corum (The New York Times); whale illustration by Nicholas D. Pyenson 281 9.27 Examples of Common Background Colour Tones 281 9.28 Excerpt from NYC Street Trees by Species, by Jill Hubley 284 9.29 Demonstrating the Impact of Red-green Colour Blindness (deuteranopia) 286 9.30 Colour-blind Friendly Alternatives to Green and Red 287 9.31 Excerpt from, ‘Pyschotherapy in The Arctic’, by Andy Kirk 289 9.32 Wind Map, by Fernanda Viégas and Martin Wattenberg 289 10.1 City of Anarchy, by Simon Scarr (South China Morning Post) 294 10.2 Wireframe Sketch, by Giorgia Lupi for ‘Nobels no degree’ by Accurat 295 10.3 Example of the Small Multiples Technique 296 10.4 The Glass Ceiling Persists Redesign, by Francis Gagnon (ChezVoila.com) based on original by S. Culp (Reuters Graphics) 297 10.5 Fast-food Purchasers Report More Demands on Their Time, by Economic Research Service (USDA) 297 10.6 Stalemate, by Graphics Department (Wall Street Journal) 297 10.7 Nobels No Degrees, by Accurat 298 10.8 Kasich Could Be The GOP’s Moderate Backstop, by FiveThirtyEight 298 16
- 114. 10.9 On Broadway, by Daniel Goddemeyer, Moritz Stefaner, Dominikus Baur, and Lev Manovich 299 10.10 ER Wait Watcher: Which Emergency Room Will See You the Fastest? by Lena Groeger, Mike Tigas and Sisi Wei (ProPublica) 300 10.11 Rain Patterns, by Jane Pong (South China Morning Post) 300 10.12 Excerpt from ‘Pyschotherapy in The Arctic’, by Andy Kirk 301 10.13 Gender Pay Gap US, by David McCandless, Miriam Quick (Research) and Philippa Thomas (Design) 301 10.14 The Worst Board Games Ever Invented, by FiveThirtyEight 303 10.15 From Millions, Billions, Trillions: Letters from Zimbabwe, 2005−2009, a book written and published by Catherine Buckle (2014), table design by Graham van de Ruit (pg. 193) 303 10.16 List of Chart Structures 304 10.17 Illustrating the Effect of Truncated Bar Axis Scales 305 10.18 Excerpt from ‘Doping under the Microscope’, by S. Scarr and W. Foo (Reuters Graphics) 306 10.19 Record-high 60% of Americans Support Same-sex Marriage, by Gallup 306 10.20 Images from Wikimedia Commons, published under the Creative Commons Attribution-Share Alike 3.0 Unported license 308 11.1–7 The Pursuit of Faster’ by Andy Kirk and Andrew Witherley 318–324 17
- 115. Acknowledgements This book has been made possible thanks to the unwavering support of my incredible wife, Ellie, and the endless encouragement from my Mum and Dad, the rest of my brilliant family and my super group of friends. From a professional standpoint I also need to acknowledge the fundamental role played by the hundreds of visualisation practitioners (no matter under what title you ply your trade) who have created such a wealth of brilliant work from which I have developed so many of my convictions and formed the basis of so much of the content in this book. The people and organisations who have provided me with permission to use their work are heroes and I hope this book does their rich talent justice. 18 About the Author Andy Kirk is a freelance data visualisation specialist based in Yorkshire, UK. He is a visualisation design consultant, training provider, teacher, researcher, author, speaker and editor of the award-winning
- 116. website visualisingdata.com After graduating from Lancaster University in 1999 with a BSc (hons) in Operational Research, Andy held a variety of business analysis and information management positions at organisations including West Yorkshire Police and the University of Leeds. He discovered data visualisation in early 2007 just at the time when he was shaping up his proposal for a Master’s (MA) Research Programme designed for members of staff at the University of Leeds. On completing this programme with distinction, Andy’s passion for the subject was unleashed. Following his graduation in December 2009, to continue the process of discovering and learning the subject he launched visualisingdata.com, a blogging platform that would chart the ongoing development of the data visualisation field. Over time, as the field has continued to grow, the site too has reflected this, becoming one of the most popular in the field. It features a wide range of fresh content profiling the latest projects and contemporary techniques, discourse about practical and theoretical matters, commentary about key issues, and collections of valuable references and resources. In 2011 Andy became a freelance professional focusing on data visualisation consultancy and training workshops. Some of his clients include CERN, Arsenal FC, PepsiCo, Intel, Hershey, the WHO and McKinsey. At the time of writing he has delivered over 160
- 117. public and private training events across the UK, Europe, North America, Asia, South Africa and Australia, reaching well over 3000 delegates. In addition to training workshops Andy also has two academic teaching positions. He joined the highly respected Maryland Institute College of Art (MICA) as a visiting lecturer in 2013 and has been teaching a module on the Information Visualisation Master’s Programme since its inception. In January 2016, he began teaching a data visualisation module as part of the MSc in Business Analytics at the Imperial College Business School in London. 19 Between 2014 and 2015 Andy was an external consultant on a research project called ‘Seeing Data’, funded by the Arts & Humanities Research Council and hosted by the University of Sheffield. This study explored the issues of data visualisation literacy among the general public and, among many things, helped to shape an understanding of the human factors that affect visualisation literacy and the effectiveness of design. 20 Introduction
- 118. I.1 The Quest Begins In his book The Seven Basic Plots, author Christopher Booker investigated the history of telling stories. He examined the structures used in biblical teachings and historical myths through to contemporary storytelling devices used in movies and TV. From this study he found seven common themes that, he argues, can be identifiable in any form of story. One of these themes was ‘The Quest’. Booker describes this as revolving around a main protagonist who embarks on a journey to acquire a treasured object or reach an important destination, but faces many obstacles and temptations along the way. It is a theme that I feel shares many characteristics with the structure of this book and the nature of data visualisation. You are the central protagonist in this story in the role of the data visualiser. The journey you are embarking on involves a route along a design workflow where you will be faced with a wide range of different conceptual, practical and technical challenges. The start of this journey will be triggered by curiosity, which you will need to define in order to accomplish your goals. From this origin you will move forward to
- 119. initiating and planning your work, defining the dimensions of your challenge. Next, you will begin the heavy lifting of working with data, determining what qualities it contains and how you might share these with others. Only then will you be ready to take on the design stage. Here you will be faced with the prospect of handling a spectrum of different design options that will require creative and rational thinking to resolve most effectively. The multidisciplinary nature of this field offers a unique opportunity and challenge. Data visualisation is not an especially difficult capability to acquire, it is largely a game of decisions. Making better decisions will be your goal but sometimes clear decisions will feel elusive. There will be occasions when the best choice is not at all visible and others when there will be many seemingly equal viable choices. Which one to go with? This book aims to be your guide, helping you navigate efficiently through these 21 difficult stages of your journey. You will need to learn to be flexible and adaptable, capable of
- 120. shifting your approach to suit the circumstances. This is important because there are plenty of potential villains lying in wait looking to derail progress. These are the forces that manifest through the imposition of restrictive creative constraints and the pressure created by the relentless ticking clock of timescales. Stakeholders and audiences will present complex human factors through the diversity of their needs and personal traits. These will need to be astutely accommodated. Data, the critical raw material of this process, will dominate your attention. It will frustrate and even disappoint at times, as promises of its treasures fail to materialise irrespective of the hard work, love and attention lavished upon it. Your own characteristics will also contribute to a certain amount of the villainy. At times, you will find yourself wrestling with internal creative and analytical voices pulling against each other in opposite directions. Your excitably formed initial ideas will be embraced but will need taming. Your inherent tastes, experiences and comforts will divert you away from the ideal path, so you will need to maintain clarity and focus. The central conflict you will have to deal with is the notion that there is no perfect in data visualisation. It is a field with very few ‘always’
- 121. and ‘nevers’. Singular solutions rarely exist. The comfort offered by the rules that instruct what is right and wrong, good and evil, has its limits. You can find small but legitimate breaking points with many of them. While you can rightly aspire to reach as close to perfect as possible, the attitude of aiming for good enough will often indeed be good enough and fundamentally necessary. In accomplishing the quest you will be rewarded with competency in data visualisation, developing confidence in being able to judge the most effective analytical and design solutions in the most efficient way. It will take time and it will need more than just reading this book. It will also require your ongoing effort to learn, apply, reflect and develop. Each new data visualisation opportunity poses a new, unique challenge. However, if you keep persevering with this journey the possibility of a happy ending will increase all the time. I.2 Who is this Book Aimed at? 22 The primary challenge one faces when writing a book about data visualisation is to determine what to leave in and what to leave out. Data
- 122. visualisation is big. It is too big a subject even to attempt to cover it all, in detail, in one book. There is no single book to rule them all because there is no one book that can cover it all. Each and every one of the topics covered by the chapters in this book could (and, in several cases, do) exist as whole books in their own right. The secondary challenge when writing a book about data visualisation is to decide how to weave all the content together. Data visualisation is not rocket science; it is not an especially complicated discipline. Lots of it, as you will see, is rooted in common sense. It is, however, certainly a complex subject, a semantic distinction that will be revisited later. There are lots of things to think about and decide on, as well as many things to do and make. Creative and analytical sensibilities blend with artistic and scientific judgments. In one moment you might be checking the statistical rigour of your calculations, in the next deciding which tone of orange most elegantly contrasts with an 80% black. The complexity of data visualisation manifests itself through how these different ingredients, and many more, interact, influence and intersect to form the whole. The decisions I have made in formulating this book‘s content have been shaped by my own process of learning about, writing about and
- 123. practising data visualisation for, at the time of writing, nearly a decade. Significantly – from the perspective of my own development – I have been fortunate to have had extensive experience designing and delivering training workshops and postgraduate teaching. I believe you only truly learn about your own knowledge of a subject when you have to explain it and teach it to others. I have arrived at what I believe to be an effective and proven pedagogy that successfully translates the complexities of this subject into accessible, practical and valuable form. I feel well qualified to bridge the gap between the large population of everyday practitioners, who might identify themselves as beginners, and the superstar technical, creative and academic minds that are constantly pushing forward our understanding of the potential of data visualisation. I am not going to claim to belong to that latter cohort, but I have certainly been the former – a beginner – and most of my working hours are spent helping other beginners start their journey. I know the things that I would have valued when I was starting out and I 23
- 124. know how I would have wished them to be articulated and presented for me to develop my skills most efficiently. There is a large and growing library of fantastic books offering many different theoretical and practical viewpoints on the subject of data visualisation. My aim is to bring value to this existing collection of work by taking on a particular perspective that is perhaps under- represented in other texts – exploring the notion and practice of a visualisation design process. As I have alluded to in the opening, the central premise of this book is that the path to mastering data visualisation is achieved by making better decisions: effective choices, efficiently made. The book’s central goal is to help develop your capability and confidence in facing these decisions. Just as a single book cannot cover the whole of this subject, it stands that a single book cannot aim to address directly the needs of all people doing data visualisation. In this section I am going to run through some of the characteristics that shape the readers to whom this book is primarily targeted. I will also put into context the content the book will and will not cover, and why. This will help manage your expectations as the
- 125. reader and establish its value proposition compared with other titles. Domain and Duties The core audiences for whom this book has been primarily written are undergraduate and postgraduate-level students and early career researchers from social science subjects. This reflects a growing number of people in higher education who are interested in and need to learn about data visualisation. Although aimed at social sciences, the content will also be relevant across the spectrum of academic disciplines, from the arts and humanities right through to the formal and natural sciences: any academic duty where there is an emphasis on the use of quantitative and qualitative methods in studies will require an appreciation of good data visualisation practices. Where statistical capabilities are relevant so too is data visualisation. Beyond academia, data visualisation is a discipline that has reached mainstream consciousness with an increasing number of professionals and organisations, across all industry types and sizes, recognising the 24
- 126. importance of doing it well for both internal and external benefit. You might be a market researcher, a librarian or a data analyst looking to enhance your data capabilities. Perhaps you are a skilled graphic designer or web developer looking to take your portfolio of work into a more data- driven direction. Maybe you are in a managerial position and not directly involved in the creation of visualisation work, but you need to coordinate or commission others who will be. You require awareness of the most efficient approaches, the range of options and the different key decision points. You might be seeking generally to improve the sophistication of the language you use around commissioning visualisation work and to have a better way of expressing and evaluating work created for you. Basically, anyone who is involved in whatever capacity with the analysis and visual communication of data as part of their professional duties will need to grasp the demands of data visualisation and this book will go some way to supporting these needs. Subject Neutrality One of the important aspects of the book will be to emphasise that data visualisation is a portable practice. You will see a broad array
- 127. of examples of work from different industries, covering very different topics. What will become apparent is that visualisation techniques are largely subject-matter neutral: a line chart that displays the ebb and flow of favourable opinion towards a politician involves the same techniques as using a line chart to show how a stock has changed in value over time or how peak temperatures have changed across a season in a given location. A line chart is a line chart, regardless of the subject matter. The context of the viewers (such as their needs and their knowledge) and the specific meaning that can be drawn will inevitably be unique to each setting, but the role of visualisation itself is adaptable and portable across all subject areas. Data visualisation is an entirely global concern, not focused on any defined geographic region. Although the English language dominates the written discourse (books, websites) about this subject, the interest in it and visible output from across the globe are increasing at a pace. There are cultural matters that influence certain decisions throughout the design process, especially around the choices made for colour usage, but otherwise it is a discipline common to all.
- 128. 25 Level and Prerequisites The coverage of this book is intended to serve the needs of beginners and those with intermediate capability. For most people, this is likely to be as far as they might ever need to go. It will offer an accessible route for novices to start their learning journey and, for those already familiar with the basics, there will be content that will hopefully contribute to fine- tuning their approaches. For context, I believe the only distinction between beginner and intermediate is one of breadth and depth of critical thinking rather than any degree of difficulty. The more advanced techniques in visualisation tend to be associated with the use of specific technologies for handling larger, complex datasets and/or producing more bespoke and feature- rich outputs. This book is therefore not aimed at experienced or established visualisation practitioners. There may be some new perspectives to enrich their thinking, some content that will confirm and other content that might constructively challenge their convictions. Otherwise, the coverage in this book should really echo the practices they are likely to be already
- 129. observing. As I have already touched on, data visualisation is a genuinely multidisciplinary field. The people who are active in this field or profession come from all backgrounds – everyone has a different entry point and nobody arrives with all constituent capabilities. It is therefore quite difficult to define just what are the right type and level of pre- existing knowledge, skills or experiences for those learning about data visualisation. As each year passes, the savvy-ness of the type of audience this book targets will increase, especially as the subject penetrates more into the mainstream. What were seen as bewilderingly new techniques several years ago are now commonplace to more people. That said, I think the following would be a fair outline of the type and shape of some of the most important prerequisite attributes for getting the most out of this book: Strong numeracy is necessary as well as a familiarity with basic statistics. While it is reasonable to assume limited prior knowledge of data 26
- 130. visualisation, there should be a strong desire to want to learn it. The demands of learning a craft like data visualisation take time and effort; the capabilities will need nurturing through ongoing learning and practice. They are not going to be achieved overnight or acquired alone from reading this book. Any book that claims to be able magically to inject mastery through just reading it cover to cover is over-promising and likely to under-deliver. The best data visualisers possess inherent curiosity. You should be the type of person who is naturally disposed to question the world around them or can imagine what questions others have. Your instinct for discovering and sharing answers will be at the heart of this activity. There are no expectations of your having any prior familiarity with design principles, but a desire to embrace some of the creative aspects presented in this book will heighten the impact of your work. Unlock your artistry! If you are somebody with a strong creative flair you are very fortunate. This book will guide you through when and crucially when not to tap into this sensibility. You should be willing to increase the rigour of your analytical decision making and be prepared to have your creative thinking informed more fundamentally by data rather than just instinct.
- 131. A range of technical skills covering different software applications, tools and programming languages is not expected for this book, as I will explain next, but you will ideally have some knowledge of basic Excel and some experience of working with data. I.3 Getting the Balance Handbook vs Tutorial Book The description of this book as being a ‘handbook’ positions it as being of practical help and presented in accessible form. It offers direction with comprehensive reference – more of a city guidebook for a tourist than an instruction manual to fix a washing machine. It will help you to know what things to think about, when to think about them, what options exist and how best to resolve all the choices involved in any data-driven design. Technology is the key enabler for working with data and creating 27 visualisation design outputs. Indeed, apart from a small proportion of artisan visualisation work that is drawn by hand, the reliance on technology to create visualisation work is an inseparable necessity. For
- 132. many there is a understandable appetite for step-by-step tutorials that help them immediately to implement data visualisation techniques via existing and new tools. However, writing about data visualisation through the lens of selected tools is a bit of a minefield, given the diversity of technical options out there and the mixed range of skills, access and needs. I greatly admire those people who have authored tutorial-based texts because they require astute judgement about what is the right level, structure and scope. The technology space around visualisation is characterised by flux. There are the ongoing changes with the enhancement of established tools as well as a relatively high frequency of new entrants offset by the decline of others. Some tools are proprietary, others are open source; some are easier to learn, others require a great deal of understanding before you can even consider embarking on your first chart. There are many recent cases of applications or services that have enjoyed fleeting exposure before reaching a plateau: development and support decline, the community of users disperses and there is a certain expiry of value. Deprecation of syntax and functions in programming languages requires the
- 133. perennial updating of skills. All of this perhaps paints a rather more chaotic picture than is necessarily the case but it justifies the reasons why this book does not offer teaching in the use of any tools. While tutorials may be invaluable to some, they may also only be mildly interesting to others and possibly of no value to most. Tools come and go but the craft remains. I believe that creating a practical, rather than necessarily a technical, text that focuses on the underlying craft of data visualisation with a tool-agnostic approach offers an effective way to begin learning about the subject in appropriate depth. The content should be appealing to readers irrespective of the extent of their technical knowledge (novice to advanced technicians) and specific tool experiences (e.g. knowledge of Excel, Tableau, Adobe Illustrator). There is a role for all book types. Different people want different sources of insight at different stages in their development. If you are seeking a text that provides in-depth tutorials on a range of tools or pages of programmatic instruction, this one will not be the best choice. However, if 28