1. THE RELATIONSHIP BETWEEN POTATO CONSUMPTION AND INSULIN
RESISTANCE IN PREGNANCY
Danielle Logan, Alexandra Grant, Katherine H. Ingram, Ph.D. (Faculty Mentor)
INTRODUCTION
Kennesaw State University Department of Exercise Science and Sport Management
WellStar College of Health and Human Services
OBJECTIVE
RESULTS
• Consumption of foods high in glycemic load can
have negative effects on metabolism. A high
glycemic diet can lead to increased weight gain,
insulin sensitivity, and impaired glucose tolerance.
The effects of a high glycemic diet have yet to be
observed in a pregnant population.
CONCLUSIONS
METHODS
FUNDING: This project is funded by internal research grants by the KSU
Office of the Vice President for Research and Center for Excellence in
Teaching and Learning (CETL).
• To examine the relationship between potato
consumption and insulin resistance during
pregnancy in obese and non-obese women.
• 27 women self-reported pre-pregnancy weight,
which allowed the determination of pre-
pregnancy BMI (kg/m2).
• Participants were divided by pre-pregnancy BMI
into 15 non-obese (BMI < 30 kg/m2) and 12
obese subjects (BMI > 30 kg/m2).
• Participants completed a diet questionnaire at
17-20 weeks gestation about the consumption of
various foods.
• Food intake was compared to insulin resistance
and 1 hour glucose tolerance test (GTT).
• Insulin resistance was determined by HOMA-IR
(Insulin (mU/L) x Glucose (mg/dL)/405).
• SPSS was used to compare food variables to
HOMA-IR, GTT, and weight gain using
Spearman’s Rho.
RESULTS
• In our study, eating potatoes is associated with
improved glucose tolerance, particularly in non-
obese pregnant women. Potato consumption
appears to be more associated with weight gain in
the obese pregnant women rather than insulin
resistance or glucose tolerance. It can be
determined that potato consumption may
contribute to a better metabolic health in non-
obese women.
Table 1- Participant Characteristics
• In the entire group, potato consumption has a
negative correlation with GTT. There was also a
positive correlation between gestational weight
gain at 20 weeks and consumption of mashed
potatoes.
• Non-obese women showed a significant
correlation between fried potatoes and 1 hour
GTT and overall potato score and GTT. This
group also showed a significant correlation
between sweet potatoes and gestational weight
gain at 20 weeks.
• In obese women, no relationship was observed
between insulin resistance and potato
consumption, however there was a strong
correlation between mashed potatoes and
gestational weight gain at 20 weeks.
Pre-Pregnancy BMI, self-reported height and weight before pregnancy; BMI at 20
weeks, height and weight recorded in the Human Performance Lab; Body Fat %,
measured via Bod Pod at 18-20 weeks; Glucose, 1 hour glucose tolerance test; Insulin,
measured by the Hb1Ac; HOMA-IR, calculated via ((glucose x insulin)/405)
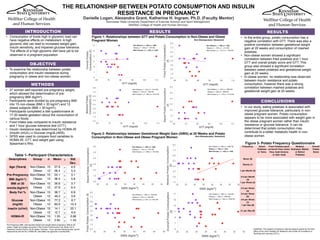
Figure 1- Relationships between GTT and Potato Consumption in Non-Obese and Obese
Pregnant Women
Figure 2- Relationships between Gestational Weight Gain (GWG) at 20 Weeks and Potato
Consumption in Non-Obese and Obese Pregnant Women
Non-Obese(purple); Obese(red)
Figure 3- Potato Frequency Questionnaire
Non-Obese(purple); Obese(red)
Descriptives Group n Mean ± Std.
Dev.
Age (Years) Non-Obese
Obese
15
12
27.9
26.4
±
±
4.0
5.4
Pre-Pregnancy
BMI (kg/m²)
Non-Obese
Obese
15
12
24.1
36.5
±
±
3.1
5.8
BMI at 20
weeks (kg/m²)
Non-Obese
Obese
15
12
26.6
37.8
±
±
3.7
6.4
Body Fat % Non-Obese
Obese
15
12
36.7
49.2
±
±
6.9
3.6
Glucose
(mg/dl)
Non-Obese
Obese
15
12
77.2
83.9
±
±
6.7
13.3
Insulin (ul/ml) Non-Obese
Obese
15
12
14.1
12.7
±
±
22.1
6.6
HOMA-IR Non-Obese
Obese
15
12
1.55
2.65
±
±
0.66
1.43
Non-Obese:(𝜌 = -.332; p = .292) NS
Obese:(𝜌 = .028; p = .935) NS
Both Groups: (𝜌 = -.179; p = .413) NS
Non-Obese:(𝜌 = -.318; p = ..313) NS
Obese:(𝜌 = .510; p = .109) NS
Both Groups: (𝜌 = -.360; p = .091) NS
Non-Obese:(𝜌 = -.598; p = .040)
Obese:(𝜌 = .-.276; p = ..411) NS
Both Groups: (𝜌 = -.314; p = ..144) NS
Non-Obese:(𝜌 = -.540; p = .050)
Obese:(𝜌 = -.430; p = .187) NS
Both Groups: (𝜌 = -.440; p = .036)
Non-Obese:(𝜌 = -.563; p = .045)
Obese:(𝜌 = -.414; p = .181) NS
Both Groups: (𝜌 = -.089; p = .672) NS
Non-Obese:(𝜌 = .204; p = .504) NS
Obese:(𝜌 = .243; p = .446) NS
Both Groups: (𝜌 = .261; p = .207) NS
Non-Obese:(𝜌 = .046; p = .882) NS
Obese:(𝜌 = .705; p = .010)
Both Groups: (𝜌 = .422; p = .035)
Non-Obese:(𝜌 = .395; p = .182) NS
Obese:(𝜌 = .265; p = .405) NS
Both Groups: (𝜌 = .342; p = .094) NS
Frequency Sweet
Potatoes
or Yams
Fried Potatoes (such
as french fries, home
fries, hash browns,
or tater toes)
Mashed,
Scaloped, Baked,
or Boiled
Potatoes
Overall
Potato
Score
Never (0)
Rarely (1)
1 per Month (2)
2-3 per Month
(3)
1 per Week (4)
2-3 per Week
(5)
3-4 per Week
(6)
4-6 per Week
(7)
1 per Day (8)
2+ per Day (9)