More Related Content Similar to excel_cheatsheet.pdf Similar to excel_cheatsheet.pdf (20) 1. © 2020 CustomGuide, Inc.
Click the topic links for free lessons!
Contact Us: sales@customguide.com
Columns
Microsoft®
Excel Cheat Sheet
Basic Skills
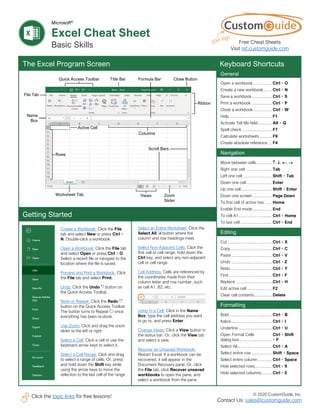
The Excel Program Screen Keyboard Shortcuts
Getting Started
Create a Workbook: Click the File
tab and select New or press Ctrl +
N. Double-click a workbook.
Open a Workbook: Click the File tab
and select Open or press Ctrl + O.
Select a recent file or navigate to the
location where the file is saved.
Preview and Print a Workbook: Click
the File tab and select Print.
Undo: Click the Undo button on
the Quick Access Toolbar.
Redo or Repeat: Click the Redo
button on the Quick Access Toolbar.
The button turns to Repeat once
everything has been re-done.
Use Zoom: Click and drag the zoom
slider to the left or right.
Select a Cell: Click a cell or use the
keyboard arrow keys to select it.
Select a Cell Range: Click and drag
to select a range of cells. Or, press
and hold down the Shift key while
using the arrow keys to move the
selection to the last cell of the range.
Select an Entire Worksheet: Click the
Select All button where the
column and row headings meet.
Select Non-Adjacent Cells: Click the
first cell or cell range, hold down the
Ctrl key, and select any non-adjacent
cell or cell range.
Cell Address: Cells are referenced by
the coordinates made from their
column letter and row number, such
as cell A1, B2, etc.
Jump to a Cell: Click in the Name
Box, type the cell address you want
to go to, and press Enter.
Change Views: Click a View button in
the status bar. Or, click the View tab
and select a view.
Recover an Unsaved Workbook:
Restart Excel. If a workbook can be
recovered, it will appear in the
Document Recovery pane. Or, click
the File tab, click Recover unsaved
workbooks to open the pane, and
select a workbook from the pane.
General
Open a workbook................ Ctrl + O
Create a new workbook....... Ctrl + N
Save a workbook................. Ctrl + S
Print a workbook ................. Ctrl + P
Close a workbook................ Ctrl + W
Help.................................... F1
Activate Tell Me field............ Alt + Q
Spell check ......................... F7
Calculate worksheets .......... F9
Create absolute reference ... F4
Navigation
Move between cells............. , , , →
Right one cell ...................... Tab
Left one cell ........................ Shift + Tab
Down one cell ..................... Enter
Up one cell.......................... Shift + Enter
Down one screen ................ Page Down
To first cell of active row ...... Home
Enable End mode ................ End
To cell A1............................ Ctrl + Home
To last cell........................... Ctrl + End
Editing
Cut ..................................... Ctrl + X
Copy................................... Ctrl + C
Paste .................................. Ctrl + V
Undo .................................. Ctrl + Z
Redo................................... Ctrl + Y
Find .................................... Ctrl + F
Replace .............................. Ctrl + H
Edit active cell ..................... F2
Clear cell contents............... Delete
Formatting
Bold.................................... Ctrl + B
Italics.................................. Ctrl + I
Underline ............................ Ctrl + U
Open Format Cells Ctrl + Shift
dialog box ........................... + F
Select All............................. Ctrl + A
Select entire row ................. Shift + Space
Select entire column............ Ctrl + Space
Hide selected rows.............. Ctrl + 9
Hide selected columns......... Ctrl + 0
Quick Access Toolbar Title Bar Formula Bar Close Button
Ribbon
File Tab
Name
Box
Rows
Scroll Bars
Active Cell
Views Zoom
Slider
Worksheet Tab
Free Cheat Sheets
Visit ref.customguide.com
2. © 2020 CustomGuide, Inc.
Click the topic links for free lessons!
Contact Us: sales@customguide.com
Edit a Workbook
Edit a Cell’s Contents: Select a cell and click in
the Formula Bar or double-click the cell. Edit
the cell’s contents and press Enter.
Clear a Cell’s Contents: Select the cell(s) and
press the Delete key. Or, click the Clear
button on the Home tab and select Clear
Contents.
Cut or Copy Data: Select cell(s) and click the
Cut or Copy button on the Home tab.
Paste Data: Select the cell where you want to
paste the data and click the Paste button in
the Clipboard group on the Home tab.
Preview an Item Before Pasting: Place the
insertion point where you want to paste, click
the Paste button list arrow in the Clipboard
group on the Home tab, and hold the mouse
over a paste option to preview.
Paste Special: Select the destination cell(s),
click the Paste button list arrow in the
Clipboard group on the Home tab, and select
Paste Special. Select an option and click OK.
Move or Copy Cells Using Drag and Drop:
Select the cell(s) you want to move or copy,
position the pointer over any border of the
selected cell(s), then drag to the destination
cells. To copy, hold down the Ctrl key before
starting to drag.
Find and Replace Text: Click the Find &
Select button, select Replace. Type the text
you want to find in the Find what box. Type the
replacement text in the Replace with box. Click
the Replace All or Replace button.
Check Spelling: Click the Review tab and click
the Spelling button. For each result, select
a suggestion and click the Change/Change
All button. Or, click the Ignore/Ignore All
button.
Insert a Column or Row: Right-click to the right
of the column or below the row you want to
insert. Select Insert in the menu, or click the
Insert button on the Home tab.
Delete a Column or Row: Select the row or
column heading(s) you want to remove. Right-
click and select Delete from the contextual
menu, or click the Delete button in the Cells
group on the Home tab.
Hide Rows or Columns: Select the rows or
columns you want to hide, click the Format
button on the Home tab, select Hide &
Unhide, and select Hide Rows or Hide
Columns.
Basic Formatting
Change Cell Alignment: Select the cell(s) you
want to align and click a vertical alignment
, , button or a horizontal alignment
, , button in the Alignment group on the
Home tab.
Format Text: Use the commands in the Font
group on the Home tab or click the dialog box
launcher in the Font group to open the dialog
box.
Format Values: Use the commands in the
Number group on the Home tab or click the
dialog box launcher in the Number group to
open the Format Cells dialog box.
Wrap Text in a Cell: Select the cell(s) that
contain text you want to wrap and click the
Wrap Text button on the Home tab.
Merge Cells: Select the cells you want to
merge. Click the Merge & Center button list
arrow on the Home tab and select a merge
option.
Cell Borders and Shading: Select the cell(s) you
want to format. Click the Borders button
and/or the Fill Color button and select an
option to apply to the selected cell.
Copy Formatting with the Format Painter:
Select the cell(s) with the formatting you want
to copy. Click the Format Painter button in
the Clipboard group on the Home tab. Then,
select the cell(s) you want to apply the copied
formatting to.
Adjust Column Width or Row Height: Click and
drag the right border of the column header or
the bottom border of the row header. Double-
click the border to AutoFit the column or row
according to its contents.
Basic Formulas
Enter a Formula: Select the cell where you want
to insert the formula. Type = and enter the
formula using values, cell references,
operators, and functions. Press Enter.
Insert a Function: Select the cell where you
want to enter the function and click the Insert
Function button next to the formula bar.
Reference a Cell in a Formula: Type the cell
reference (for example, B5) in the formula or
click the cell you want to reference.
SUM Function: Click the cell where you want to
insert the total and click the Sum button in
the Editing group on the Home tab. Enter the
cells you want to total, and press Enter.
MIN and MAX Functions: Click the cell where
you want to place a minimum or maximum
value for a given range. Click the Sum
button list arrow on the Home tab and select
either Min or Max. Enter the cell range you
want to reference, and press Enter.
COUNT Function: Click the cell where you want
to place a count of the number of cells in a
range that contain numbers. Click the Sum
button list arrow on the Home tab and select
Count Numbers. Enter the cell range you want
to reference, and press Enter.
Complete a Series Using AutoFill: Select the
cells that define the pattern, i.e. a series of
months or years. Click and drag the fill handle
to adjacent blank cells to complete the series.
Insert an Image: Click the Insert tab on the
ribbon, click either the Pictures or Online
Pictures button in the Illustrations group,
select the image you want to insert, and click
Insert.
Insert a Shape: Click the Insert tab on the
ribbon, click the Shapes button in the
Illustrations group, and select the shape you
wish to insert.
Hyperlink: Text or Images: Select the text or
graphic you want to use as a hyperlink. Click
the Insert tab, then click the Link button.
Choose a type of hyperlink in the left pane of
the Insert Hyperlink dialog box. Fill in the
necessary informational fields in the right pane,
then click OK.
Modify Object Properties and Alternative Text:
Right-click an object. Select Edit Alt Text in
the menu and make the necessary
modifications under the Properties and Alt Text
headings.
View and Manage Worksheets
Insert a New Worksheet: Click the Insert
Worksheet button next to the sheet tabs
below the active sheet. Or, press Shift + F11.
Delete a Worksheet: Right-click the sheet tab
and select Delete from the menu.
Hide a Worksheet: Right-click the sheet tab
and select Hide from the menu.
Rename a Worksheet: Double-click the sheet
tab, enter a new name for the worksheet, and
press Enter.
Change a Worksheet’s Tab Color: Right-click
the sheet tab, select Tab Color, and choose
the color you want to apply.
Move or Copy a Worksheet: Click and drag a
worksheet tab left or right to move it to a new
location. Hold down the Ctrl key while clicking
and dragging to copy the worksheet.
Switch Between Excel Windows: Click the
View tab, click the Switch Windows
button, and select the window you want to
make active.
Freeze Panes: Activate the cell where you want
to freeze the window, click the View tab on the
ribbon, click the Freeze Panes button in the
Window group, and select an option from the
list.
Select a Print Area: Select the cell range you
want to print, click the Page Layout tab on the
ribbon, click the Print Area button, and
select Set Print Area.
Adjust Page Margins, Orientation, Size, and
Breaks: Click the Page Layout tab on the
ribbon and use the commands in the Page
Setup group, or click the dialog box launcher
in the Page Setup group to open the Page
Basic Formatting Insert Objects
3. © 2020 CustomGuide, Inc.
Click the topic links for free lessons!
Contact Us: sales@customguide.com
Microsoft®
Excel Cheat Sheet
Intermediate Skills
Chart Elements
Charts
Create a Chart: Select the cell range that contains
the data you want to chart. Click the Insert tab on
the ribbon. Click a chart type button in the Charts
group and select the chart you want to insert.
Move or Resize a Chart: Select the chart. Place
the cursor over the chart’s border and, with the 4-
headed arrow showing, click and drag to move
it. Or, click and drag a sizing handle to resize it.
Change the Chart Type: Select the chart and click
the Design tab. Click the Change Chart Type
button and select a different chart.
Filter a Chart: With the chart you want to filter
selected, click the Filter button next to it.
Deselect the items you want to hide from the chart
view and click the Apply button.
Position a Chart’s Legend: Select the chart, click
the Chart Elements button, click the Legend
button, and select a position for the legend.
Show or Hide Chart Elements: Select the chart
and click the Chart Elements button. Then,
use the check boxes to show or hide each
element.
Insert a Trendline: Select the chart where you want
to add a trendline. Click the Design tab on the
ribbon and click the Add Chart Element
button. Select Trendline from the menu.
Charts
Insert a Sparkline: Select the cells you want to
summarize. Click the Insert tab and select the
sparkline you want to insert. In the Location Range
field, enter the cell or cell range to place the
sparkline and click OK.
Create a Dual Axis Chart: Select the cell range you
want to chart, click the Insert tab, click the
Combo button, and select a combo chart type.
Print and Distribute
Set the Page Size: Click the Page Layout tab.
Click the Size button and select a page size.
Set the Print Area: Select the cell range you want
to print. Click the Page Layout tab, click the Print
Area button, and select Set Print Area.
Print Titles, Gridlines, and Headings: Click the
Page Layout tab. Click the Print Titles button
and set which items you wish to print.
Add a Header or Footer: Click the Insert tab and
click the Header & Footer button. Complete the
header and footer fields.
Adjust Margins and Orientation: Click the Page
Layout tab. Click the Margins button to select
from a list of common page margins. Click the
Orientation button to choose Portrait or
Landscape orientation.
Column: Used to compare
different values vertically side-by-
side. Each value is represented in
the chart by a vertical bar.
Line: Used to illustrate trends
over time (days, months, years).
Each value is plotted as a point
on the chart and values are
connected by a line.
Pie: Useful for showing values as
a percentage of a whole when all
the values add up to 100%. The
values for each item are
represented by different colors.
Bar: Similar to column charts,
except they display information in
horizontal bars rather than in
vertical columns.
Area: Similar to line charts,
except the areas beneath the
lines are filled with color.
XY (Scatter): Used to plot
clusters of values using single
points. Multiple items can be
plotted by using different colored
points or different point symbols.
Stock: Effective for reporting the
fluctuation of stock prices, such
as the high, low, and closing
points for a certain day.
Surface: Useful for finding
optimum combinations between
two sets of data. Colors and
patterns indicate values that are
in the same range.
Chart Options
Chart Types
Additional Chart Elements
Data Labels: Display values from the cells
of the worksheet on the plot area of the
chart.
Data Table: A table added next to the
chart that shows the worksheet data the
chart is illustrating.
Error Bars: Help you quickly identify
standard deviations and error margins.
Trendline: Identifies the trend of the
current data, not actual values. Can also
identify forecasts for future data.
Chart Title
Data
Bar
Chart
Area
Axis
Titles
Legend
Chart
Elements
Chart
Styles
Chart
Filters
Gridline
Free Cheat Sheets
Visit ref.customguide.com
4. © 2020 CustomGuide, Inc.
Click the topic links for free lessons!
Contact Us: sales@customguide.com
Intermediate Formulas
Absolute References: Absolute references
always refer to the same cell, even if the
formula is moved. In the formula bar, add dollar
signs ($) to the reference you want to remain
absolute (for example, $A$1 makes the
column and row remain constant).
Name a Cell or Range: Select the cell(s), click
the Name box in the Formula bar, type a name
for the cell or range, and press Enter. Names
can be used in formulas instead of cell
addresses, for example: =B4*Rate.
Reference Other Worksheets: To reference
another worksheet in a formula, add an
exclamation point ‘!’ after the sheet name in
the formula, for example: =FebruarySales!B4.
Reference Other Workbooks: To reference
another workbook in a formula, add brackets
‘[ ]’ around the file name in the formula, for
example:
=[FebruarySales.xlsx]Sheet1!$B$4.
Order of Operations: When calculating a
formula, Excel performs operations in the
following order: Parentheses, Exponents,
Multiplication and Division, and finally Addition
and Subtraction (as they appear left to right).
Use this mnemonic device to remember them:
Please Parentheses
Excuse Exponents
My Multiplication
Dear Division
Aunt Addition
Sally Subtraction
Concatenate Text: Use the CONCAT function
=CONCAT(text1,text2,…) to join the text
from multiple cells into a single cell. Use the
arguments within the function to define the text
you want to combine as well as any spaces or
punctuation.
Payment Function: Use the PMT function
=PMT(rate,nper,pv,…) to calculate a loan
amount. Use the arguments within the function
to define the loan rate, number of periods, and
present value and Excel calculates the
payment amount.
Date Functions: Date functions are used to add
a specific date to a cell. Some common date
functions in Excel include:
Date =DATE(year,month,day)
Today =TODAY()
Now =NOW()
Display Worksheet Formulas: Click the
Formulas tab on the ribbon and then click the
Show Formulas button. Click the Show
Formulas button again to turn off the
formula view.
Manage Data
Export Data: Click the File tab. At the left,
select Export and click Change File Type.
Select the file type you want to export the data
to and click Save As.
Import Data: Click the Data tab on the ribbon
and click the Get Data button. Select the
category and data type, and then the file you
want to import. Click Import, verify the
preview, and then click the Load button.
Use the Quick Analysis Tools: Select the cell
range you want to summarize. Click the Quick
Analysis button that appears. Select the
analysis tool you want to use. Choose from
formatting, charts, totals, tables, or sparklines.
Outline and Subtotal: Click the Data tab on the
ribbon and click the Subtotal button. Use
the dialog box to define which column you want
to subtotal and the calculation you want to use.
Click OK.
Use Flash Fill: Click in the cell to the right of the
cell(s) where you want to extract or combine
data. Start typing the data in the column. When
a pattern is recognized, Excel predicts the
remaining values for the column. Press Enter
to accept the Flash Fill values.
Create a Data Validation Rule: Select the cells
you want to validate. Click the Data tab and
click the Data Validation button. Click the
Allow list arrow and select the data you want
to allow. Set additional validation criteria
options and click OK.
Tables
Format a Cell Range as a Table: Select the
cells you want to apply table formatting to. Click
the Format as Table button in the Styles
group of the Home tab and select a table
format from the gallery.
Sort Data: Select a cell in the column you want
to sort. Click the Sort & Filter button on the
Home tab. Select a sort order or select
Custom Sort to define specific sort criteria.
Filter Data: Click the filter arrow for the
column you want to filter. Uncheck the boxes
for any data you want to hide. Click OK.
Add Table Rows or Columns: Select a cell in
the row or column next to where you want to
add blank cells. Click the Insert button list
arrow on the Home tab. Select either Insert
Table Rows Above or Insert Table Columns
to the Left.
Tables
Remove Duplicate Values: Click any cell in the
table and click the Data tab on the ribbon. Click
the Remove Duplicates button. Select
which columns you want to check for duplicates
and click OK.
Insert a Slicer: With any cell in the table
selected, click the Design tab on the ribbon.
Click the Insert Slicer button. Select the
columns you want to use as slicers and click
OK.
Table Style Options: Click any cell in the table.
Click the Design tab on the ribbon and select
an option in the Table Style Options group.
Intermediate Formatting
Apply Conditional Formatting: Select the cells
you want to format. On the Home tab, click the
Conditional Formatting button. Select a
conditional formatting category and then the
rule you want to use. Specify the format to
apply and click OK.
Apply Cell Styles: Select the cell(s) you want to
format. On the Home tab, click the Cell Styles
button and select a style from the menu. You
can also select New Cell Style to define a
custom style.
Apply a Workbook Theme: Click the Page
Layout tab on the ribbon. Click the Themes
button and select a theme from the menu.
Collaborate with Excel
Add a Cell Comment: Click the cell where you
want to add a comment. Click the Review tab
on the ribbon and click the New Comment
button. Type your comment and then click
outside of it to save the text.
Invite People to Collaborate: Click the Share
button on the ribbon. Enter the email addresses
of people you want to share the workbook with.
Click the permissions button, select a
permission level, and click Apply. Type a short
message and click Send.
Co-author Workbooks: When another user
opens the workbook, click the user’s picture or
initials on the ribbon, to see what they are
editing. Cells being edited by others appear
with a colored border or shading.
Protect a Worksheet: Before protecting a
worksheet, you need to unlock any cells you
want to remain editable after the protection is
applied. Then, click the Review tab on the
ribbon and click the Protect Sheet button.
Select what you want to remain editable after
the sheet is protected.
Add a Workbook Password: Click the File tab
and select Save As. Click Browse to select a
save location. Click the Tools button in the
dialog box and select General Options. Set a
password to open and/or modify the workbook.
Click OK.
5. © 2020 CustomGuide, Inc.
Click the topic links for free lessons!
Contact Us: sales@customguide.com
Microsoft®
Excel Cheat Sheet
Advanced Skills
PivotTable Elements
PivotTables
Create a PivotTable: Select the data range to be
used by the PivotTable. Click the Insert tab on
the ribbon and click the PivotTable button in
the Tables group. Verify the range and then click
OK.
Add Multiple PivotTable Fields: Click a field in the
field list and drag it to one of the four PivotTable
areas that contains one or more fields.
Filter PivotTables: Click and drag a field from the
field list into the Filters area. Click the field’s list
arrow above the PivotTable and select the
value(s) you want to filter.
Group PivotTable Values: Select a cell in the
PivotTable that contains a value you want to
group by. Click the Analyze tab on the ribbon
and click the Group Field button. Specify how
the PivotTable should be grouped and then click
OK.
Refresh a PivotTable: With the PivotTable
selected, click the Analyze tab on the ribbon.
Click the Refresh button in the Data group.
Format a PivotTable: With the PivotTable
selected, click the Design tab. Then, select
desired formatting options from the PivotTable
Options group and the PivotTable Styles group
PivotCharts
Create a PivotChart: Click any cell in a PivotTable
and click the Analyze tab on the ribbon. Click the
PivotChart button in the Tools group. Select a
PivotChart type and click OK.
Modify PivotChart Data: Drag fields into and out of
the field areas in the task pane.
Refresh a PivotChart: With the PivotChart selected,
click the Analyze tab on the ribbon. Click the
Refresh button in the Data group.
Modify PivotChart Elements: With the PivotChart
selected, click the Design tab on the ribbon. Click
the Add Chart Element button in the Chart
Elements group and select the item(s) you want to
add to the chart.
Apply a PivotChart Style: Select the PivotChart and
click the Design tab on the ribbon. Select a style
from the gallery in the Chart Styles group.
Update Chart Type: With the PivotChart selected,
click the Design tab on the ribbon. Click the
Change Chart Type button in the Type group.
Select a new chart type and click OK.
Enable PivotChart Drill Down: Click the Analyze
tab. Click the Field Buttons list arrow in the
Show/Hide group and select Show
Expand/Collapse Entire Field Buttons.
The PivotTable Fields pane controls how
data is represented in the PivotTable.
Click anywhere in the PivotTable to
activate the pane. It includes a Search
field, a scrolling list of fields (these are
the column headings in the data range
used to create the PivotTable), and four
areas in which fields are placed. These
four areas include:
Filters: If a field is placed in the
Filters area, a menu appears above
the PivotTable. Each unique value
from the field is an item in the
menu, which can be used to filter
PivotTable data.
Column Labels: The unique
values for the fields placed in the
Columns area appear as column
headings along the top of the
PivotTable.
Row Labels: The unique values for
the fields placed in the Rows area
appear as row headings along the
left side of the PivotTable.
Values: The values are the “meat”
of the PivotTable, or the actual data
that’s calculated for the fields
placed in the rows and/or columns
area. Values are most often
numeric calculations.
Not all PivotTables will have a field in
each area, and sometimes there will be
multiple fields in a single area.
PivotTable Layout
PivotTable Fields Pane
The Layout Group
Subtotals: Show or hide subtotals and
specify their location in the PivotTable.
Grand Totals: Add or remove grand total
rows for columns and/or rows.
Report Layout: Adjust the report layout to
show in compact, outline, or tabular form.
Blank Rows: Emphasize groups of data
by manually adding blank rows between
grouped items.
Free Cheat Sheets
Visit ref.customguide.com
Field
List
PivotTable Field
Areas
PivotTable Fields
Pane
Fields Pane
Options
Tools
Menu
Search PivotTable
Fields
Active PivotTable
6. © 2020 CustomGuide, Inc.
Click the topic links for free lessons!
Contact Us: sales@customguide.com
Macros
Enable the Developer Tab: Click the File tab
and select Options. Select Customize
Ribbon at the left. Check the Developer
check box and click OK.
Record a Macro: Click the Developer tab on
the ribbon and click the Record Macro
button. Type a name and description then
specify where to save it. Click OK. Complete
the steps to be recorded. Click the Stop
Recording button on the Developer tab.
Run a Macro: Click the Developer tab on the
ribbon and click the Macros button. Select
the macro and click Run.
Edit a Macro: Click the Developer tab on the
ribbon and click the Macros button. Select a
macro and click the Edit button. Make the
necessary changes to the Visual Basic code
and click the Save button.
Delete a Macro: Click the Developer tab on
the ribbon and click the Macros button.
Select a macro and click the Delete button.
Macro Security: Click the Developer tab on
the ribbon and click the Macro Security
button. Select a security level and click OK.
Troubleshoot Formulas
Common Formula Errors:
• ####### - The column isn’t wide enough to
display all cell data.
• #NAME? - The text in the formula isn’t
recognized.
• #VALUE! - There is an error with one or
more formula arguments.
• #DIV/0 - The formula is trying to divide a
value by 0.
• #REF! - The formula references a cell that
no longer exists.
Trace Precedents: Click the cell containing the
value you want to trace and click the Formulas
tab on the ribbon. Click the Trace Precedents
button to see which cells affect the value in
the selected cell.
Error Checking: Select a cell containing an
error. Click the Formulas tab on the ribbon
and click the Error Checking button in the
Formula Auditing group. Use the dialog to
locate and fix the error.
The Watch Window: Select the cell you want to
watch. Click the Formulas tab on the ribbon
and click the Watch Window button. Click
the Add Watch button. Ensure the correct
cell is identified and click Add.
Evaluate a Formula: Select a cell with a
formula. Click the Formulas tab on the ribbon
and click the Evaluate Formula button.
Advanced Formatting
Customize Conditional Formatting: Click the
Conditional Formatting button on the
Home tab and select New Rule. Select a rule
type, then edit the styles and values. Click OK.
Edit a Conditional Formatting Rule: Click the
Conditional Formatting button on the
Home tab and select Manage Rules. Select the
rule you want to edit and click Edit Rule. Make
your changes to the rule. Click OK.
Change the Order of Conditional Formatting
Rules: Click the Conditional Formatting
button on the Home tab and select Manage
Rules. Select the rule you want to re-sequence.
Click the Move Up or Move Down arrow
until the rule is positioned correctly. Click OK.
Analyze Data
Goal Seek: Click the Data tab on the ribbon.
Click the What-If Analysis button and select
Goal Seek. Specify the desired value for the
given cell and which cell can be changed to
reach the desired result. Click OK.
Advanced Formulas
Nested Functions: A nested function is when
one function is tucked inside another function as
one of its arguments, like this:
IF: Performs a logical test to return one value for
a true result, and another for a false result.
AND, OR, NOT: Often used with IF to support
multiple conditions.
• AND requires multiple conditions.
• OR accepts several different conditions.
• NOT returns the opposite of the condition.
SUMIF and AVERAGEIF: Calculates cells that
meet a condition.
• SUMIF finds the total.
• AVERAGEIF finds the average.
Advanced Formulas
VLOOKUP: Looks for and retrieves data from a
specific column in a table.
HLOOKUP: Looks for and retrieves data from a
specific row in a table.
UPPER, LOWER, and PROPER: Changes how
text is capitalized.
UPPER Case | lower case | Proper Case
LEFT and RIGHT: Extracts a given number of
characters from the left or right.
MID: Extracts a given number of characters
from the middle of text; the example below
would return “day”.
MATCH: Locates the position of a lookup value
in a row or column.
INDEX: Returns a value or the reference to a
value from within a range.
Jan Feb Total
13,020
7,010
6,010
7. Contact Us! sales@customguide.com 612.871.5004
Get More Free Quick References!
Visit ref.customguide.com to download.
Office 365
Access
Excel
Office 365
OneNote
Outlook
PowerPoint
Teams
Word
G Suite
Classroom
G Suite
Gmail
Google Calendar
Google Docs
Google Drive
Google Sheets
Google Slides
OS
Mac OS
Windows 10
Productivity
Digital Literacy
Salesforce
Soft Skills
Business Writing
Email Etiquette
Manage Meetings
Presentations
Security Basics
SMART Goals
+ more, including Spanish versions
Loved by Learners, Trusted by Trainers
Please consider our other training products!
Interactive eLearning
Get hands-on training with bite-sized tutorials that
recreate the experience of using actual software.
SCORM-compatible lessons.
Customizable Courseware
Why write training materials when we’ve done it
for you? Training manuals with unlimited printing
rights!
Over 3,000 Organizations Rely on CustomGuide
The toughest part [in training] is creating the material, which CustomGuide has
done for us. Employees have found the courses easy to follow and, most
importantly, they were able to use what they learned immediately.
“