1. EUROPEANMarket indicators
SPRING 2009
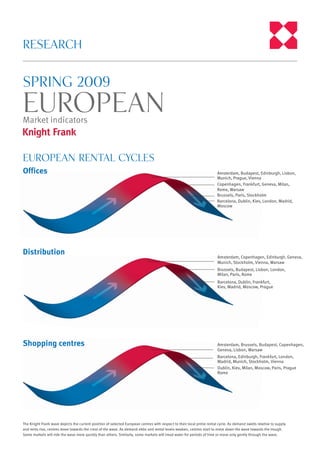
European rental cycles
Offices
RESEARCH
Distribution
Shopping centres
Amsterdam, Budapest, Edinburgh, Lisbon,
Munich, Prague, Vienna
The Knight Frank wave depicts the current position of selected European centres with respect to their local prime rental cycle. As demand swells relative to supply
and rents rise, centres move towards the crest of the wave. As demand ebbs and rental levels weaken, centres start to move down the wave towards the trough.
Some markets will ride the wave more quickly than others. Similarly, some markets will tread water for periods of time or move only gently through the wave.
Amsterdam, Copenhagen, Edinburgh, Geneva,
Munich, Stockholm, Vienna, Warsaw
Brussels, Budapest, Lisbon, London,
Milan, Paris, Rome
Dublin, Kiev, Milan, Moscow, Paris, Prague
Rome
Barcelona, Edinburgh, Frankfurt, London,
Madrid, Munich, Stockholm, Vienna
Amsterdam, Brussels, Budapest, Copenhagen,
Geneva, Lisbon, Warsaw
Copenhagen, Frankfurt, Geneva, Milan,
Rome, Warsaw
Brussels, Paris, Stockholm
Barcelona, Dublin, Kiev, London, Madrid,
Moscow
Barcelona, Dublin, Frankfurt,
Kiev, Madrid, Moscow, Prague
2. www.knightfrank.com
Knight Frank LLP is a limited liability partnership registered in England with registered number OC305934.
Our registered office is 55 Baker Street, London, W1U 8AN, where you may look at a list of members’ names.
International Research
Matthew Colbourne
Senior Analyst
+44 (0)20 7861 1238
matthew.colbourne@knightfrank.com
European Investment Team
Andrew Sim
Partner, Head of European Investment
+44 (0)20 7861 1193
andrew.sim@knightfrank.com
European Valuations Team
Nick Powlesland
Partner, Head of European Valuations
+44 (0)20 7861 1283
nick.powlesland@knightfrank.com
SPRING 2009
EUROPEANMarket indicators
0
5
10
15
20
WarsawPragueParisMunichMoscowMilanMadridLondonLisbonFrankfurtDublinBrusselsAmsterdam
Q2 2007 Q4 2007 Q2 2008 Q4 2008
Figure 1
European office vacancy rates (%)
Source: Knight Frank
Market monitor – Spring 2009
Offices Distribution Retail (shopping centres)
City Prime rents Prime yields Prime rents Prime yields Prime rents Prime yields
(€/sq m/yr) (%) (€/sq m/yr) (%) (€/sq m/yr) (%)
Amsterdam 325 6.50 95 7.50 1,200 6.50
Barcelona 300 6.25 90 7.50 840 6.25
Brussels 275 6.25 45 7.75 1,200 6.50
Budapest 240 7.75 66 8.50 1,200 7.50
Copenhagen 250 5.75 75 7.25 740 6.25
Dublin 560 7.25 116 8.75 4,500* 7.50
Edinburgh 353 7.00 85 8.00 2,129* 7.25
Frankfurt 456 5.50 78 7.50 1,920* 6.50
Geneva 496 5.50 112 7.00 650 6.00
Kiev 474 13.00 99 14.00 948 14.00
Lisbon 252 7.00 78 7.50 900 6.75
London 1,126 5.75 158 7.75 5,354* 7.00
Madrid 504 6.00 96 7.50 1,080 6.00
Milan 500 5.75 50 7.50 650 6.25
Moscow 869 12.00 107 13.00 1,619 13.00
Munich 378 5.25 78 7.50 1,800* 6.25
Paris 800 5.75 56 7.50 2,800 6.00
Prague 258 6.75 54 8.00 600 6.75
Rome 475 6.00 50 7.50 600 6.25
Stockholm 415 5.75 87 7.50 800 6.25
Vienna 276 5.50 60 7.50 960 6.00
Warsaw 348 6.75 75 8.25 1,080 7.00
Indicative prime yields, as quoted locally, based upon a hypothetical Grade A unit. Office rents are for prime city area Grade A space, 2,000 sq m. Shopping Centre rents are based on prime covered
shopping malls, quoted on best position, 100 sq m units. Distribution rents are for prime industrial space of units over 5,000 sq m. The data above is provided for general reference purposes only.
Local market conditions will vary. *Zoned/weighted figure.